In my previous article, Backtesting Tip: Parameters inside CQG Code, I discussed the different parameter types and how to use them. This is important for all backtesting users because only values created as a parameter (Parms) can be optimized with CQG's Trade System Optimizer (TSO).

The quickest way to get to the Trade System Optimizer is to right-click the P&L curve of a trading system and select Optimize. After the TSO window appears, we need to click the Specify button to setup the process according to our needs.
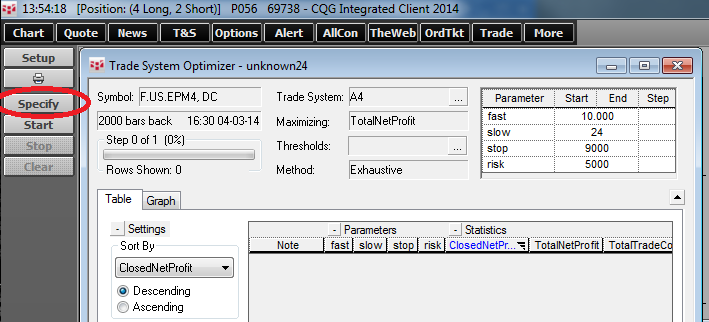
Setup dialog has a few points that need to be addressed before we can start the calculation process. We have divided the necessary setups into 7 sections and we will discuss each of them.
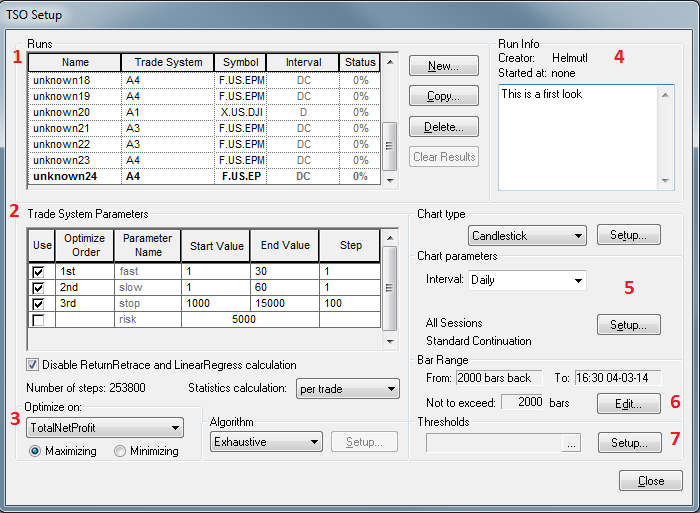
Section 1
Under the first section, Runs, we can specify a name for this particular calculation and select the trading system, actual symbol, and chart interval for the optimization. If we used the right-click from a Trade Systems P&L curve method, the main information will be filled in automatically.
Section 2
This is probably the most important part. All parameters used inside the trading system are listed here. We can activate them by checking the first box and selecting start and end values for each of them.
In this example, the first two are simple moving averages, which can have any value between 1-30 or, for the slower moving average, 1-60. Step 1 means the system alternates every single value for the MA, like 1, 2, 3, etc. up to 30 in case of the first MA. The third parameter is a classic stop loss that could be somewhere between $1,000 and $15,000. There is no need to compare a $1,000 stop loss to a $1,001 stop loss; therefore, the step rate is set to $100 (i.e., we will test $1,000, $1,100, $1,200, etc. up to $15,000).
It is important to keep in mind that the more parameters we optimize at the same time, the more possible combinations we will end up with, referenced in CQG as the number of steps.
Two parameters with 20 possible values each would result in: 20 x 20 = 400 steps.
Four parameters with 20 possible values each would result in: 20 x 20 x 20 x 20 = 160,000 steps.
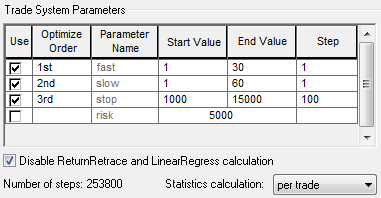
With our example, we end up with 253,800 possible different combinations.
Section 3
In the Optimize on section, we can select any of the trade system statistics to be optimized to the minimum or maximum. For example, instead of maximizing TotelNetProfit we could try to minimize the MaximumDrawAmount.
Depending on the number of steps, we can also set the Algorithm to Exhaustive, which calculates every possible combination (brute force), or Genetic, which uses a sophisticated mathematical model in order to reduce the number of calculations.

It would be far off the scope of this article to explain the Genetic algorithm in detail, but the only parameter I would play with is the number of steps. Maybe 10% of the possible steps might be a good starting point.
Section 4
We can make notes here.
Section 5
This is where we can adjust the chart settings in detail completely in line with all the options on a normal chart.
Section 6
The optimization period (bars back or from date to date) can be changed here.
Section 7
In this section we can define thresholds if we are only interested in trade system results that meet certain criteria (e.g., minimum number of trades).

Once everything is set up correctly, we can close the Setup dialog and start the calculation by clicking the Start button. The system then starts to calculate all trading results based on our settings.
Once the process is completed, we will get a table with the best results. We can sort by any of the statistics by selecting the criteria in the Settings section or by clicking the headlines.
A little hint: I would not just look for the best results, I would also have a close look at all the other statistics. Maybe pick a data set with less profit, but with better secondary stats.
Also keep in mind that optimization is always some kind of curve fitting. We just find the best results for that particular data sample, but this is no guarantee that it will continue with similar results into the future. I would at least carefully use some walk-forward optimization processes to avoid over fitting. If we look on the Internet, we will find tons of useful material around optimization methods, for example: en.wikipedia.org/wiki/Walk_forward_optimization.

This is a sample result for two moving averages and a bit of pyramiding being optimized with TSO.
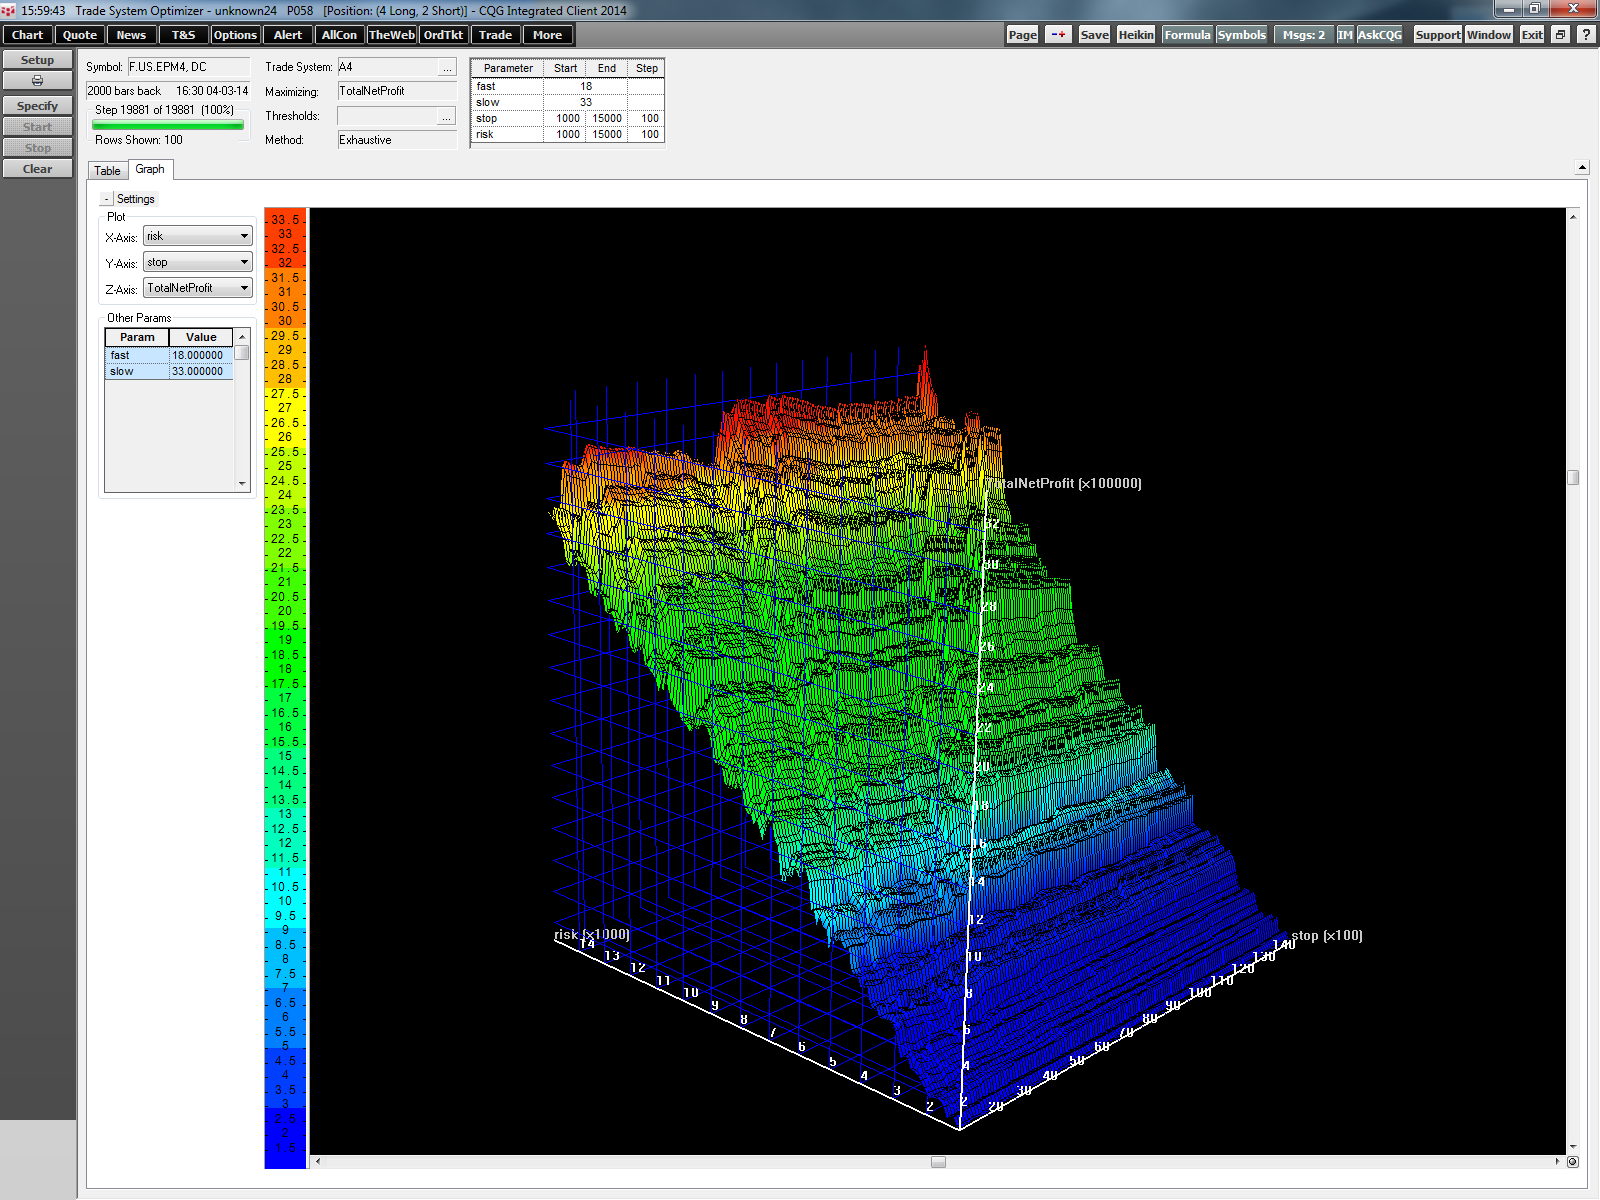
CQG also provides a 3D view of the results. We need to pick your parameters for the X- and Y-axis, and our statistic for the Z-axis (result axis).
This example uses the fast moving average on the X-axis and the slower moving average on the Y-axis. The result is total net profit.

This graphical representation also gives us a very good hint about the stability of the trading system. We don't want big winning spikes next to deep loosing holes.
The next graphic is an example after optimizing the money managing parameters.
Risk on the X-axis is the value when we kick in the next trade on a pyramid. If the first trade made a certain amount of money, we initiate a new trade. The stop on the Y-axis is a classical stop loss. There seems to be some causality:
Higher Risk Value = Higher Total Net Profit
The stop seems to have little impact.
While trading is a skill, taking a more scientific approach by testing our reasons for entering and exiting positions over different historical periods will raise our skill levels.