What is the right time frame for your trading?
Any data we analyze is more representative if we have a bigger number of samples. Asking ten people how the next elections will turn out will most likely give you a less accurate picture than asking 100,000 people.
Generally speaking, chart data gives you a more accurate representation of market behavior on a longer time frame, like sixty-minute or daily charts, than it does on shorter time frames, like one- or two-minute bars. A pattern or any kind of entry signal is more representative when you look at longer time frames.
For the financial risk you are dealing with, the exact opposite is true. Looking at sixty-minute data, you have to wait an hour before you get the next signal or you can make your next decision. The implied risk you are looking at can be determined by this simple formula:
PriceToDollar(TrueRange(@))
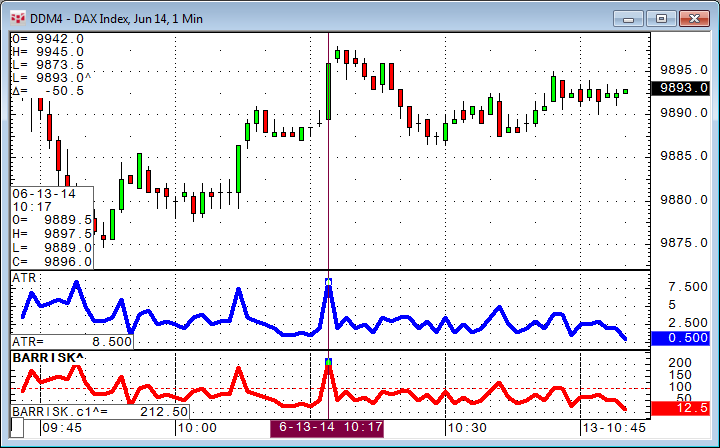
Looking at an 8.5 point range (blue line) on the DAX future would give you an implied risk of 212.50€ (red line) for the highlighted bar.
Normally you would like to smooth that curve a little bit to have less bouncy values for your pre-trade risk considerations.
PriceToDollar(MA(TrueRange(@),Sim,10))
This is basically an ATR (Average True Range) but converted into money instead of points. The Turtles used two ATRs for their risk considerations. So technically, you could multiply the risk formula by two if you want.
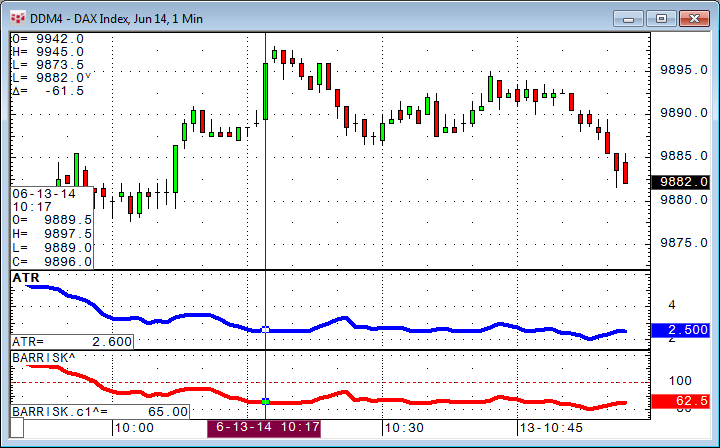
Let's say you have a trading account of 100,000€ and you are willing to risk 500€ per trade. With an implied risk of 62.5€ for the next possible trade, you would be good to go on this one-minute chart, but on the other hand you want better quality signals (more sample data) for your trading decision.
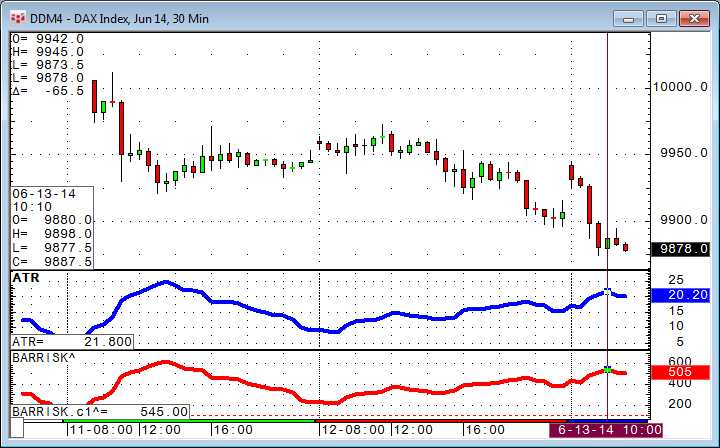
On this thirty-minute chart, the implied risk is slightly above 500€ for the next trade and you are still good to go.
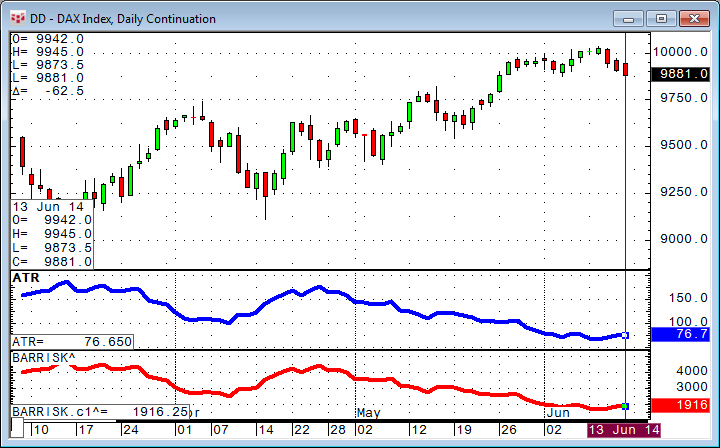
On this daily chart the implied risk oscillates between 1900€ and 4500€. You should not be trading in this time frame if you want to follow these kind of risk considerations (500€ per trade).
This is a very simple study to give you an idea of the risk exposure on different markets and time frames even if you are not a backtesting user. This kind of formula can be created on any CQG Integrated Client or CQG QTrader.
In an earlier article, we used the same kind of formula to calculate the number of contracts per trade inside of a trading system.
Some markets, especially those with overnight sessions, vary widely in their respective trading ranges. Following this approach, you would need to adjust the time frame multiple times per day.
This is where range bars come into play. Instead of using a fixed time frame, you define how much range (i.e., implied risk) you want the bars to have. If there is a lot of price movement, the charts simply move faster than on less volatile periods.