In this article we will look into different ways to use an event to set up a trading opportunity. We will review the differences between BarsSince, Happenedwithin, and Set/Reset.
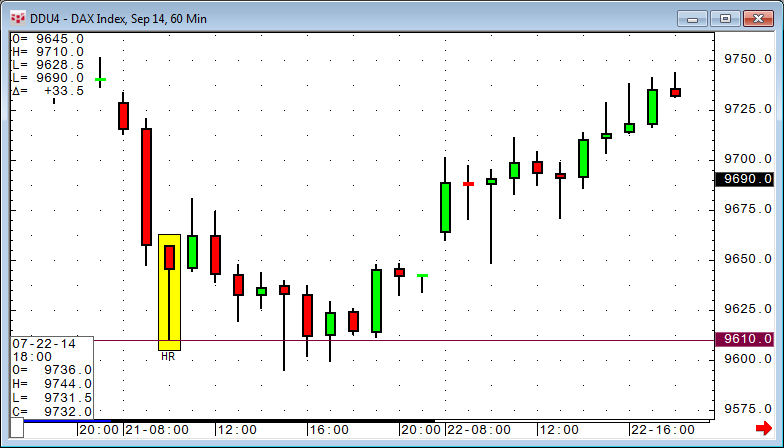
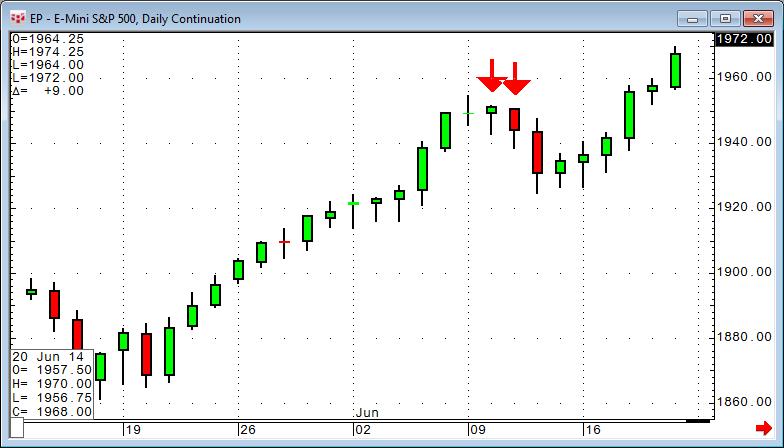
The first example is very simple. We want to buy the low of the candlestick formation hammer, but only if this trading opportunity happens within a certain number of bars. To reference the hammer, we use the simple function:
CSForm(@) = 3
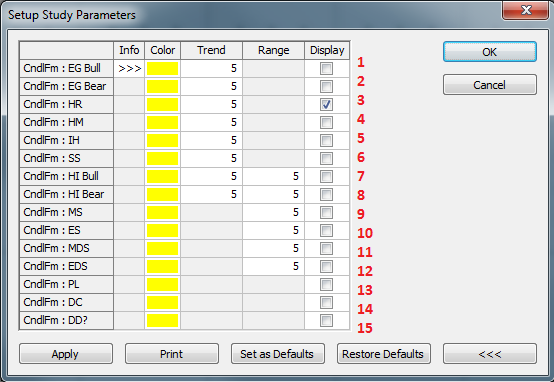
How did we know the hammer is number 3?
Looking at the Setup Study Parameters dialog, the candlestick formations are simply numbered from 1 to 15. Hammer (HR) is 3 and Bullish Harami (HI Bull), for instance, is 7.
We want a break of the hammer low, but only within the next 5 bars. The formula is:
Low(@) (Low(@) WHEN CSForm(@) = 3) AND BarsSince(CSForm(@) = 3,1,400) 6
The BarsSince function counts the number of bars since a specified event occurred.
Setup parameters:
- NEvents: Allows the user to specify an occurrence number other than one before the count begins.
- Max Bars to Search: Selects the maximum number of bars to cover.
The next scenario is a little bit different. After a long trend with at least 13 green candles (out of 15 candles allowing 1-2 red candles), we look for a bar that fails to make a new high. Because we want to have 13 out of 15 bars meet a condition, it is easy to use the HappenedWithin function:
High(@) High(@)[-1] AND HappenedWithin(Close(@) > Open(@),15,13)
The high is less than the high one bar before, and 13 times out of 15, the close is higher than the open.
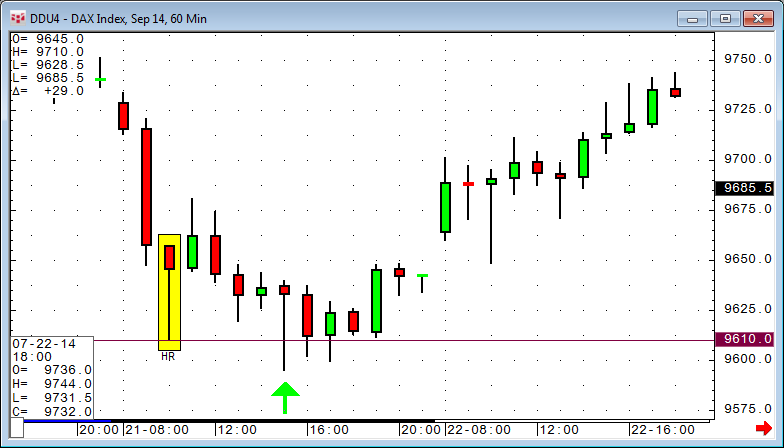
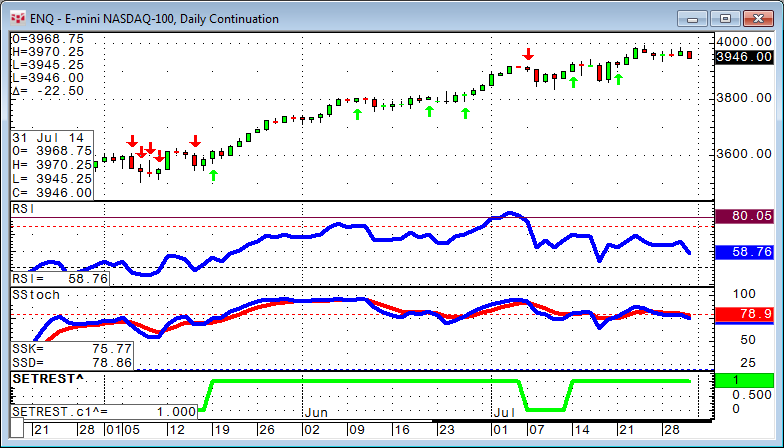
The third option is to switch on and off an allowance for trading based on two totally different rules or indicators. In this example we use the Slow Stochastic to turn on an allowance for long trades. The code is:
SSK(@,10,Smo,3) XABOVE SSD(@,10,Smo,3,Smo,3) AND SSK(@,10,Smo,3) > 75
These are the green arrows on the chart.
To revoke the allowance for long trades, we use the RSI if it drops below 80 or if it is below 50:
RSI(@,13) XBELOW 80 OR RSI(@,13) 50
These are the red arrows.
To put these two different scenarios into one rule, we use the Set/Reset function. If you place Set/Reset into a formula from the toolbox, it is:
SetRst(@,@)
The function works like a simple switch. You substitute the first @ sign with the code that switches "the light on" and the second @ with the code that switches it off. In a custom study, it will be represented as 1 for on and 0 for off, just like any other Boolean.
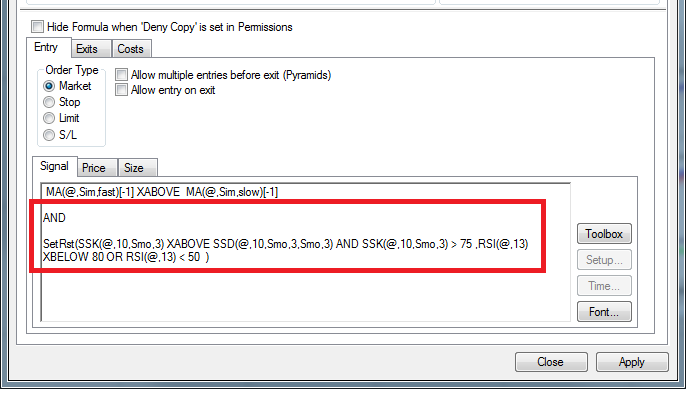
The complete code is:
SetRst(SSK(@,10,Smo,3) XABOVE SSD(@,10,Smo,3,Smo,3) AND SSK(@,10,Smo,3) > 75 ,RSI(@,13) XBELOW 80 OR RSI(@,13) 50 )
In the chart, it is the green line displaying ones and zeroes.
To use this inside a trading system, you just need to add the filter to the signal portion of your entry.