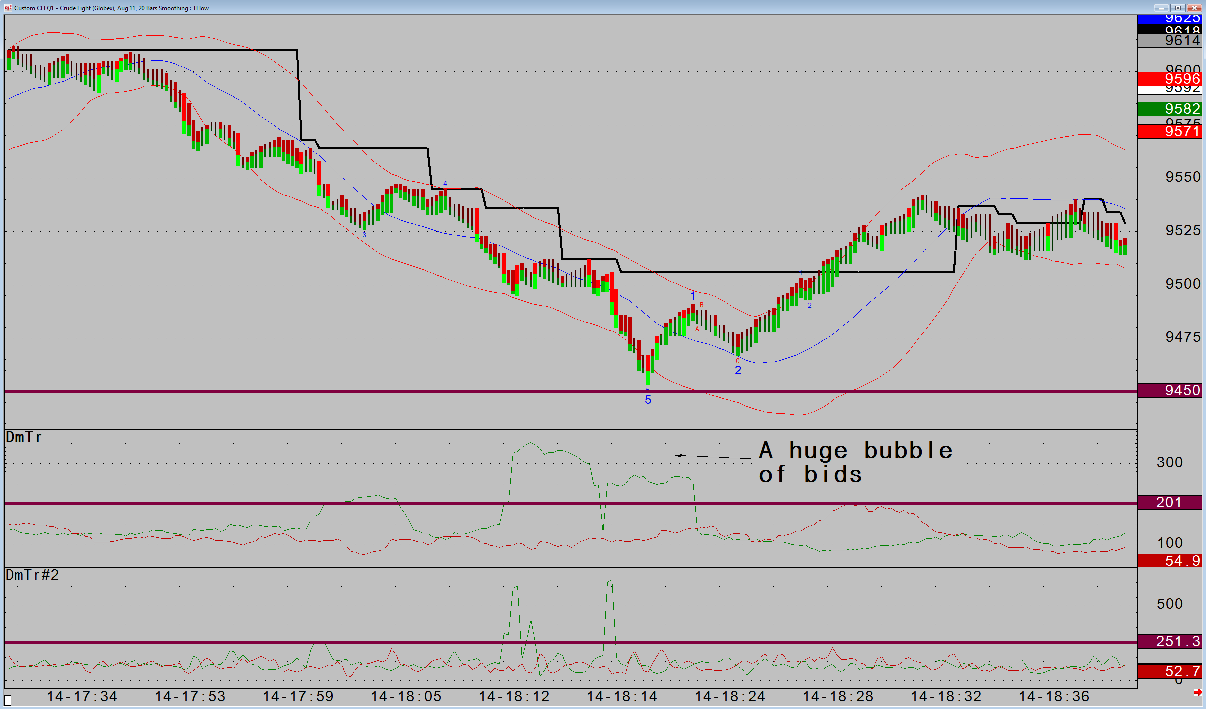
Analysis of TFlow® volume and the DOMTracker reveals that each market has its own dynamics and limits. When these limits are reached, exhaustion and major turning points can occur. Smoothed TFlow differs from the normal aggregation in that it uses a proprietary algorithm to redefine the data to remove lag whilst maintaining sensitivity. This means that the absolute high and low of a smoothed bar are not necessarily traded levels. The concept is to track trends through the noise of small retracements and allow for swing patterns to act as trailing stops. In the crude example from Thursday, shown in the second image below, when price moves above the black line, there is no longer any reason to be short.
The collapse in crude began with a sweeping reversal early in the afternoon. The peak volume points were at the top of the trend, as shown on the Market Profile chart (blue bar). When the day's range was engulfed in just one thirty-minute period, day traders were long and wrong, meaning a swift trend was possible. The key references from a support perspective are where the control point of most time is at 94.96 and the midpoint of the recent uptrend (50% retracement) is at 94.50. The small blue arrow indicates this midpoint.
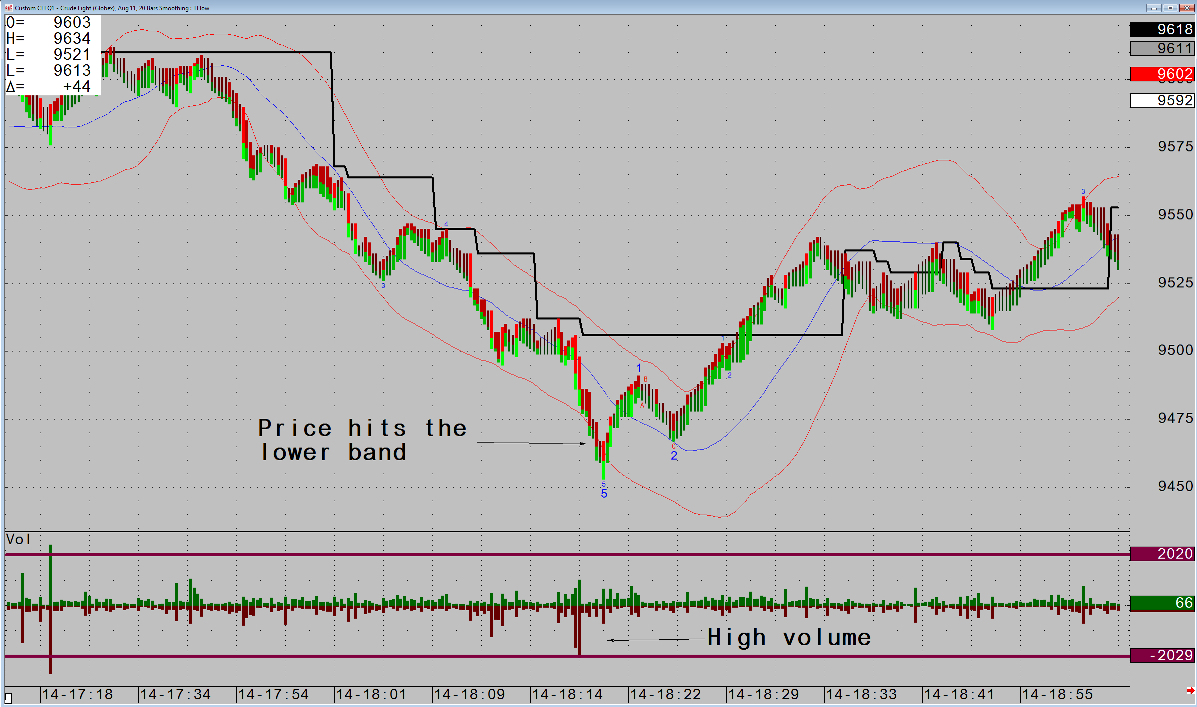
The TFlow chart below shows the second half of this fall with the volume, an Elliott Wave Count, and the eighty-period Moving Linear Regression line. I have also added a standard error band at 2.5. This has two uses: firstly, to qualify a breakout, and secondly, once a trend has developed, to mark an exhaustion point. This exhaustion point is when the trend is more than eighty bars in length and price touches the lower band. Analysis of prior data shows that extreme volume is at two thousand contracts. The chart shows how that extreme is reached. With the knowledge that the area of 9496 to 9450 is where the trend should end, the market touches the lower band. Just prior to that point, a fresh wave of exhaustion selling appears.
The next chart shows how the DOMTracker adds additional weight to the exhaustion theory. DOMTracker also has limits of range, and this is normally at two hundred. There is a huge bubble of bids at the support area that peaks above three hundred, and the two-period DOMTracker has an even bigger spike. Price bottoms at the lower band and the 50% retracement before, shortly after wave two, the Moving Linear Regression line shifts direction and confirms that the trend is over. Finally, once the swing pattern is breached, there is no longer any reason to get short.