Although most mathematical technical indicators focus on capitalizing on either trending behavior by using tools like moving averages (see Trend Following Kept Simple: The 200-Day Simple Moving Average) or on counter-trending action through oscillators such as RSI (see ICE May 2012 Cotton Futures Analysis), throughout my career I've focused on volatility indicators as a primary technical tool. When I tell people this, they often ask, "Which do you prefer, ADX or ATR?" My answer to this question has always been the same: "Yes."
Interestingly, both ADX (Average Directional Movement Index) and ATR (Average True Range) were developed by J. Welles Wilder. This begs the question, "Why did Wilder develop two volatility indicators?" I've always felt he needed both because each indicator helps answer different questions all traders need to determine market behavior. ADX offers an objective answer to whether we are currently in a high or low volatility environment irrespective of the asset analyzed, time frame selected, or where we are on the twenty-four-hour clock. By contrast, ATR defines what a statistically significant price move is for a particular asset on a specific time frame.
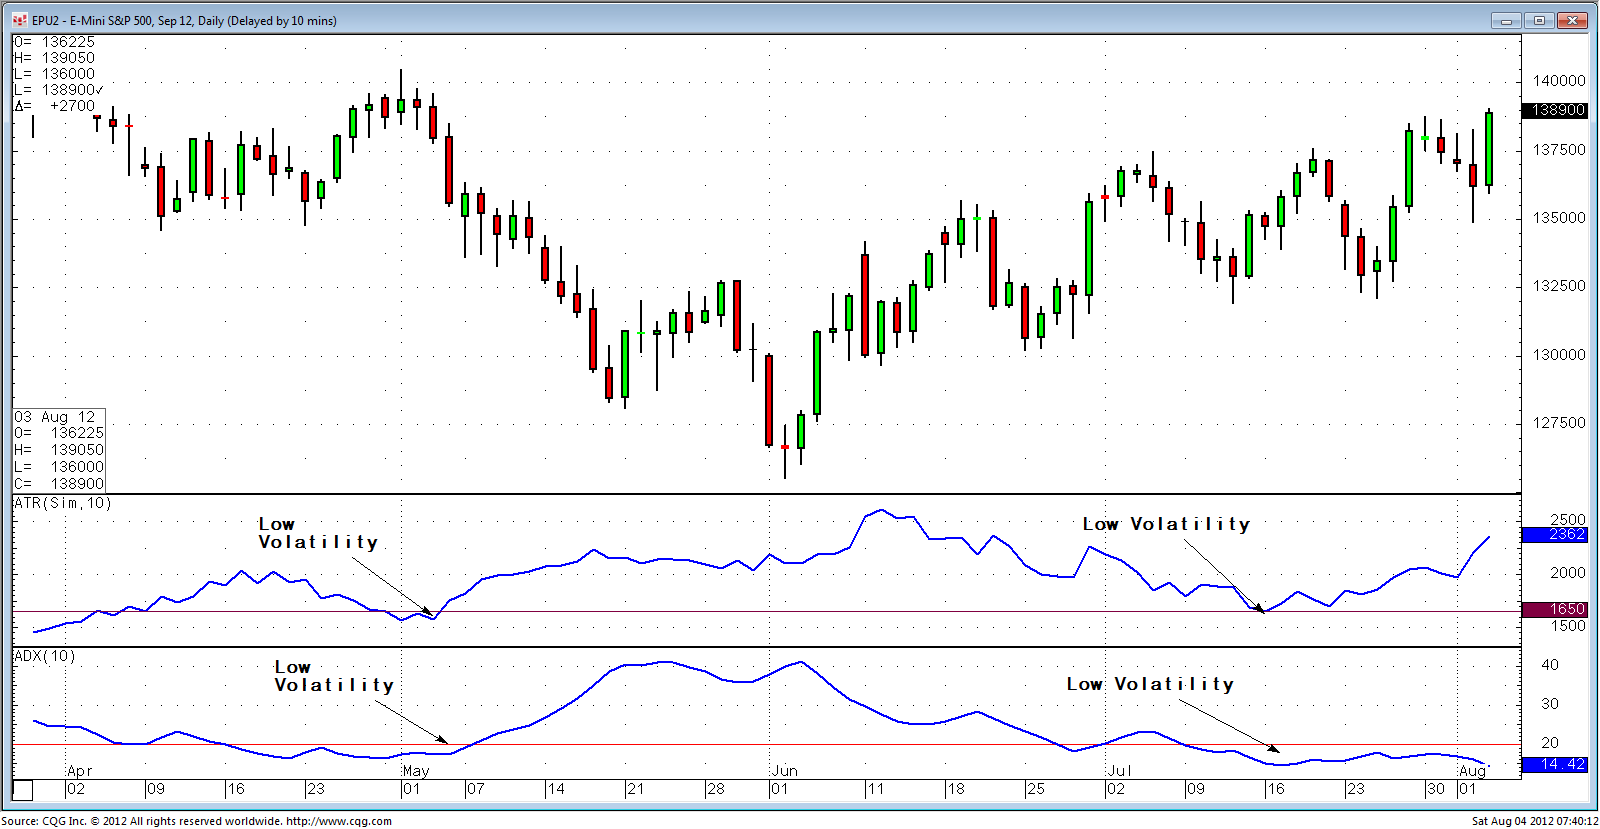
To illustrate the point, let's look at the CME Group September 2012 E-mini S&P 500 futures contract. Notice that based on the daily chart shown below, over the past four months, 16.50 points is considered low volatility as defined by Wilder's ten-period ATR.
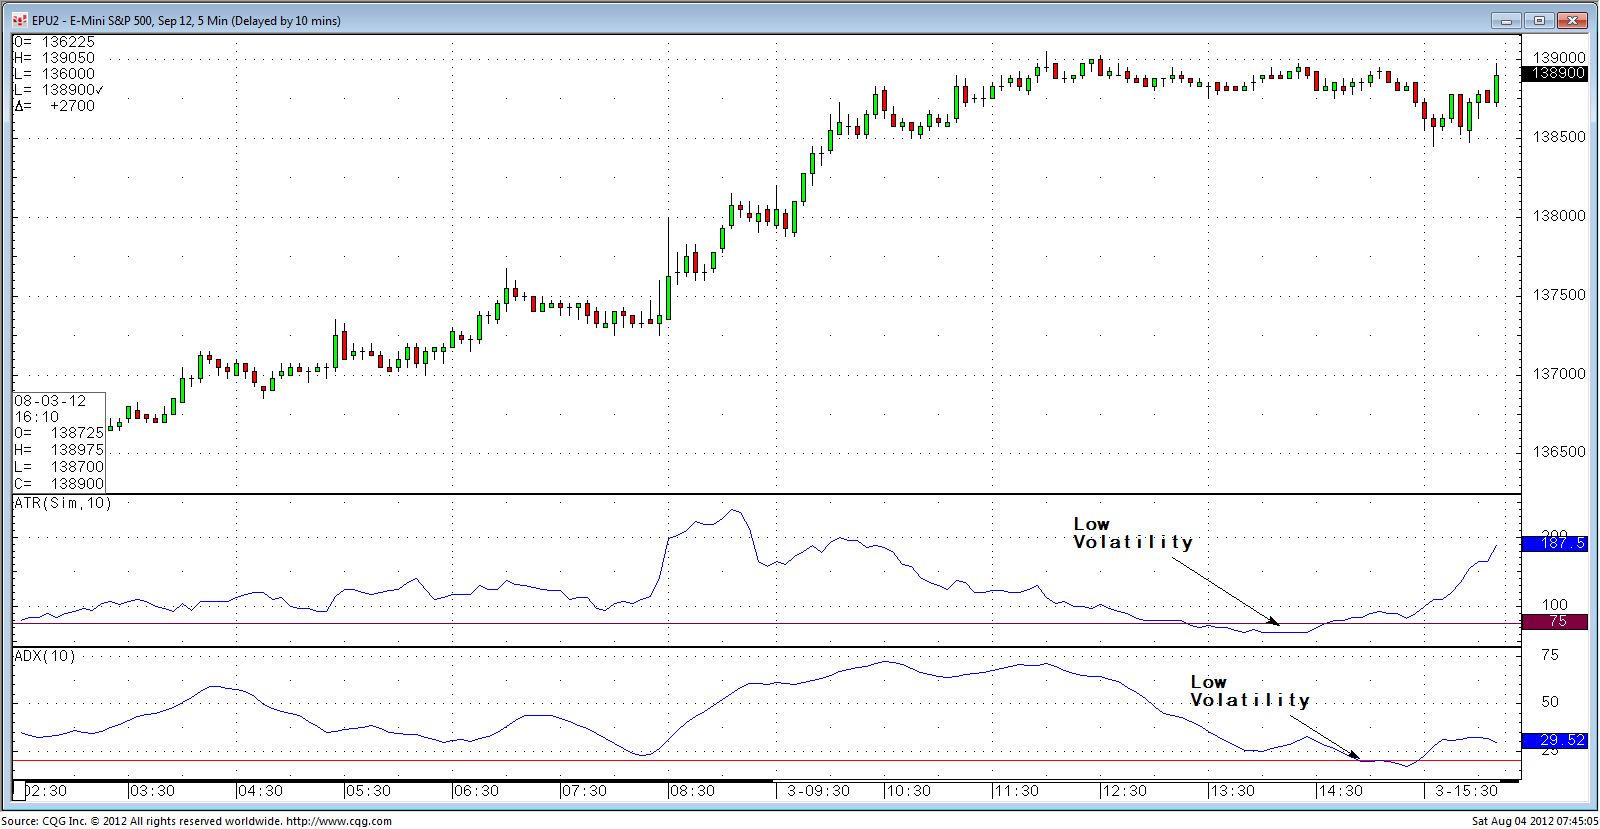
Now, let's compare the chart shown in Figure 1 with the same asset (CME Group September 2012 E-mini S&P 500 futures contract) where, instead of daily bars, the length of each bar is five minutes. Notice that despite the fact that we are still analyzing the same asset, low volatility is now 0.75 instead of 16.50 (see Figure 2).
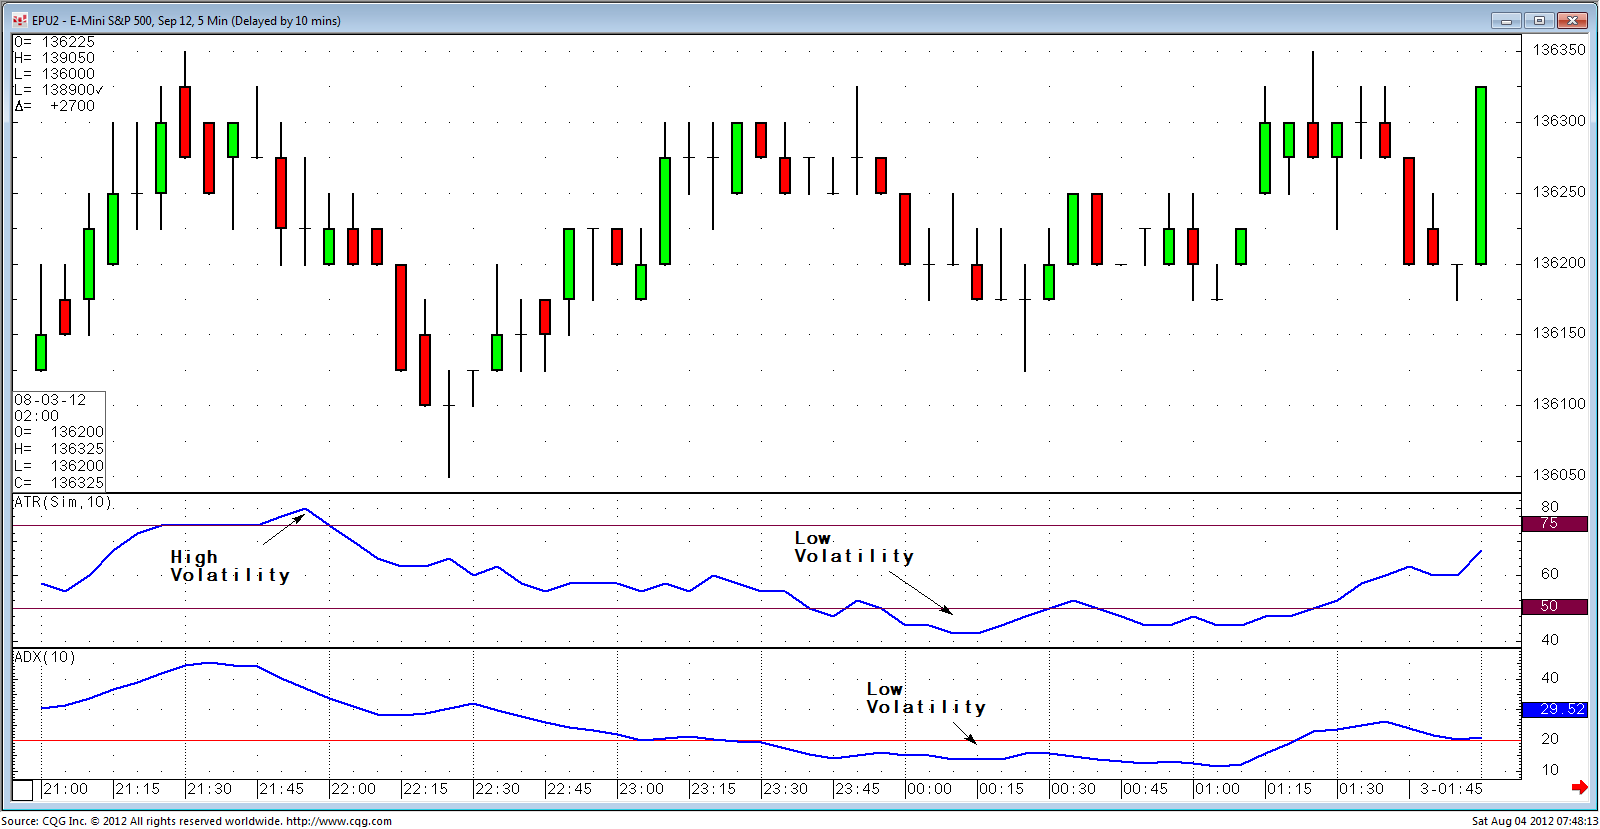
Next, let's compare the five-minute chart above, which was showing low volatility in the E-mini S&P 500 during primary trading hours, to a five-minute chart of the E-mini S&P 500 during its so-called "overnight" hours. Notice in the chart shown below that now 0.75 points has become high volatility and 0.50 would now be considered low volatility.
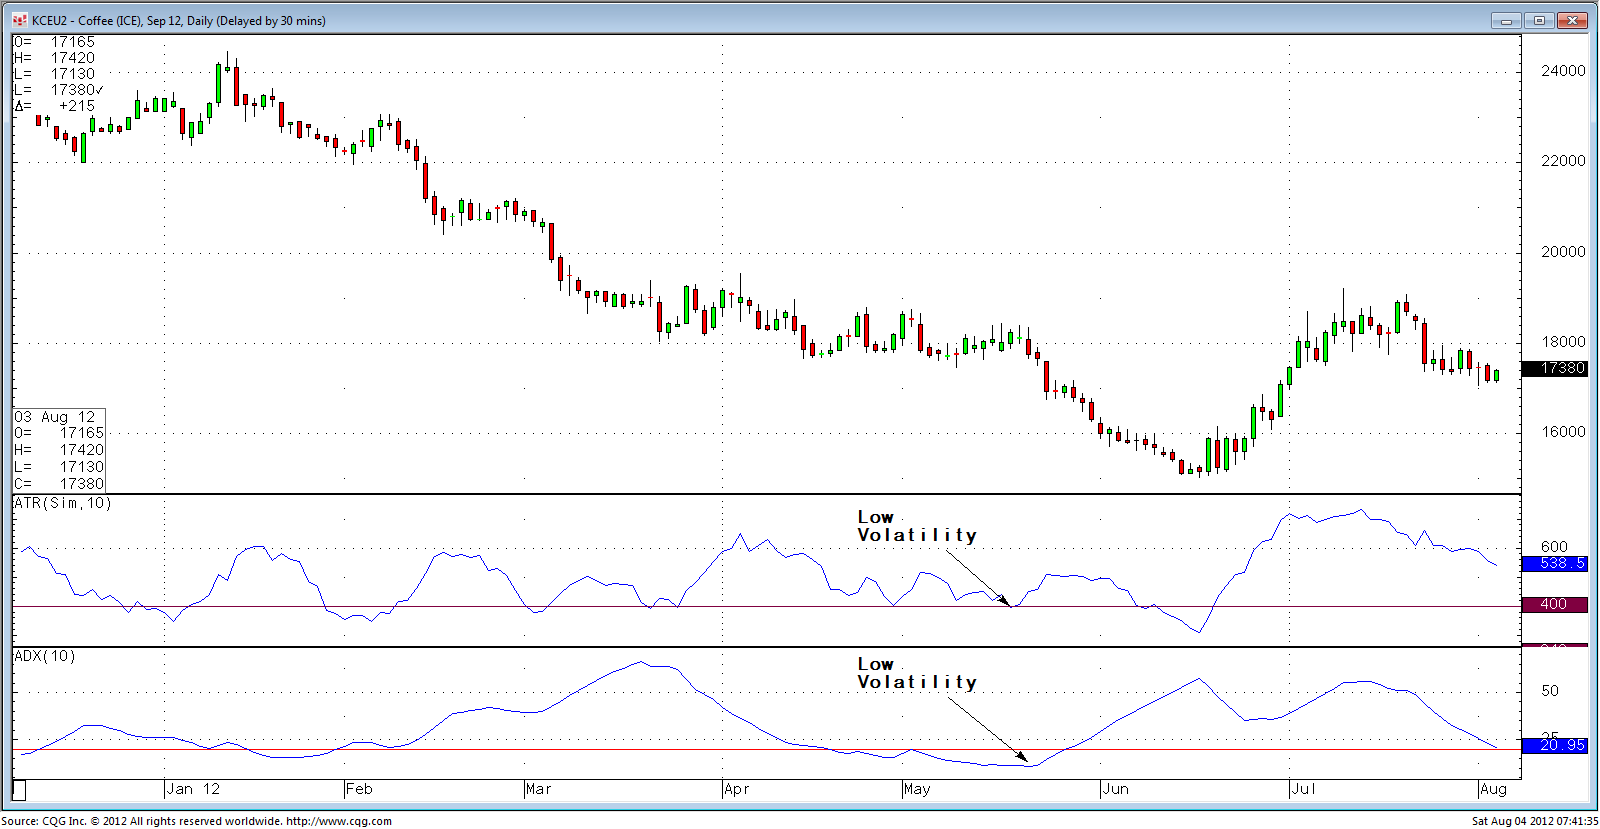
Finally, let's compare a daily chart of September 2012 ICE Coffee futures to our daily E-mini S&P 500 futures chart. Remember that on the daily S&P 500 chart, low volatility was 16.50 points or $825.00 per contract. By contrast, low volatility according to the ten-day ATR in Coffee futures is 400 points, or $0.04/lb., or $1,500.00 per contract (see Figure 4).
In summary, our definition or low or high volatility according to ATR will change according to the asset analyzed, the period of analysis chosen (e.g., weekly bars, daily bars, etc.), as well as where we are on the twenty-four-hour clock.
By contrast, Wilder's ADX solves all of these problems since it is bounded and can never give readings below zero or above one hundred. Consequently, readings below twenty are considered low volatility irrespective of asset, time frame, or where we are on the twenty-four-hour clock. This begs the question, "Why use ATR at all?" The answer is that although ADX offers an objective answer to what is "low" and "high" for volatility, it cannot tell us what is a statistically significant move for the asset analyzed in our desired trading time frame. This is why we still need ATR. ATR tells us what a statistically significant price move is for our asset given our preferred trading time frame, and this is extremely valuable for placement of initial stop loss levels as well as for determining where to take partial profits and when we should adjust trailing stops.
Below is a summary of the pros and cons of both volatility indicators.