It is always hard to buy a market at or close to its highs, but when it comes to crude oil these days, there are lots of signs that the rally that commenced in February 2016 at $26.05 per barrel may be heading even higher.
The price of the energy commodity dropped like a stone from highs of $107.73 in June 2014 reaching the February 2016 low. Increasing production, slowing economic conditions around the world, and growing inventories created a potent bearish cocktail for the energy commodity. Since then, production cuts by the international oil cartel OPEC and global economic growth have caused the price of crude oil to come storming back. The latest leg to the upside in the crude oil futures market began after a false break to the downside in June 2017.
A bull since June 2017
In June 2017, the price of nearby NYMEX crude oil futures briefly fell below technical support at $42.20 per barrel in what turned out to be a false breakdown.
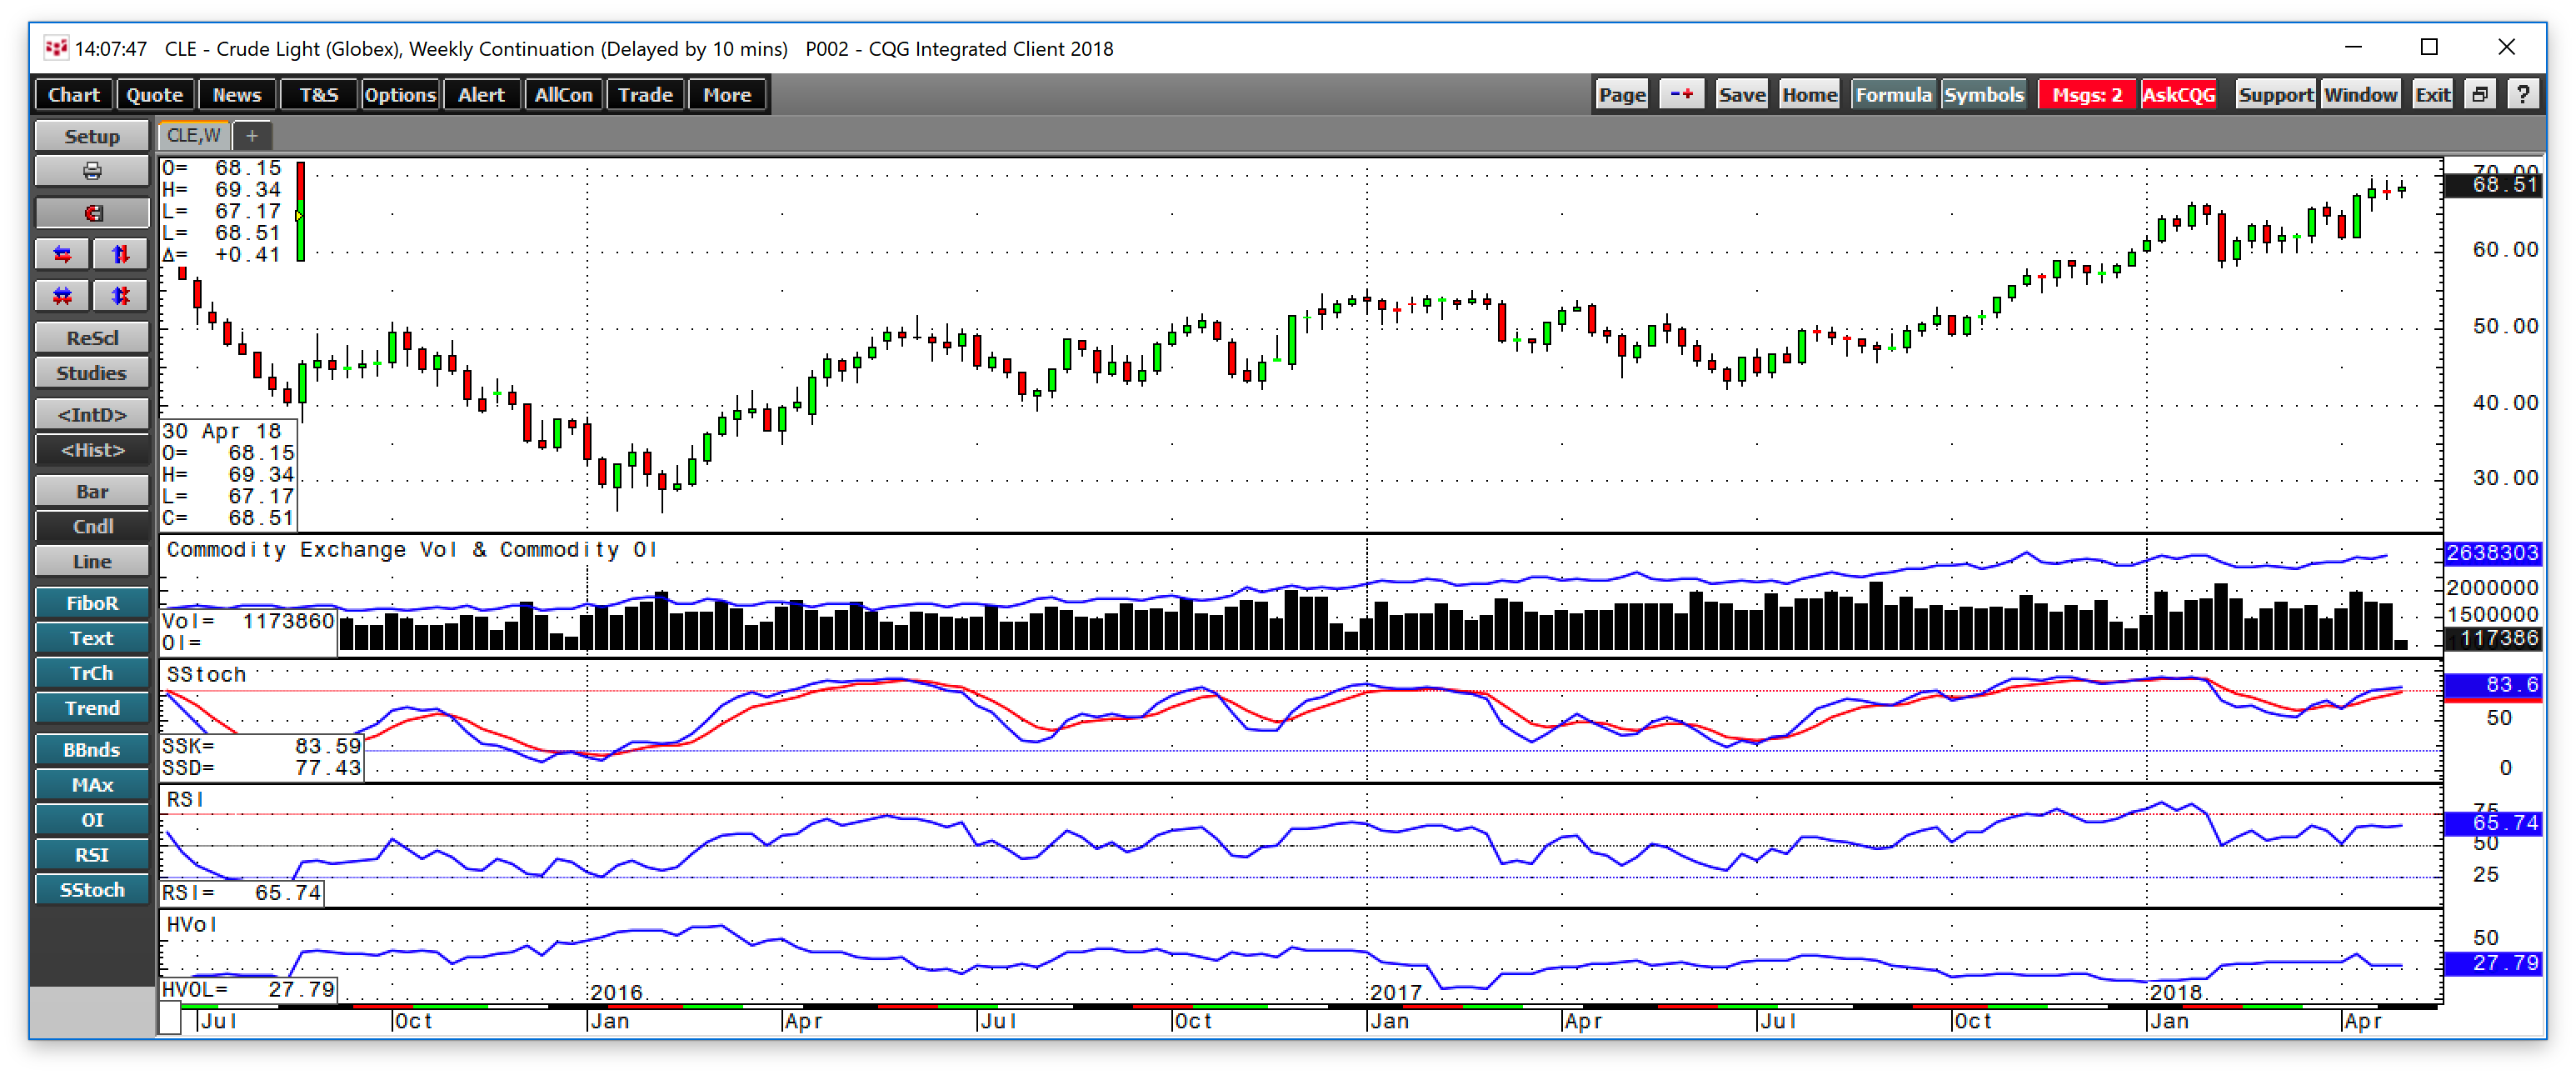
As the weekly chart shows, NYMEX crude oil futures found a bottom only 15 cents below the support level and began a rally that continued at the end of April. The price of WTI crude rose to its most recent high at $69.55 per barrel on the active month June futures contract on April 19. While price momentum on the weekly chart has risen to overbought territory, the trend continues to point higher. Relative strength at around 66 is rising but does not yet display an overbought condition. Open interest, the total number of open long and short positions in NYMEX future has increased from 2.132 million contracts at the time of the lows last June to its current level of around 2.638 million. From the low in June to its most recent high, the price of oil has appreciated by over 65 percent. Open interest moved 23.7 percent higher over the period. Rising price and open interest tend to validate a bullish price trend in a futures market. The technical picture for crude oil continues to support higher prices even though the energy is at the highest level since 2014.
Oil is close to recent highs
June NYMEX crude oil futures settled on the final day of trading in April at the $68.57 per barrel level just $0.98 below the highest price for the energy commodity since it was on its way down from over $100 in 2014.
The international oil market is like a jigsaw puzzle with many pieces that combine to reveal the path of least resistance for the price of the energy commodity. While technical factors can tell us a lot about the herd mentality of buyers and sellers in the market, the market structure for the oil market can reveal valuable clues about the fundamental supply and demand picture. When it comes to analyzing market structure, I like to look at term structure, or the forward curve, quality, and location spreads, and processing spreads for the qualitative data that creates a picture when it comes to price direction.
Market structure continues to point higher
The current state of the forward curve in both WTI and Brent crude oil futures markets displays the market’s perception of tight supply conditions.
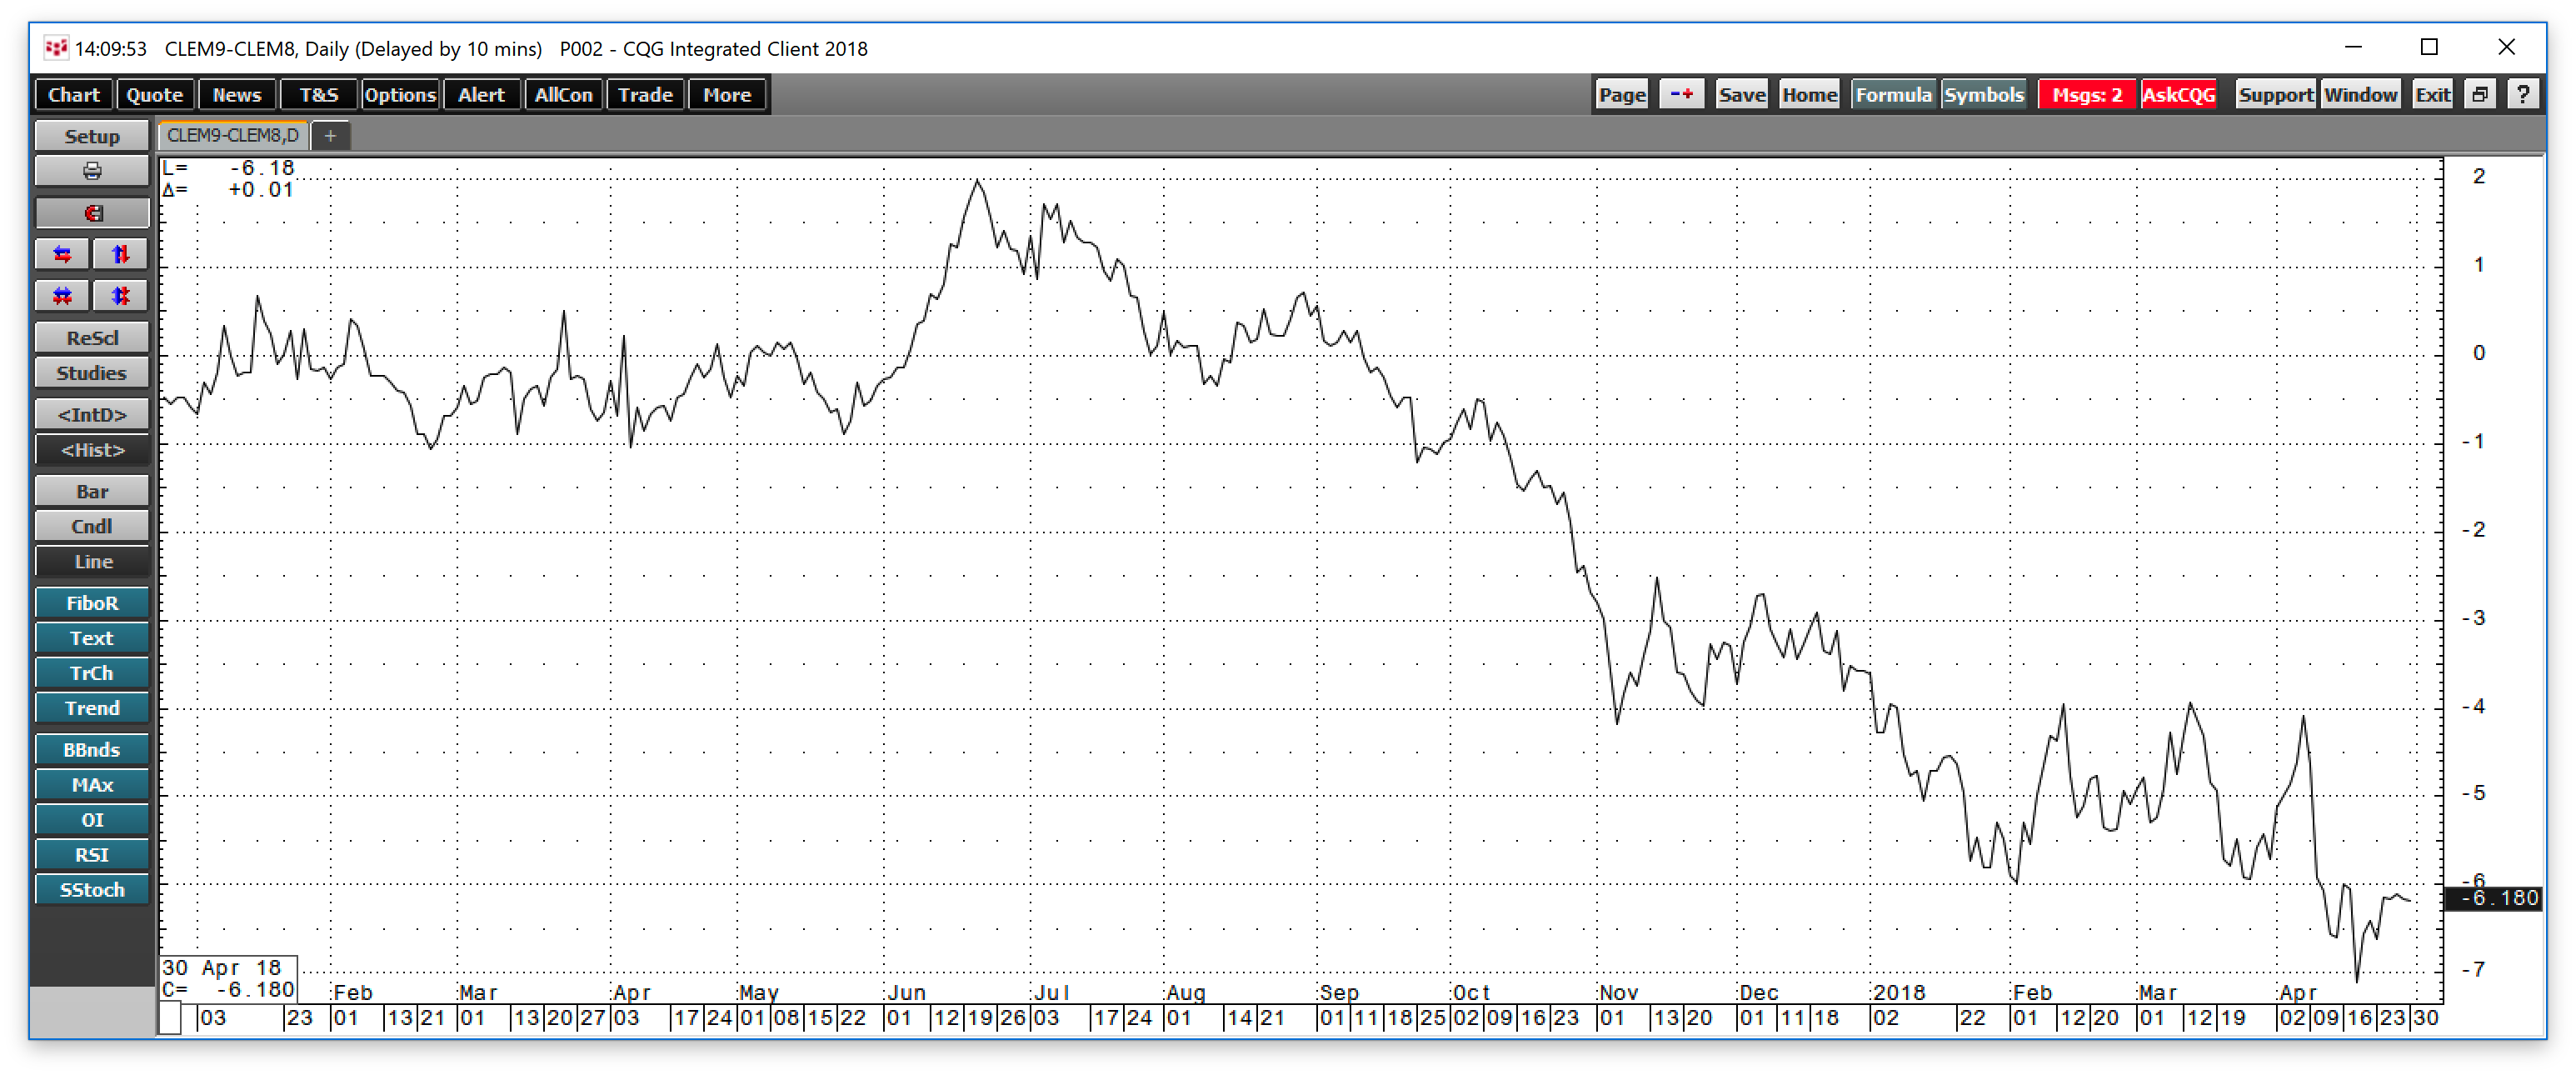
The chart of June 2019 minus June 2018 NYMEX crude oil futures price shows that the one-year spread was trading at over a $6 backwardation at the end of April. The one-year Brent spread was trading at around the same level. Backwardation is a condition where deferred prices are lower than nearby prices and tends to signal the market’s concerns about the nearby availability of a commodity. I interpret the current level of the spreads as bullish for the price of crude oil.
The Brent-WTI spread in crude oil is a combination of a quality and a location spread in the energy commodity. Since the Arab Spring in 2010, the spread between the two benchmark crude oils has a barometer of political risk for the Middle East. When the Brent premium moves higher, it has been a bullish sign for the price of crude oil.

As the chart of the price of WTI minus Brent illustrates, the Brent premium has increased from $2.99 on March 2 to around $6.45 per barrel at the end of April. The increase in the premium is the result of rising tensions in the Middle East between Iran and Saudi Arabia. Additionally, increasing shale output from the U.S. and OPEC production cuts have caused Brent’s premium to WTI to move higher over the past two months. However, the overall signal from the Brent price which traded at over $75 per barrel recently is bullish for the overall price of crude oil these days.
Processing spreads are bullish
Processing or crack spreads in crude oil represent the economics of refining a barrel of the raw energy commodity into products like gasoline and distillates. Most consumers do not purchase raw crude oil, they use gasoline to power cars, jet fuel takes them to destinations around the world, and diesel fuel makes products available at local markets. Therefore, consumer demand for petroleum tends to show up in gasoline and distillate prices. The level of crack spreads can tell us a great deal about the overall demand for crude oil in the world. After all, the oil is the primary input in the production of oil products.
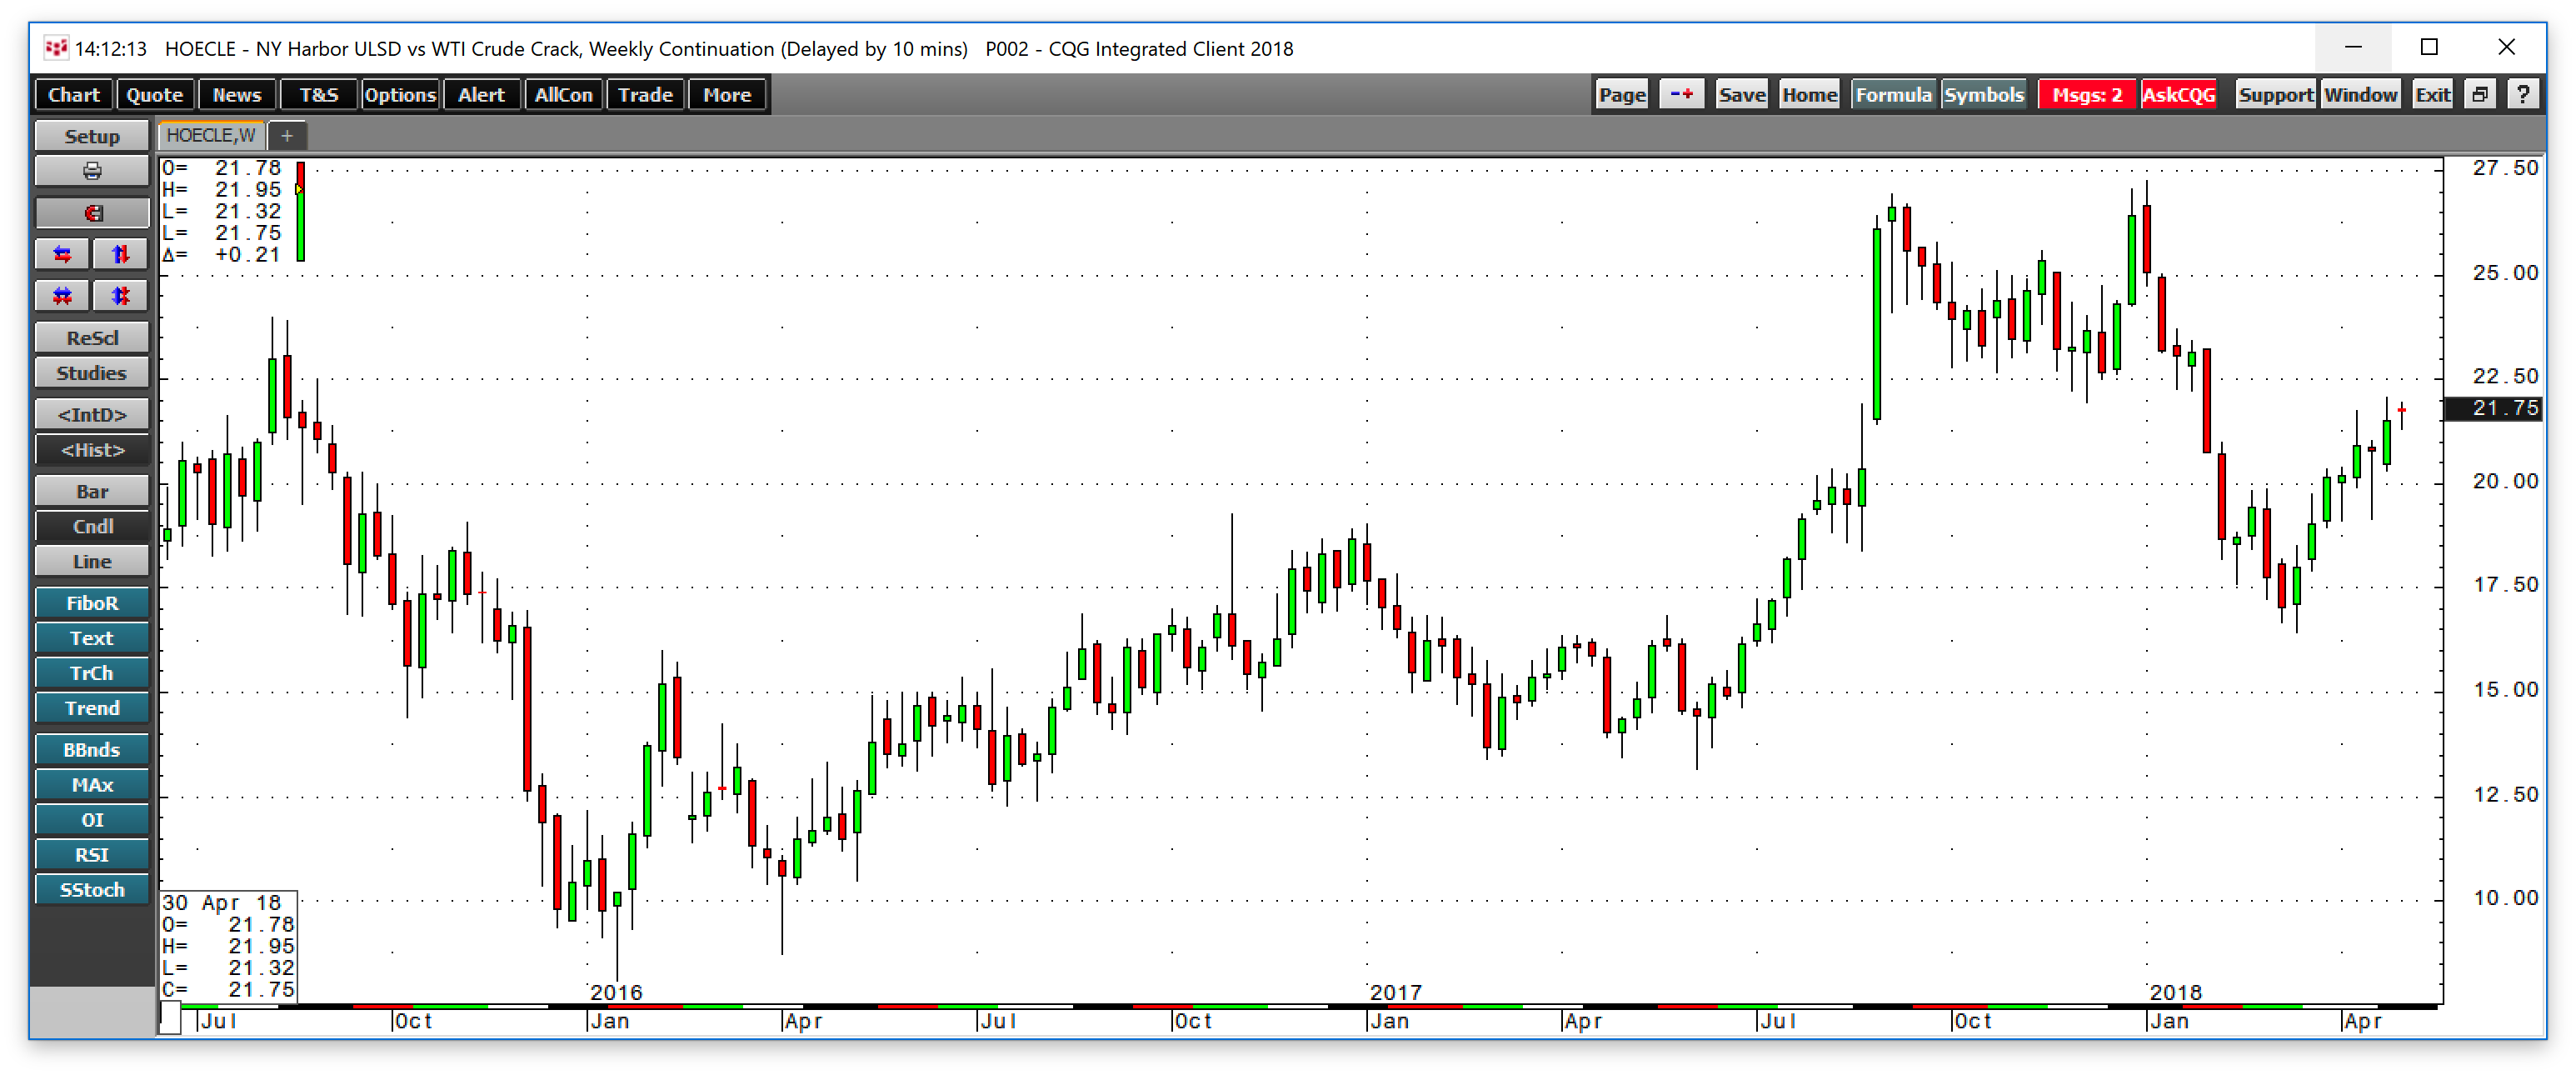
As the weekly chart of the gasoline crack spread shows, at $20.90 per barrel, demand is strong for gasoline as we head into the 2018 driving season. Last year at the end of April, the crack spread was below $20 per barrel. Crude oil is over $18 per barrel higher this year than last which makes the current level of the processing spread for gasoline even more bullish when it comes to the current level of demand for the oil product. Heating oil futures are a proxy for many other distillate fuels, and at $21.75 per barrel, the heating oil crack spread is appreciably higher than it was last year at this time. At the end of April 2017, the distillate crack traded at a high of $16 per barrel which is a sign of much stronger demand these days even though the price of crude oil is significantly higher.
The bottom line is that processing spreads, quality/location spreads, and term structure are all supportive of additional gains in the price of crude oil even though the energy commodity is close to its recent high.
The early 2018 breakout means there is lots of room before the next technical resistance level
In January 2018, crude oil rose above its last level of technical resistance at $62.58 per barrel.
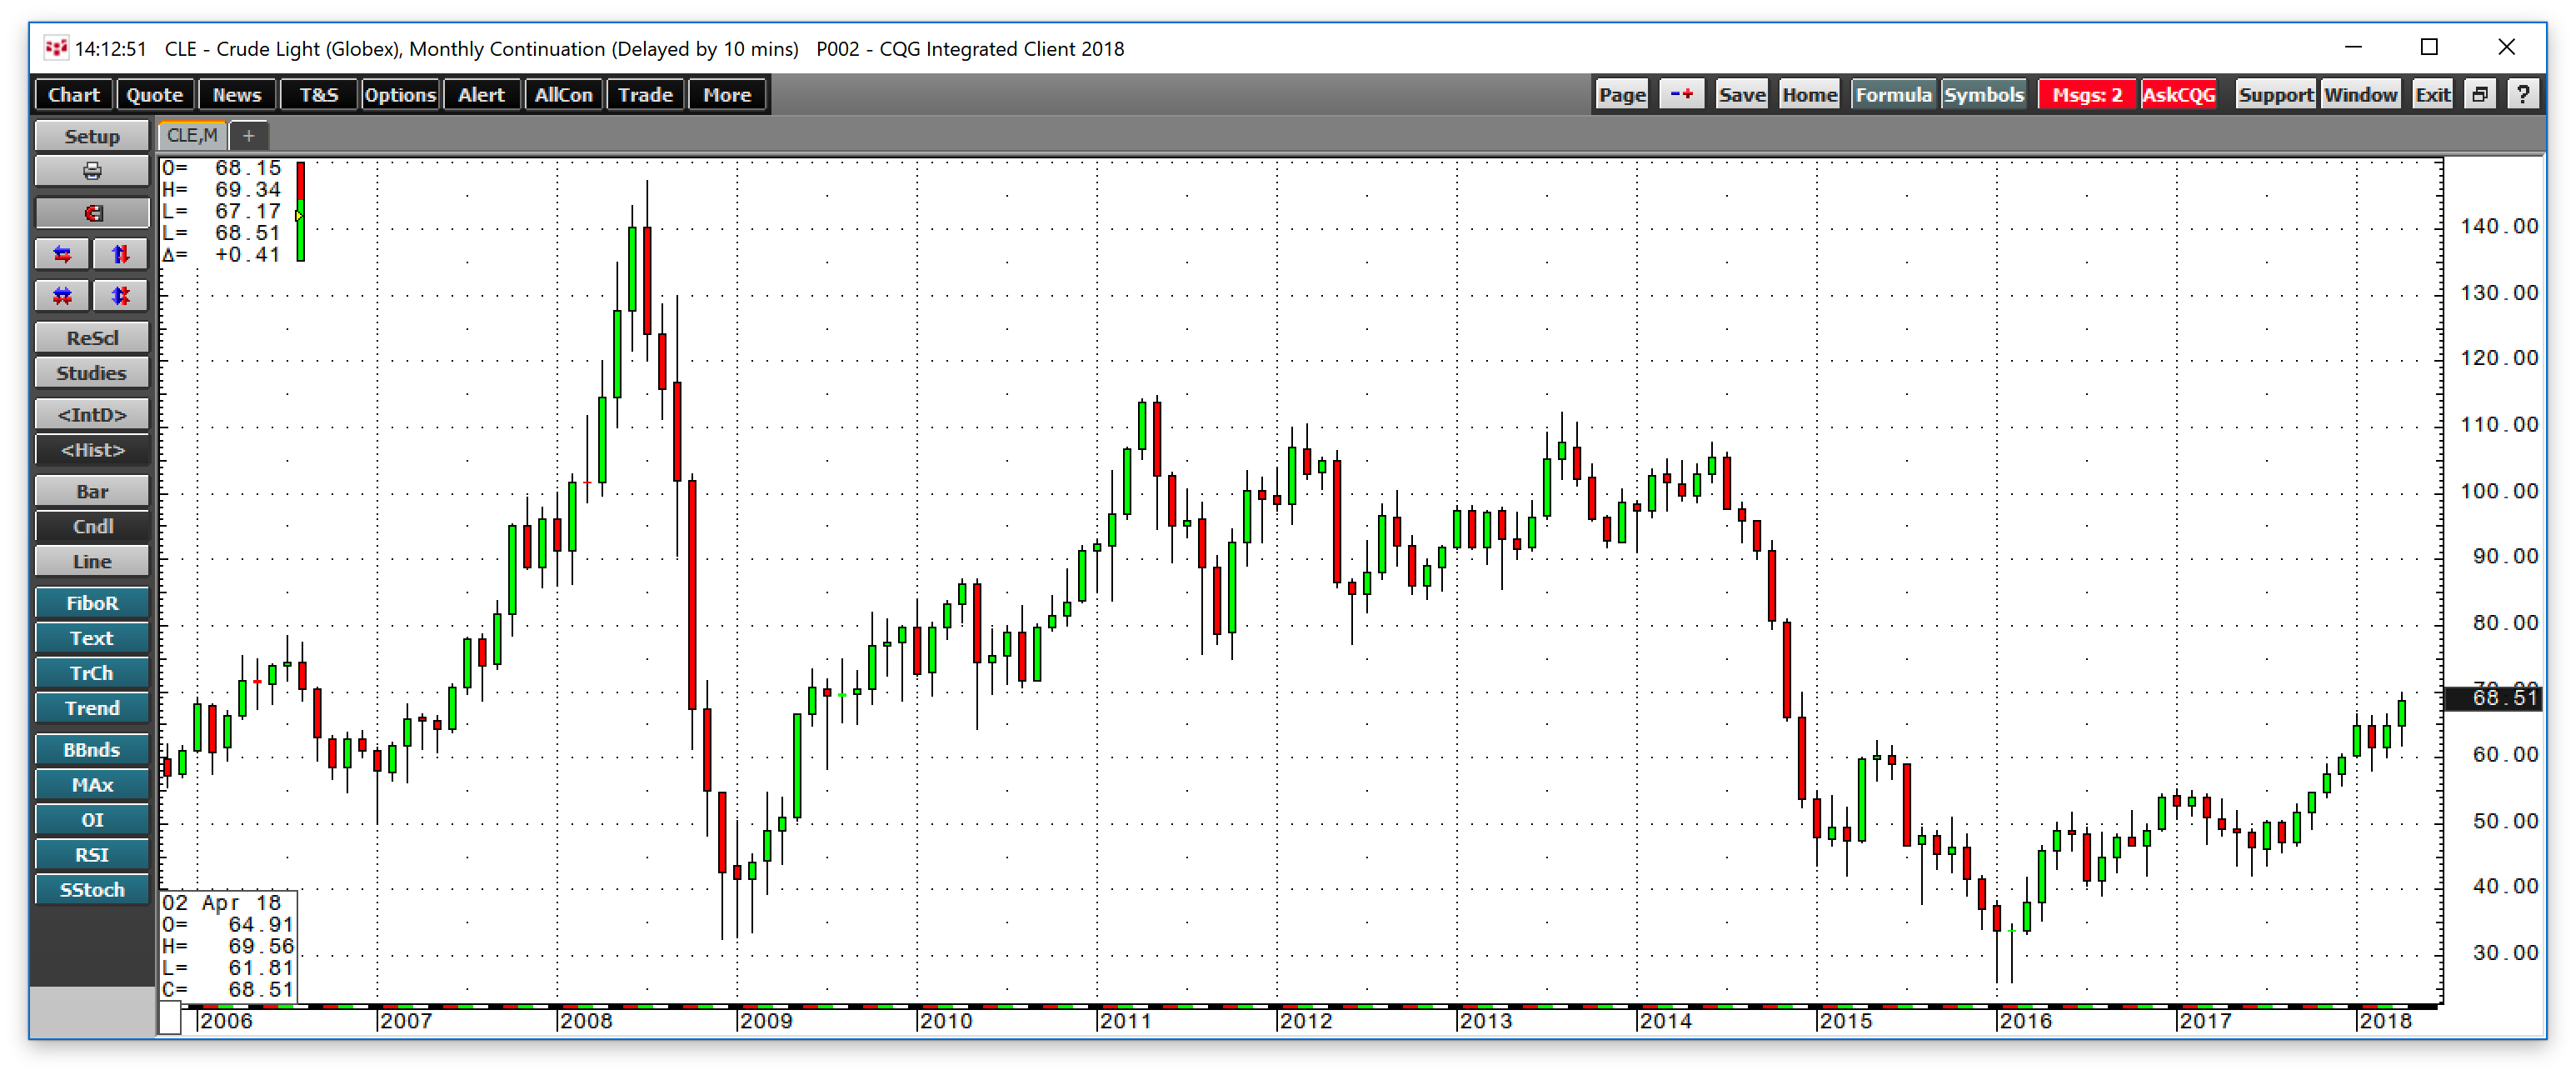
As the monthly chart shows, the WTI crude oil futures rose above the final technical resistance level earlier this year, and the next level on the upside stands at the June 2014 peak at $107.73 per barrel. There is lots of blue sky above in the crude oil market, and room for additional price gains these days, and the fundamentals have lined up to support higher prices. It may not be long before we see the price of the energy commodity above the $70 per barrel level on nearby NYMEX futures. Additionally, the current state of the Middle East continues to make the potential for upside price spikes and a widening of the backwardation more than a remote possibility. Any hostilities that impact production, refining, or logistical routes in the region of the world that is home to more than half the world’s reserves of crude oil could prove explosive for nearby prices.
Crude oil is close to its recent highs, but all signs are telling us that the rally is not near a significant top and more gains could be on the horizon.