Crude oil is the most watched commodity that trades on futures exchanges. The Brent crude oil futures contract, a pricing benchmark for two-thirds of the world’s petroleum trades on the Intercontinental Exchange. West Texas Intermediate crude oil, the other leading benchmark in the energy commodity trades on the New York Mercantile division of the Chicago Mercantile Exchange.
Crude oil powers the world. While environmental issues have caused an increase in the demand for alternative and renewable energy sources, crude oil remains the dominant energy raw material. With more than half the world’s reserves in the Middle East, political turbulence increases the price volatility of the energy commodity. While supply and demand fundamentals typically dictate the path of least resistance for the price of crude oil, the geopolitical landscape can, at times, significant price variance.
Crude oil has been in a bullish pattern since February 2016
The price of NYMEX crude oil hit lows in February 2016 around the time when most commodities found significant bottoms. Since then, the price of the energy commodity has been moving higher.
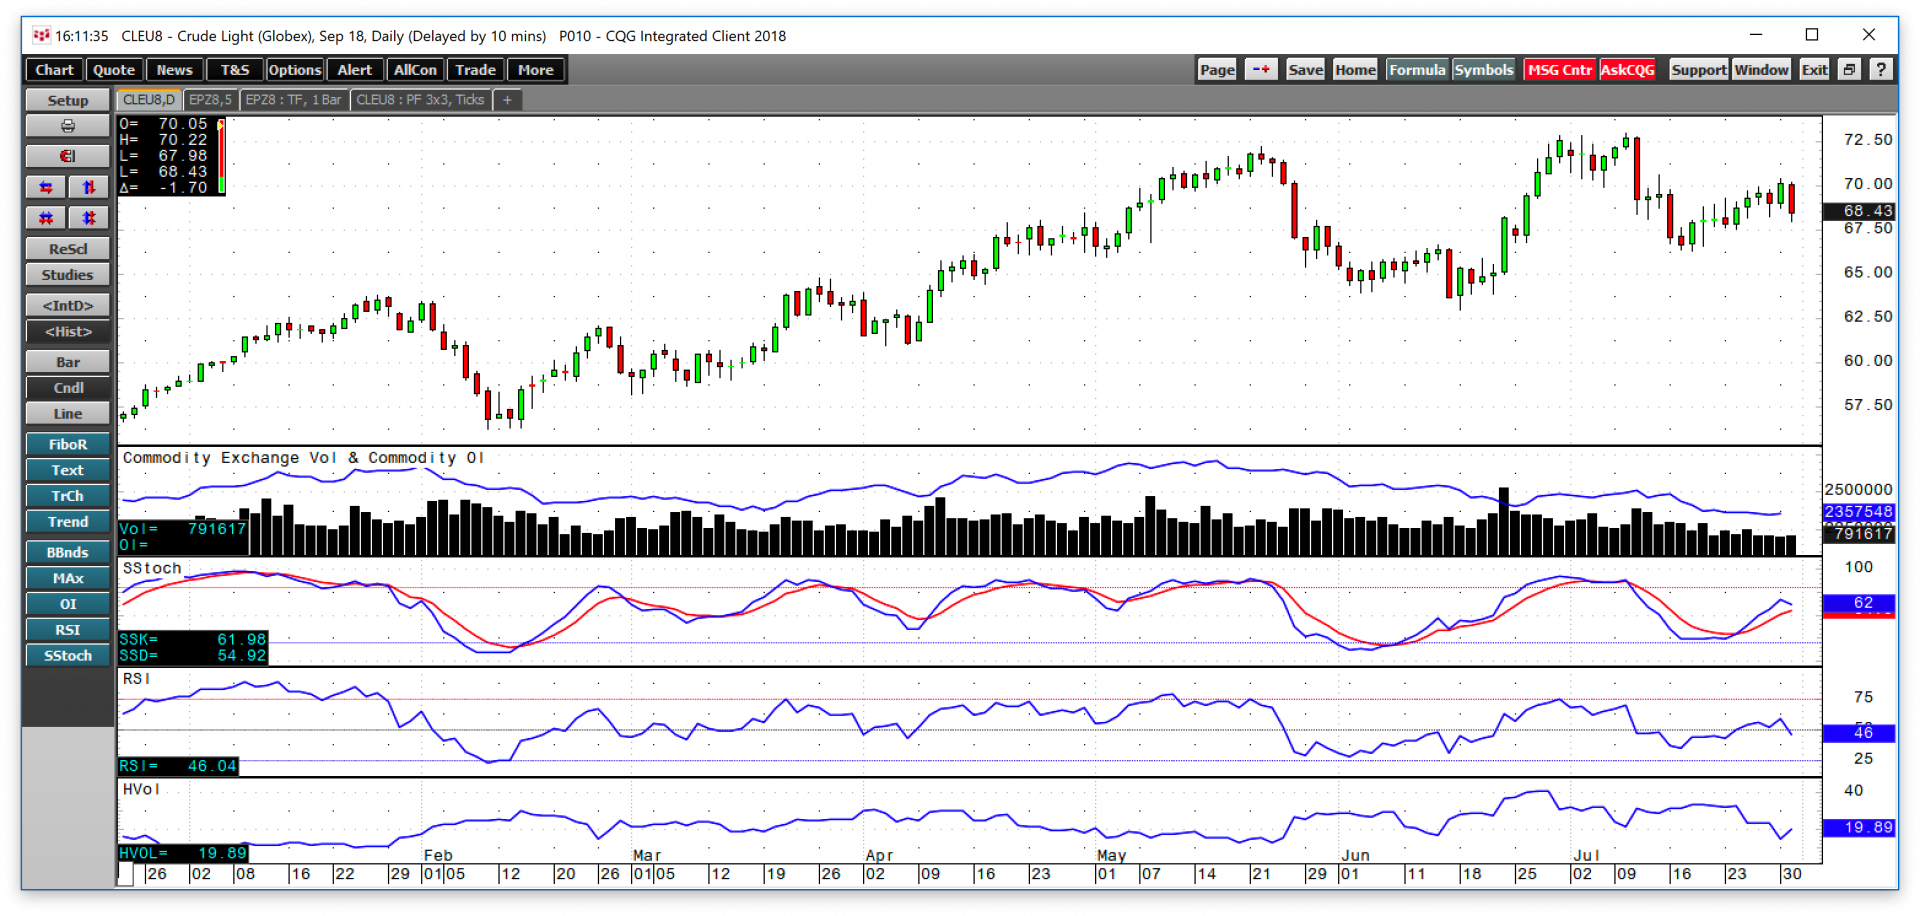
As the daily chart of the active month September NYMEX crude oil futures contract highlights, the price reached its most recent peak at $72.98 per barrel on July 10. The continuous contract high was at $75.29 during the first week of July. September crude oil recently corrected to lows of $66.29 on July 18 and has recovered since that low. Technical metrics on a short-term basis remain bullish for the price of oil. Open interest, the total number of long and short positions in the NYMEX futures market fell from 2.531 million contracts on July 11 to lows of 2.358 million on July 30 when the price was around the $70 level. Decreasing open interest and declining price is typically not a validation of an emerging bearish trend in a futures market. Price momentum which had dropped from overbought territory on July 10, crossed back to the upside in a sign that the path of least resistance for the price could be higher.
Three significant factors favor a continuation of higher highs in the crude oil market over the coming weeks and months.
Reason One - Technical Support and Resistance Levels
The longer-term technical picture for crude oil remains bullish from a risk-reward perspective.
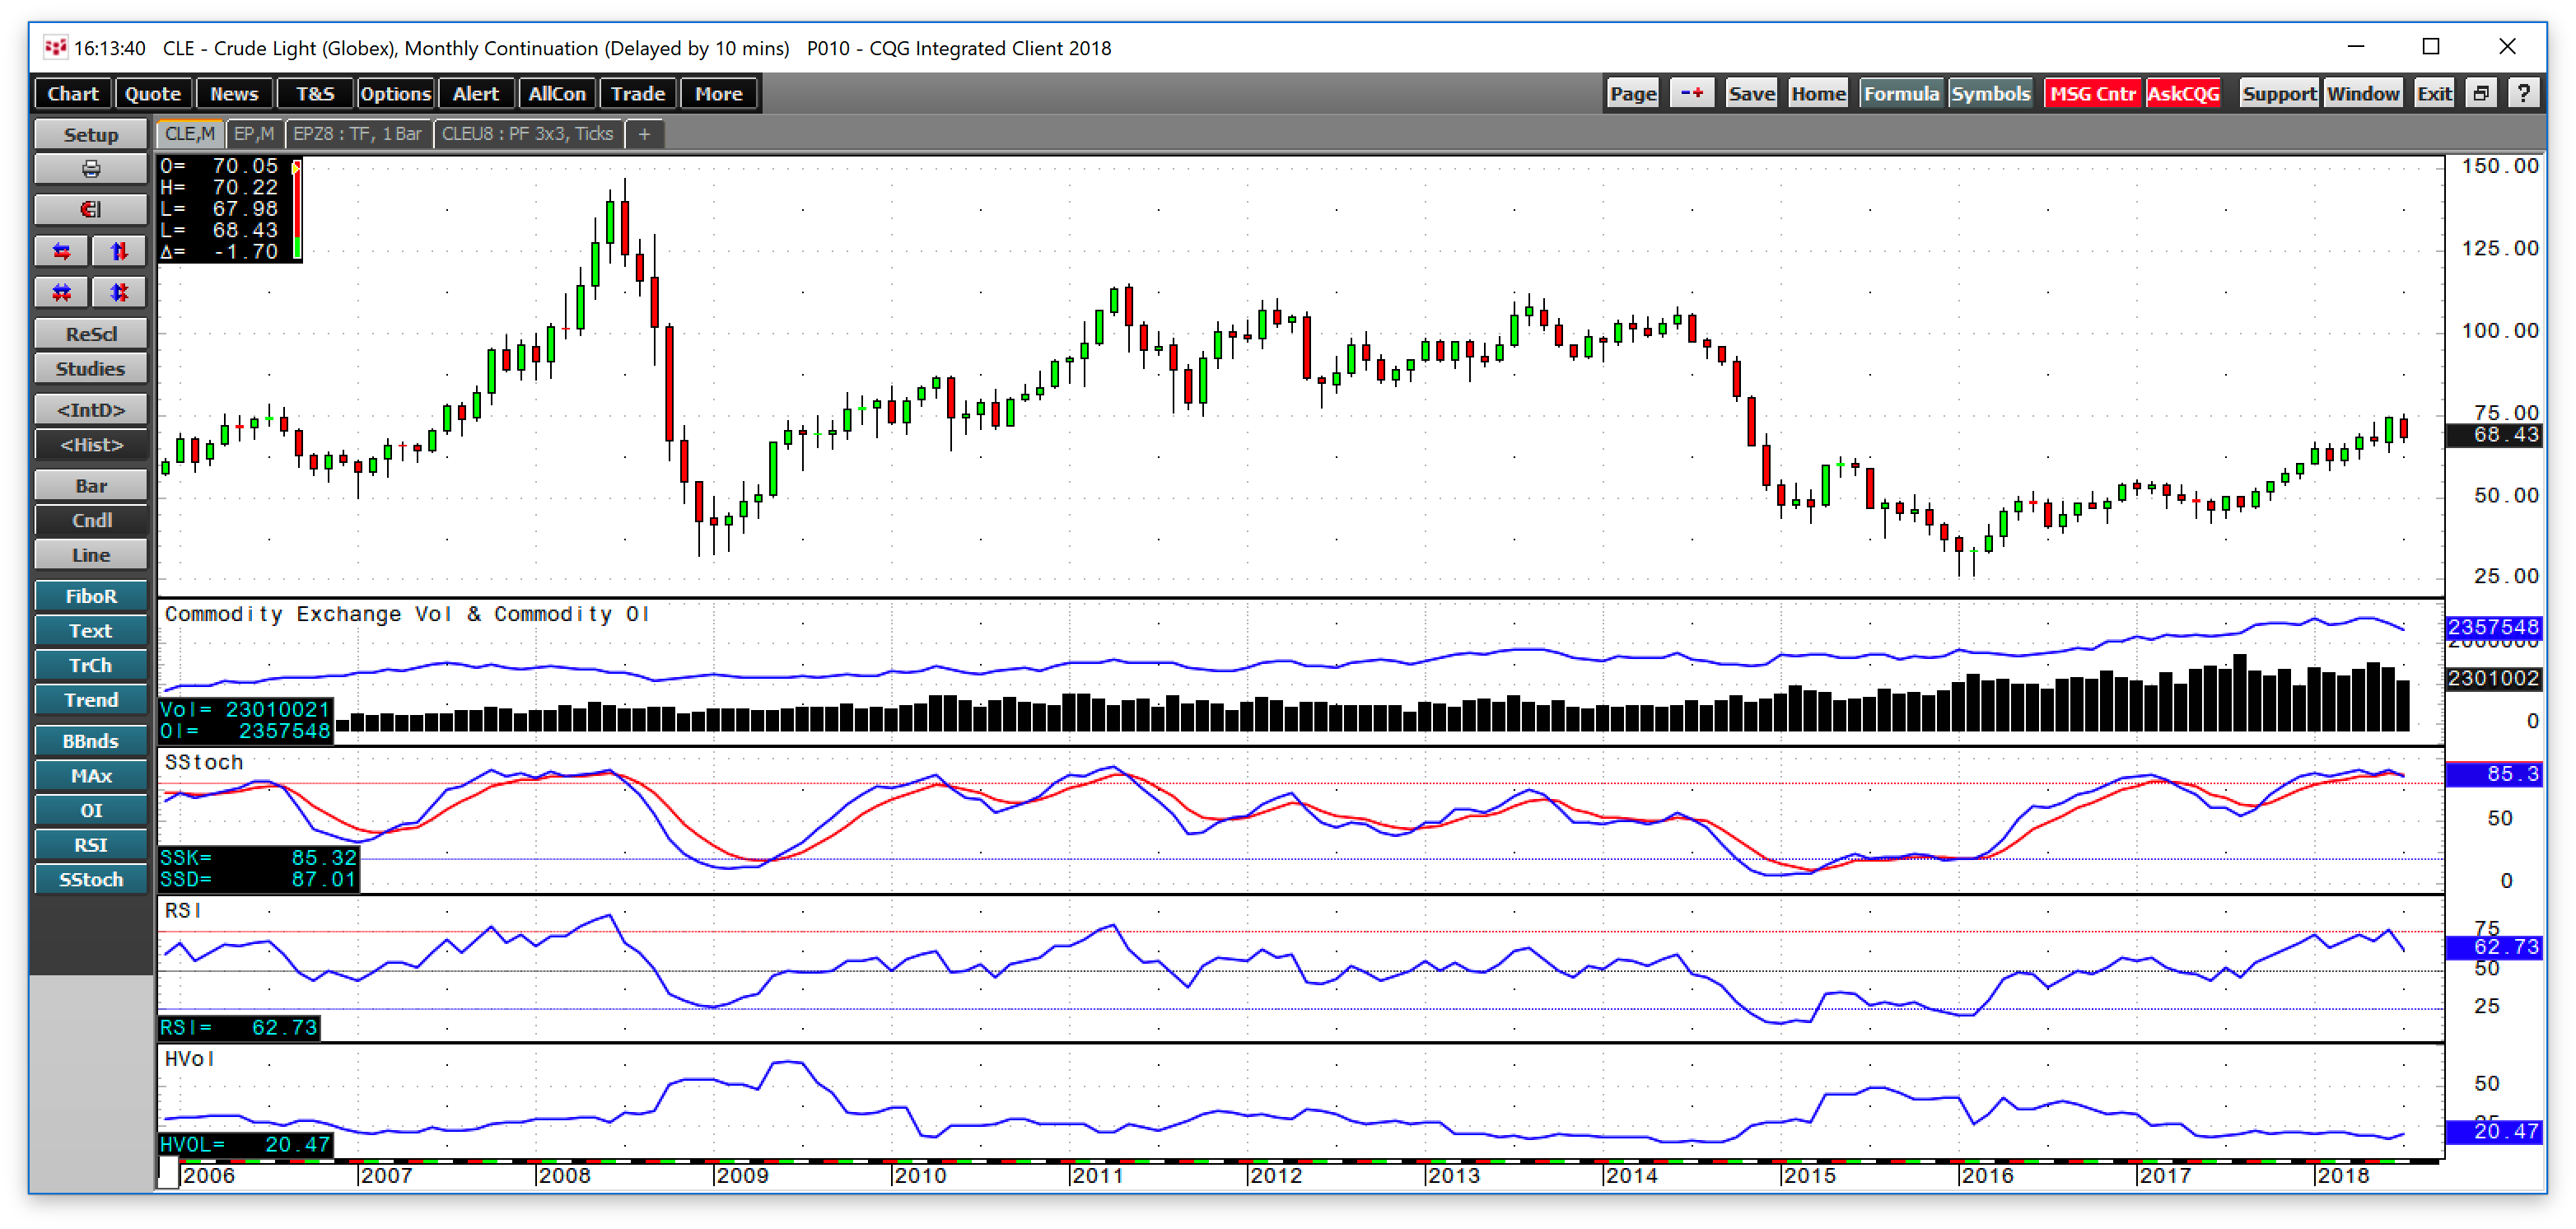
As the monthly chart illustrates, crude oil broke to the upside in January 2018 when the price rose above the critical technical resistance level at $62.58 per barrel which was the May 2015 peak. The next level of technical resistance stands at the June 2014 high at $107.73 per barrel. Therefore, with the price settling at $68.46 per barrel level on the final trading day of July, support is $5.88 below the market with resistance at $39.27 above the market. The risk-reward ratio at the current level stands at better than 1:6.6. While price momentum is in overbought territory in the monthly pictorial, open interest has been rising with the price of oil which is a technical validation of the long-term bullish price pattern. Historical volatility at around the 20.5% level remains on the lower side of its historical norm as the upward momentum of the oil market has been slow and steady. The technical picture of crude oil remains bullish as we head into August.
Reason Two - Economic Growth Increases Energy Demand
On Friday, July 27 we learned that GDP in the United States grew at 4.1 percent for the second quarter of 2018, the highest increase in GDP since 2014. As economic conditions continue to improve, demand for energy has expanded.
As of the week ending July 20, the American Petroleum Institute reported that inventories declined by 3.16 million barrels and the Energy Information Administration told markets they dropped by 6.1 million barrels. Both agencies reported a decline in both gasoline and distillate products for the period. However, on the final day of July the API reported an increase of 5.59 million barrels for the week ending on July 28, which caused some weakness at the end of the month.
Crack spreads are the refining margins that reflect the economics of processing a barrel of crude oil into gasoline and distillate products. The processing spreads in crude that measure demand for crude oil gained over recent sessions.
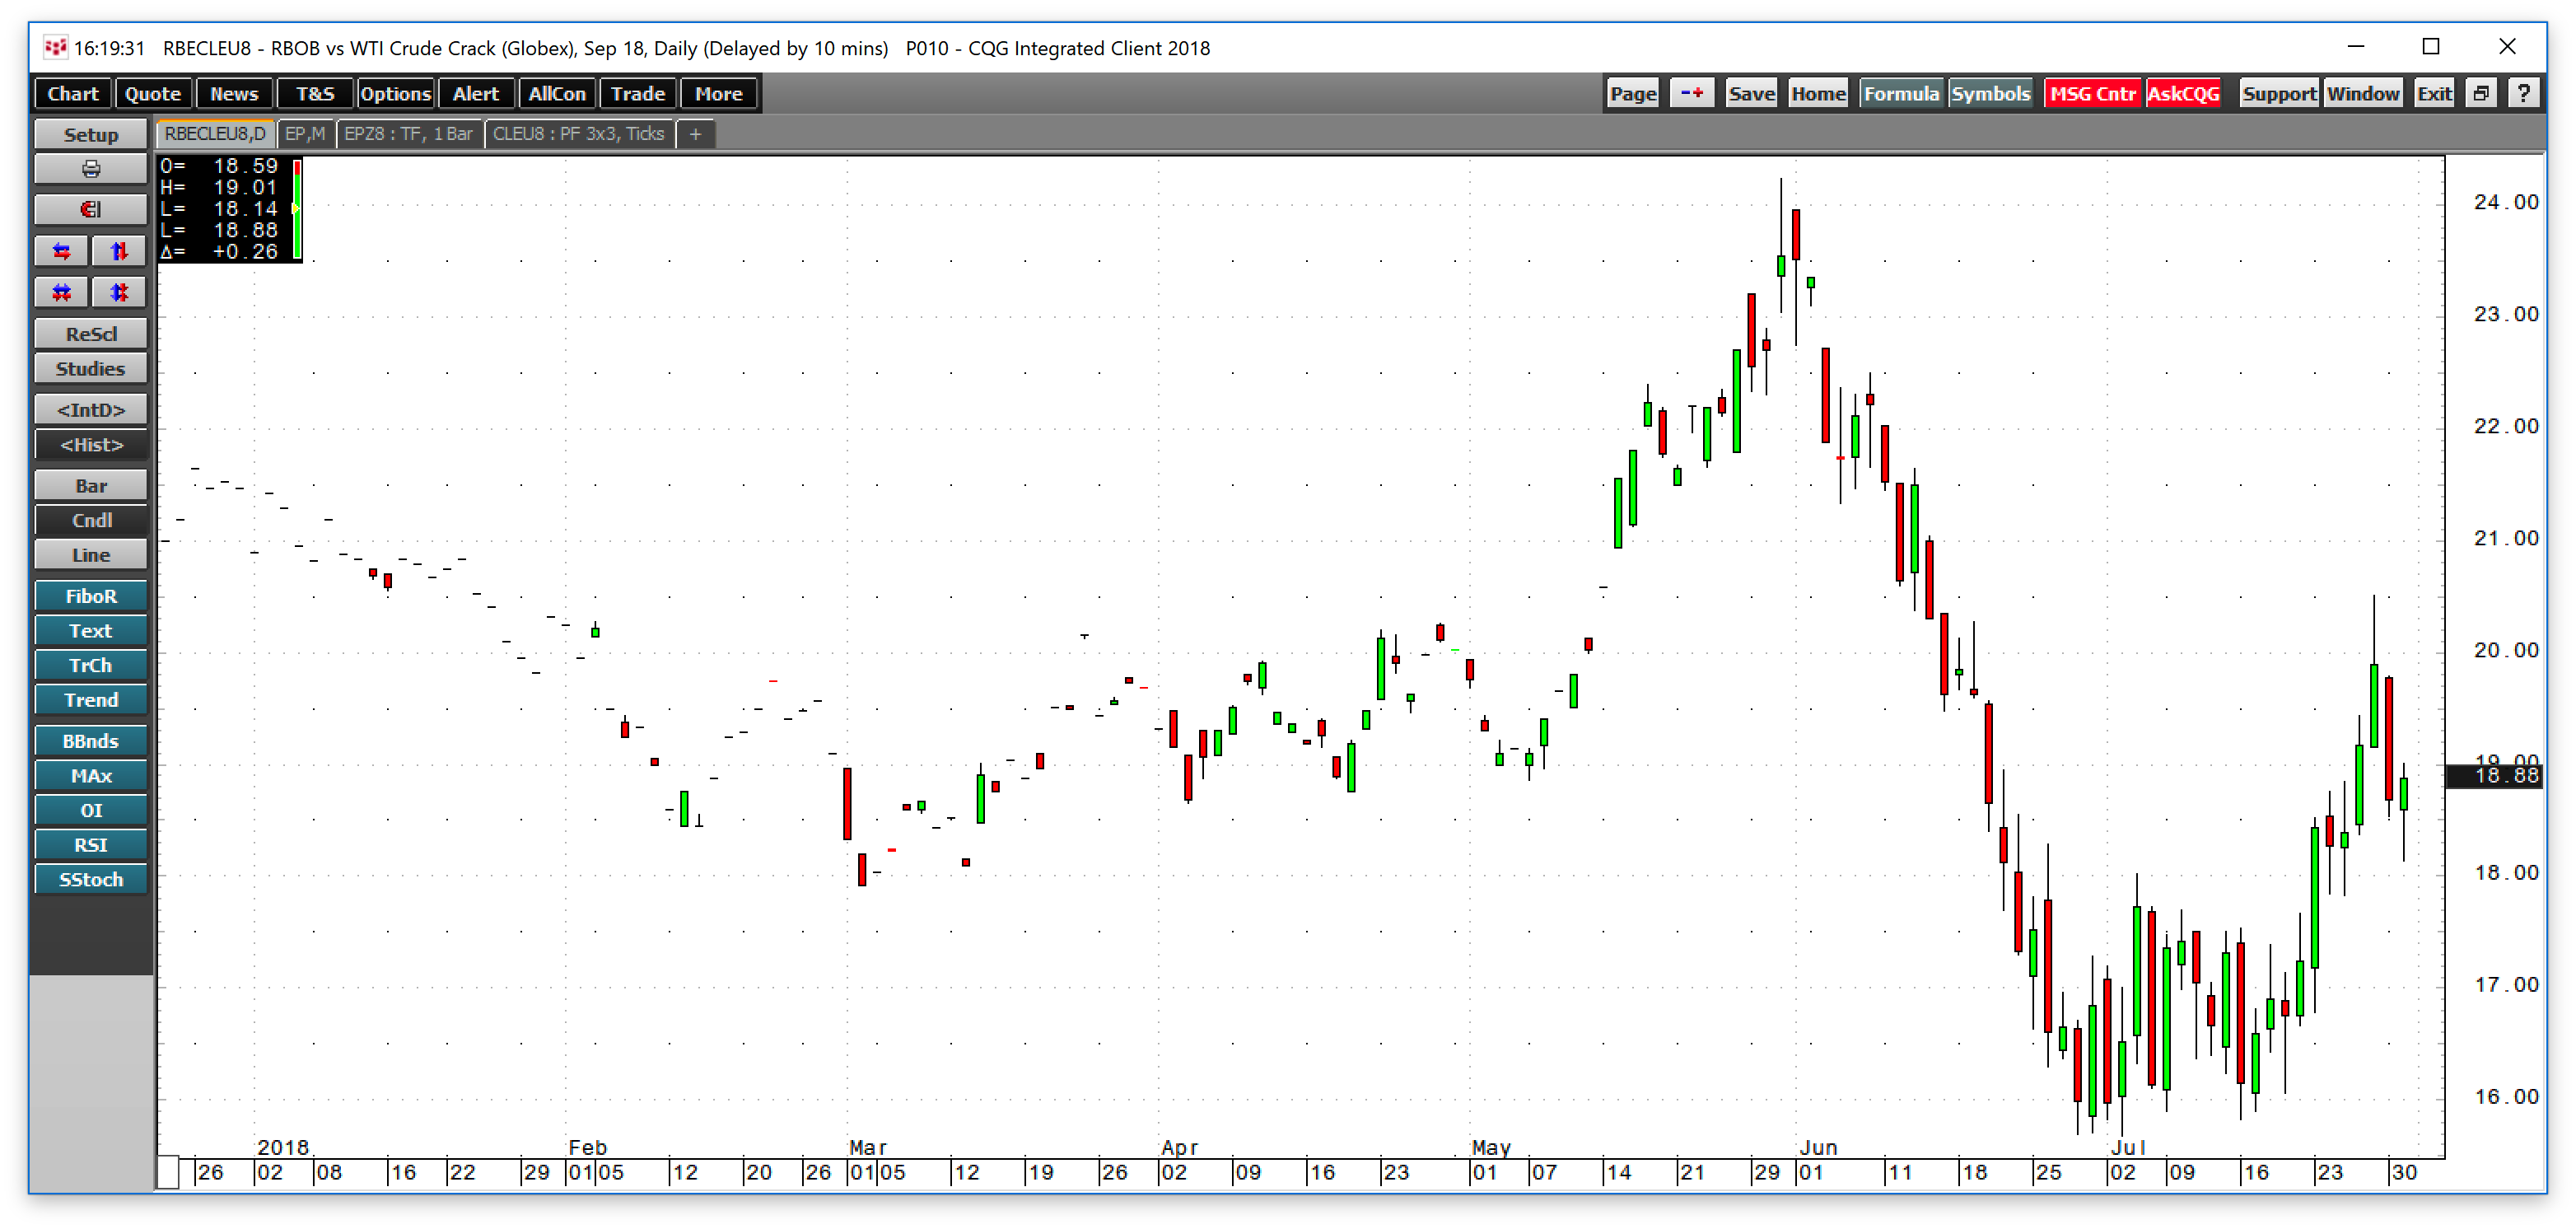
As the daily chart of the September gasoline crack spread shows, the refining spread for the fuel moved from under $16 per barrel in mid-July to the $20.51 per barrel level before pulling back to $18.88 on July 31. Even though we are moving from peak driving season to the off-peak season that starts on Labor Day, demand for gasoline remains buoyant. The gain in the crack spread is a supportive factor for crude oil which is the primary input in the production of the fuel.
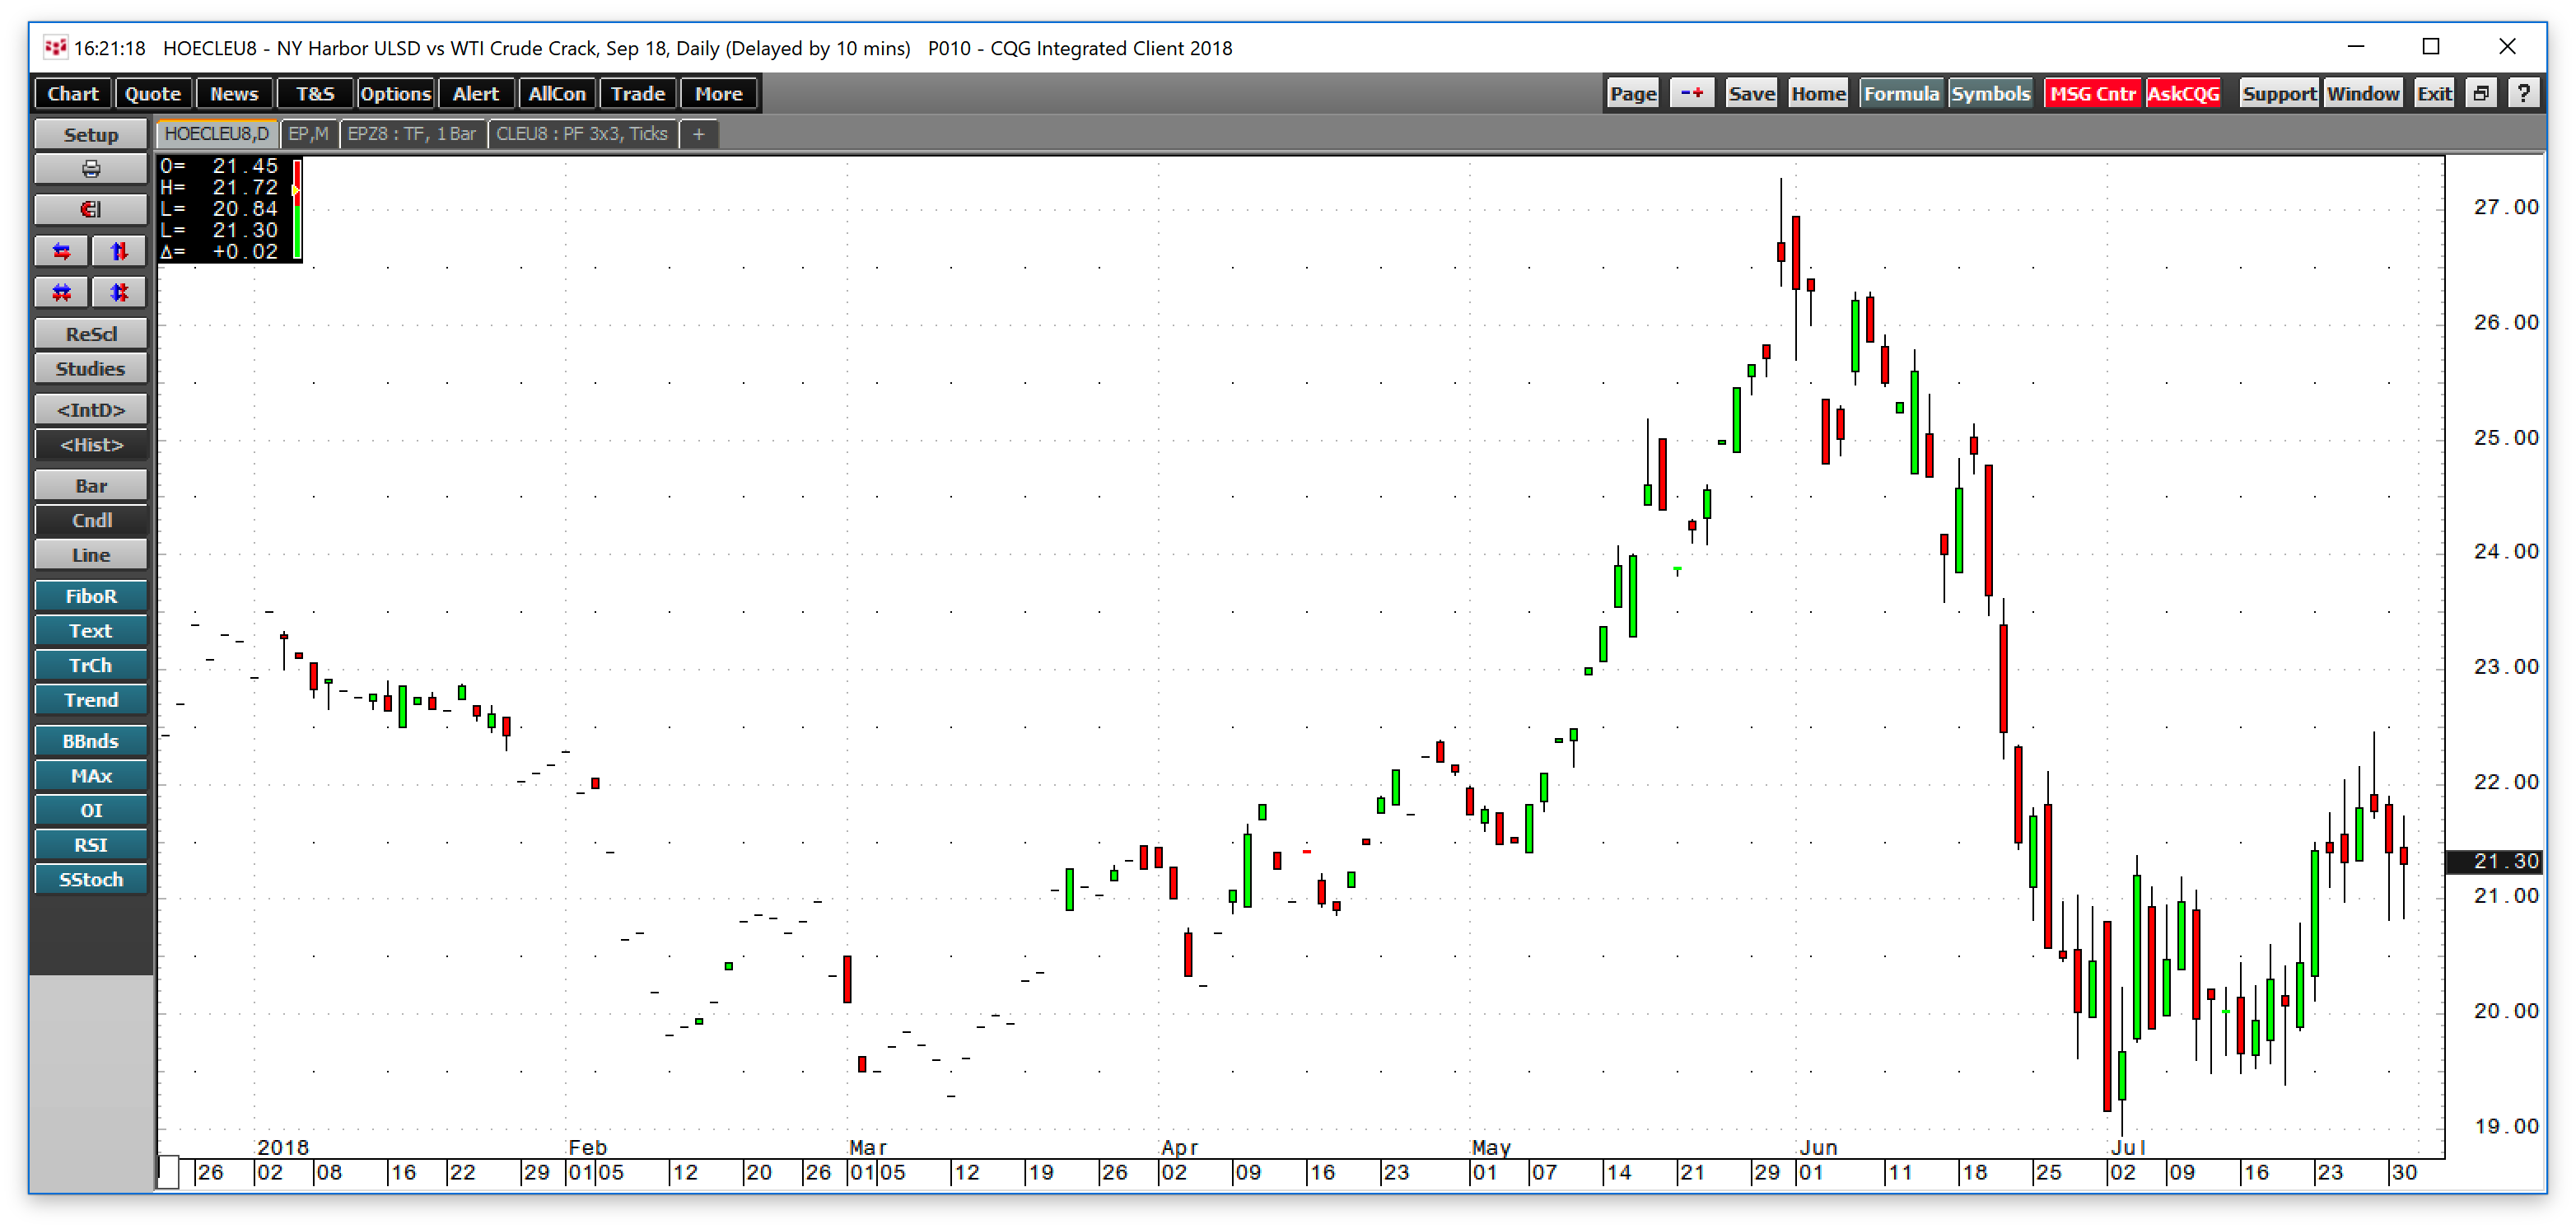
At the same time, the September distillate crack spread has rallied from just under $19 per barrel in early July to a high of $22.46 before pulling back to the $21.30 per barrel level at the end of July. The trends in both processing spreads is telling us that demand for oil and oil products continues to rise even though the price of the energy commodity is not far off its recent peak.
Reason Three - Iran
While technical factors and economic conditions favor further gains in the price of oil, recent developments in the Middle East have increased the potential for a price spike to the upside in the energy commodity.
Several months ago, the United States refused to recertify the Iran nuclear nonproliferation agreement. The administration has told markets that new and harsher sanctions on Iran are coming over the coming weeks and months. President Trump and Iranian President Rouhani have exchanged threatening comments over recent weeks with the U.S. leader warning Iran to cease and desist when it comes to threatening the U.S.
Tightening economic sanctions could lead to retaliatory measures by Iran. Iran ships approximately 2.7 million barrels per day through the Strait of Hormuz, a waterway that separates the Persian Gulf from the Gulf of Oman. Iran has threatened that any sanctions that restrict their ability to export crude oil to consumers around the world would result in measures to stop oil traffic in the region. In other words, if Iran cannot ship their oil, no other exporting nation in the area will be allowed to export the energy commodity. Around 20% of the world’s seaborne crude oil travels through the Strait of Hormuz each day, amounting to approximately nineteen million barrels. Any actions in the Strait by Iran, or others, that impact production, refining, or logistical routes in the Middle East could cause sudden upside volatility in the crude oil futures market.
There are at least three reasons why the price of crude oil could continue to head higher over the coming weeks and months. Meanwhile, the current situation with Iran could send the price back into triple-digit territory in the blink of an eye.