The dollar index futures contract hit a high of 103.815 at the beginning of January 2017 after rising from lows of 78.93 in May 2015. The index broke out to the upside on a technical basis when it rose above the October 2005 high at 92.53, and the January 2015 peak at 100.38. The target on the upside was at the 2001 apex at 121.29 level, but the dollar reversed and fell steadily throughout 2018 and into early 2018.
In February 2018, the dollar index reached a low of 88.15, and since then it has been recovering. The dollar is the world’s reserve currency and the benchmark pricing mechanism for most commodities. There is a strong inverse correlation between the U.S. currency and raw material prices and over recent months, the commodities market has been following the dollar like an obedient puppy.
A bullish trend in the dollar
The dollar had been trading at, or close to, lows from late January through late April as it was in a range from under 88.30 to under the 91 level until the week of April 23. The three month period of consolidation near the lows came to an end when the dollar index broke out to the upside in late April.
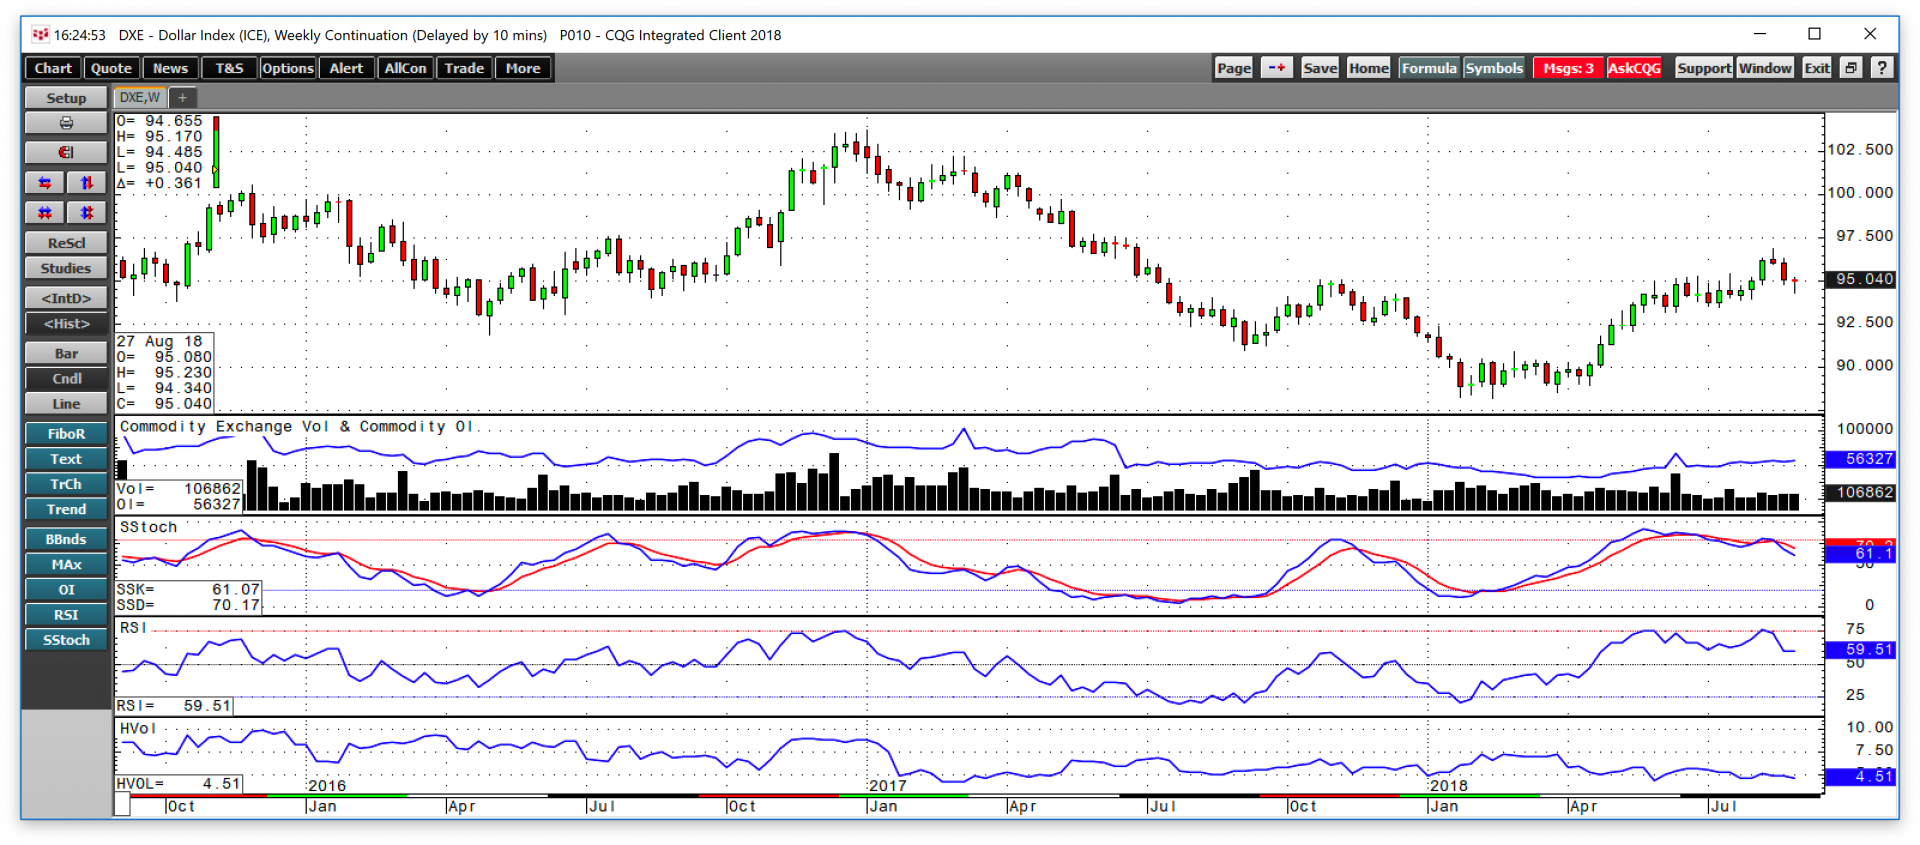
As the weekly chart highlights, the index has been making higher lows and higher highs over the past four months, reaching its most recent peak on August 16 at 96.865 on the September futures contract. By the end of August, the dollar had pulled back to the 95 level. The weekly pictorial displays an overbought condition when it comes to the slow stochastic. The downside correction in the dollar since the mid-August high drove relative strength from overbought to neutral territory. Meanwhile, open interest, which is the total number of open long and short positions on the dollar index futures contract, has risen from 31,116 contracts during the week of April 2 to its current level at 56,327 contracts, an increase of 25,211 or 81%. During that period the index moved from under 90 to the recent high. Increasing price accompanies by rising open interest is typically a validation of a bullish trend in a futures market. The euro currency accounts for approximately 57 percent of the dollar index, and the widening interest rate differential between the dollar and euro currencies has supported the dollar and depressed the value of the euro. At the same time, the dollar’s strength has weighed on the prices of many commodities futures markets over recent weeks and months.
Gold and precious metals move almost tick-for-tick
Gold, and other precious metals prices have been marching in near lock-step with the dollar index over recent months.
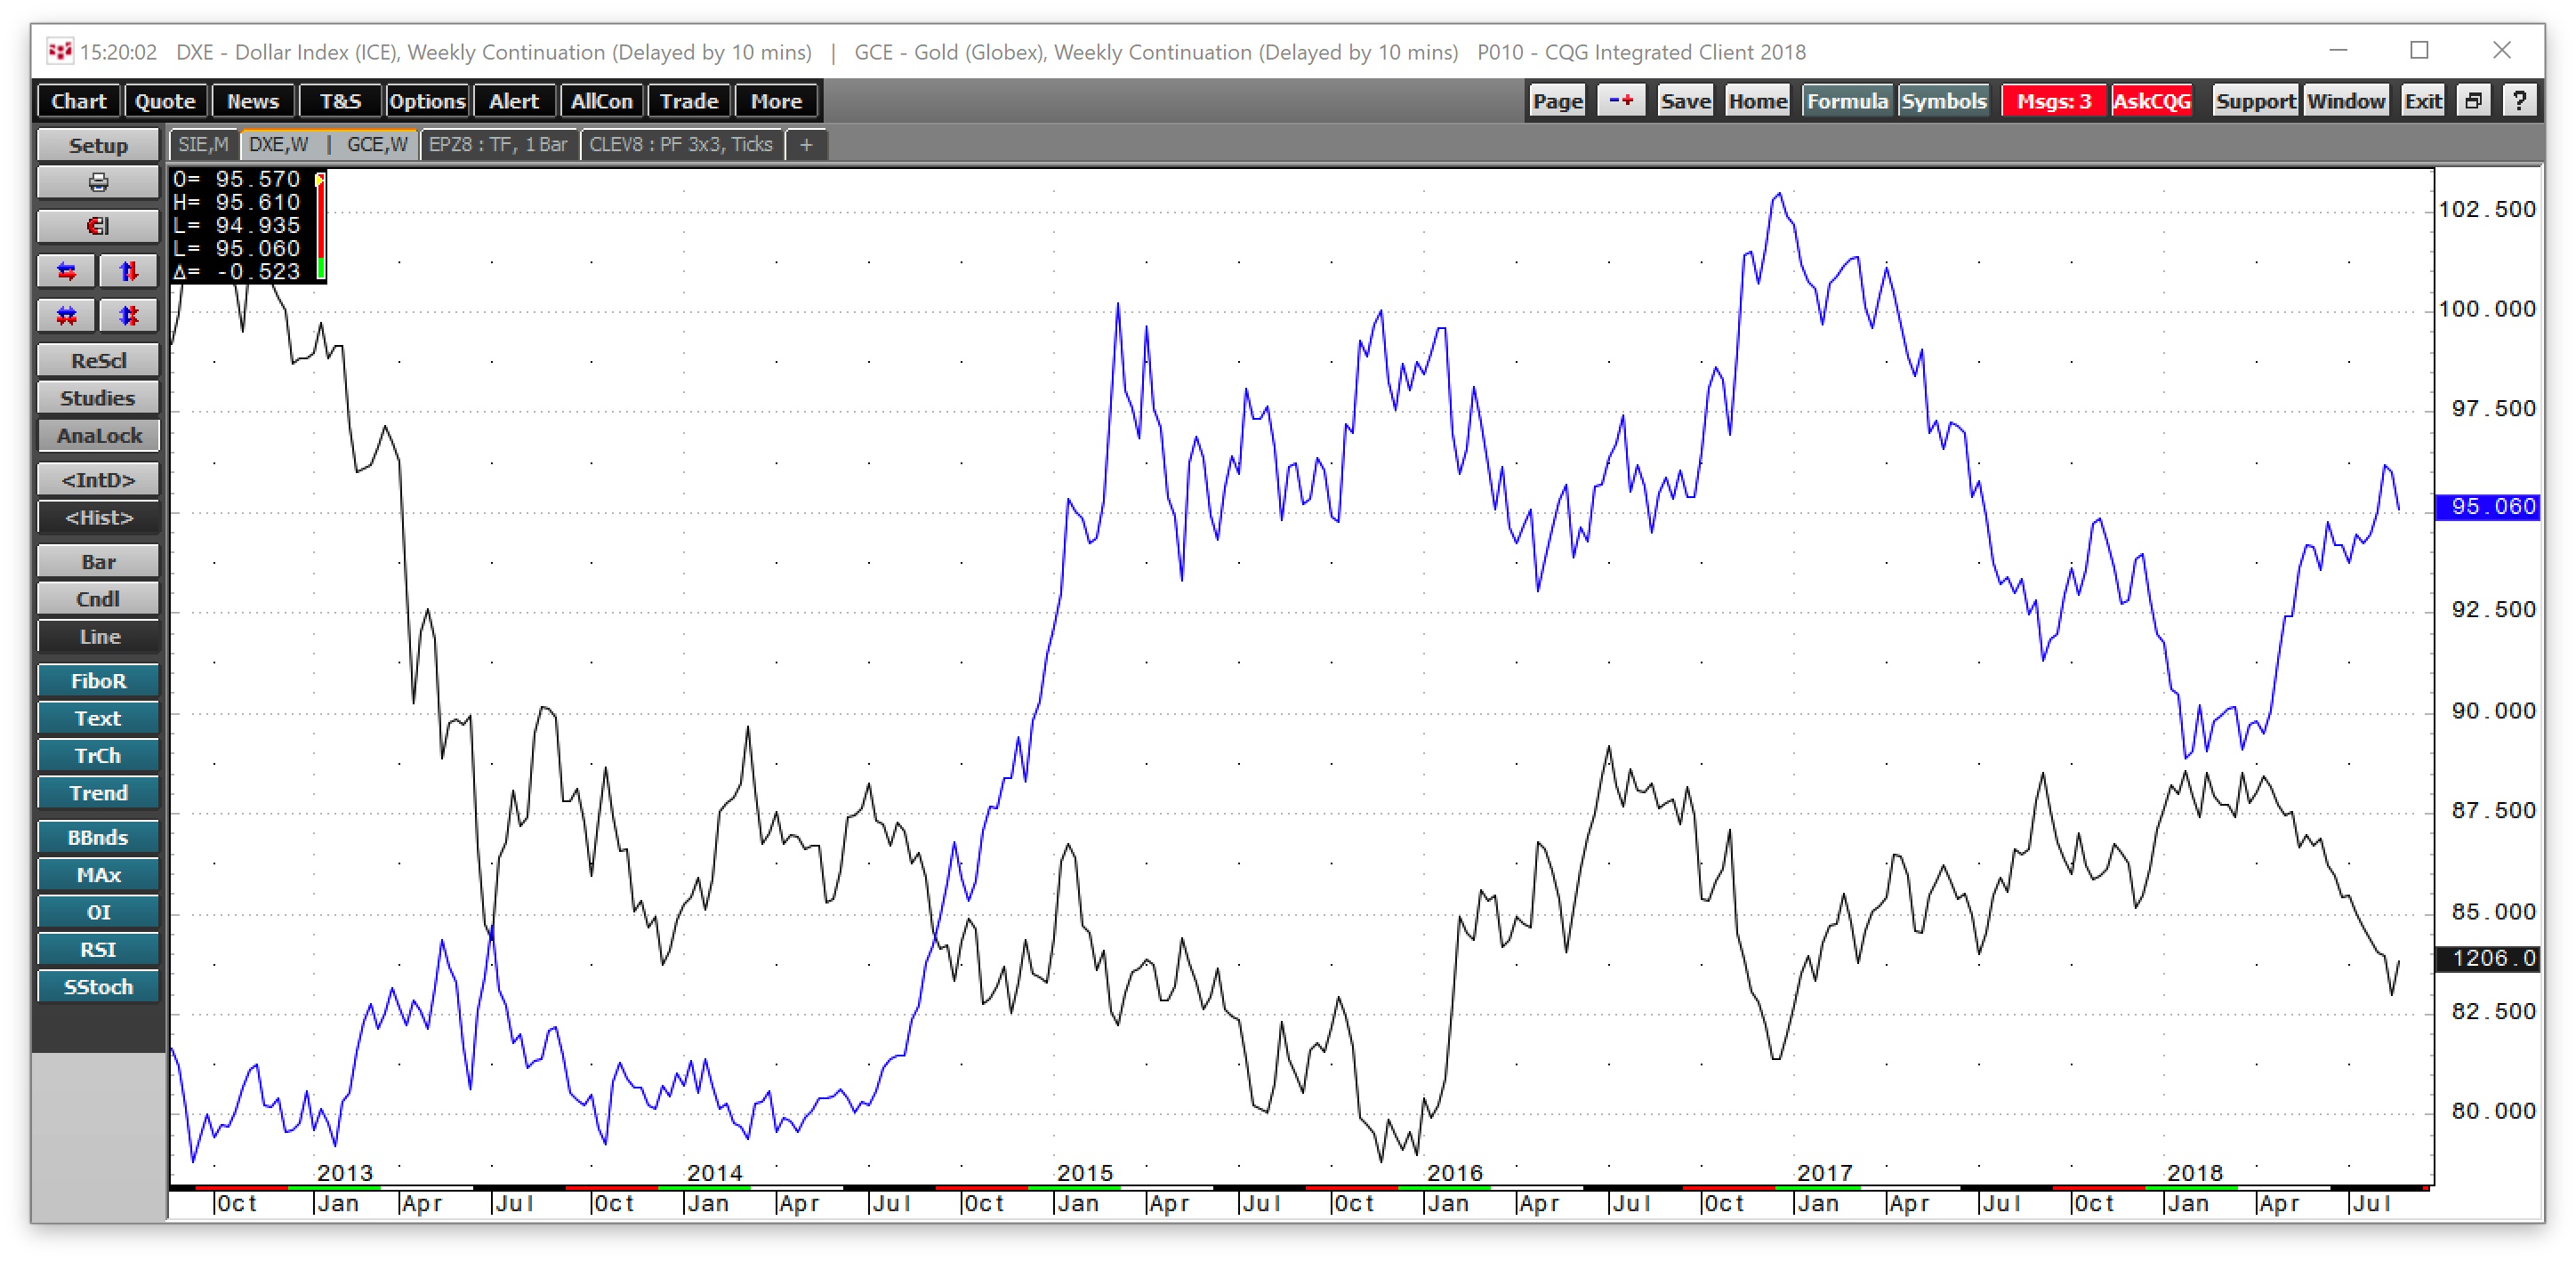
As the chart of COMEX gold (black) and the dollar index (blue) shows, in 2018 the inverse correlation between the yellow metal and the dollar has been almost picture perfect. Most recently, when the dollar index hit a high of 96.865 on August 15, which was the highest level of 2018 and since June 2017, gold fell to a low of $1161.40 the following day, its lowest price since the very beginning of 2017. When the dollar moved back to the 95 level, gold popped back to the $1200 per ounce level by the end of August. The prices of the more volatile silver and platinum futures market have been following gold and have moved inversely to the U.S. dollar.
Copper and base metals watch the dollar and trade
While the dollar has had a bearish influence on the price of copper, the red metal has also moved to the downside under the weight of the trade dispute between the United States and China. China is the world’s leading consumer of copper metal which is also a barometer for global economic growth or contraction. Copper is a leader in the industrial commodities sector, and the potential for a trade and currency war between the U.S. and China sent the price of copper tumbling since early June. Moreover, the strength in the dollar has added insult to injury when it comes to the price of the red metal.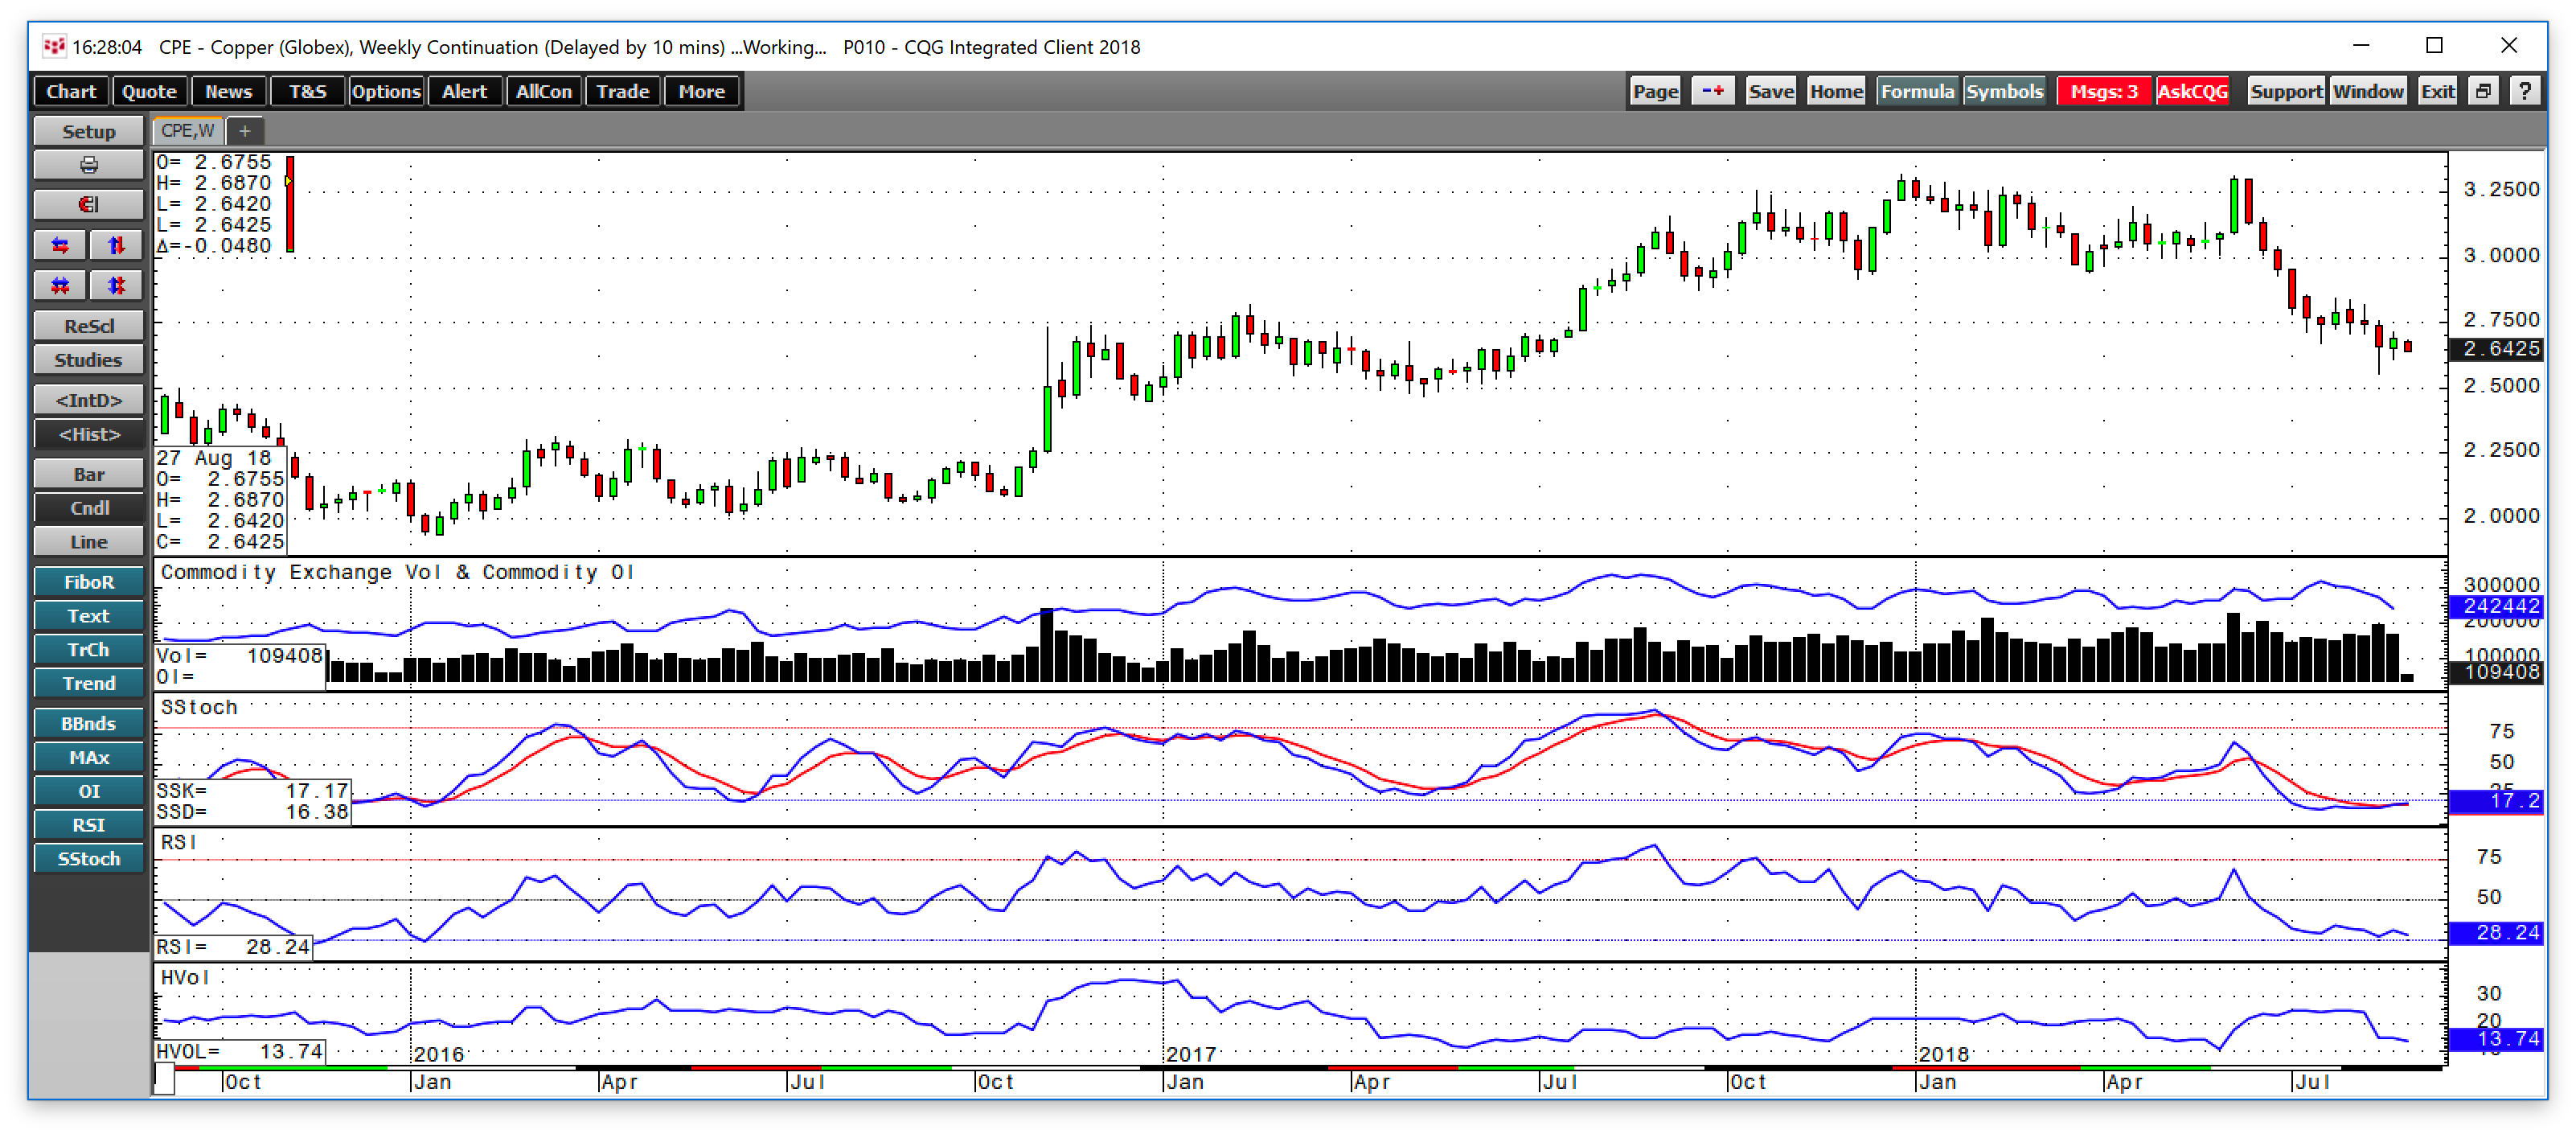
As the weekly chart illustrates, the price of the red metal declined from a high of $3.3155 in early June to lows of $2.5520 when the dollar made its most recent high in mid-August. Copper rallied on the potential of a strike at the world’s leading mine in Chile in early June. However, after a summer of negotiations BHP and the union reached a deal to avert a strike at the Escondida property. While some of copper’s weakness came from a continuation of production at Escondida, the trade issues facing China, which increase the potential of an economic slowdown and a strong dollar have created a potent bearish cocktail that took the price over 23% lower from the early June peak to the mid-August low. Copper and other base metals prices have moved lower as they were also victims of the rise of the dollar over recent weeks and months.
Grains follow trade, but softs are all about the greenback
Grains have been ground zero in the trade dispute between the U.S. and China as the United States is the world’s leading producer of soybeans and corn, and a significant exporter of wheat. In past years, the Chinese have purchased one-quarter of the U.S. soybean crop, and their cancelation of shipments for 2018 and 2019 sent the price of the oilseed reeling to the downside. While corn followed beans in sympathy, wheat has been the strongest grain as dry conditions in Europe and Russia has reduced crop levels from last year. While trade issues have weighed on the prices of grains, the strong dollar has not helped as it added additional selling pressure to the futures markets on the CBOT division of the CME.
Sugar and coffee are two soft commodities that are not in the crosshairs of the trade dispute, but the prices of both the sweet commodity and Java beans decline to their lowest levels in over a decade because of a strong dollar and weak Brazilian real. Brazil is the world’s leading producer of both sugarcane and Arabica coffee beans, and the currency markets have driven the prices of both below technical support levels and to levels not seen in sugar in a decade and coffee in a dozen years.
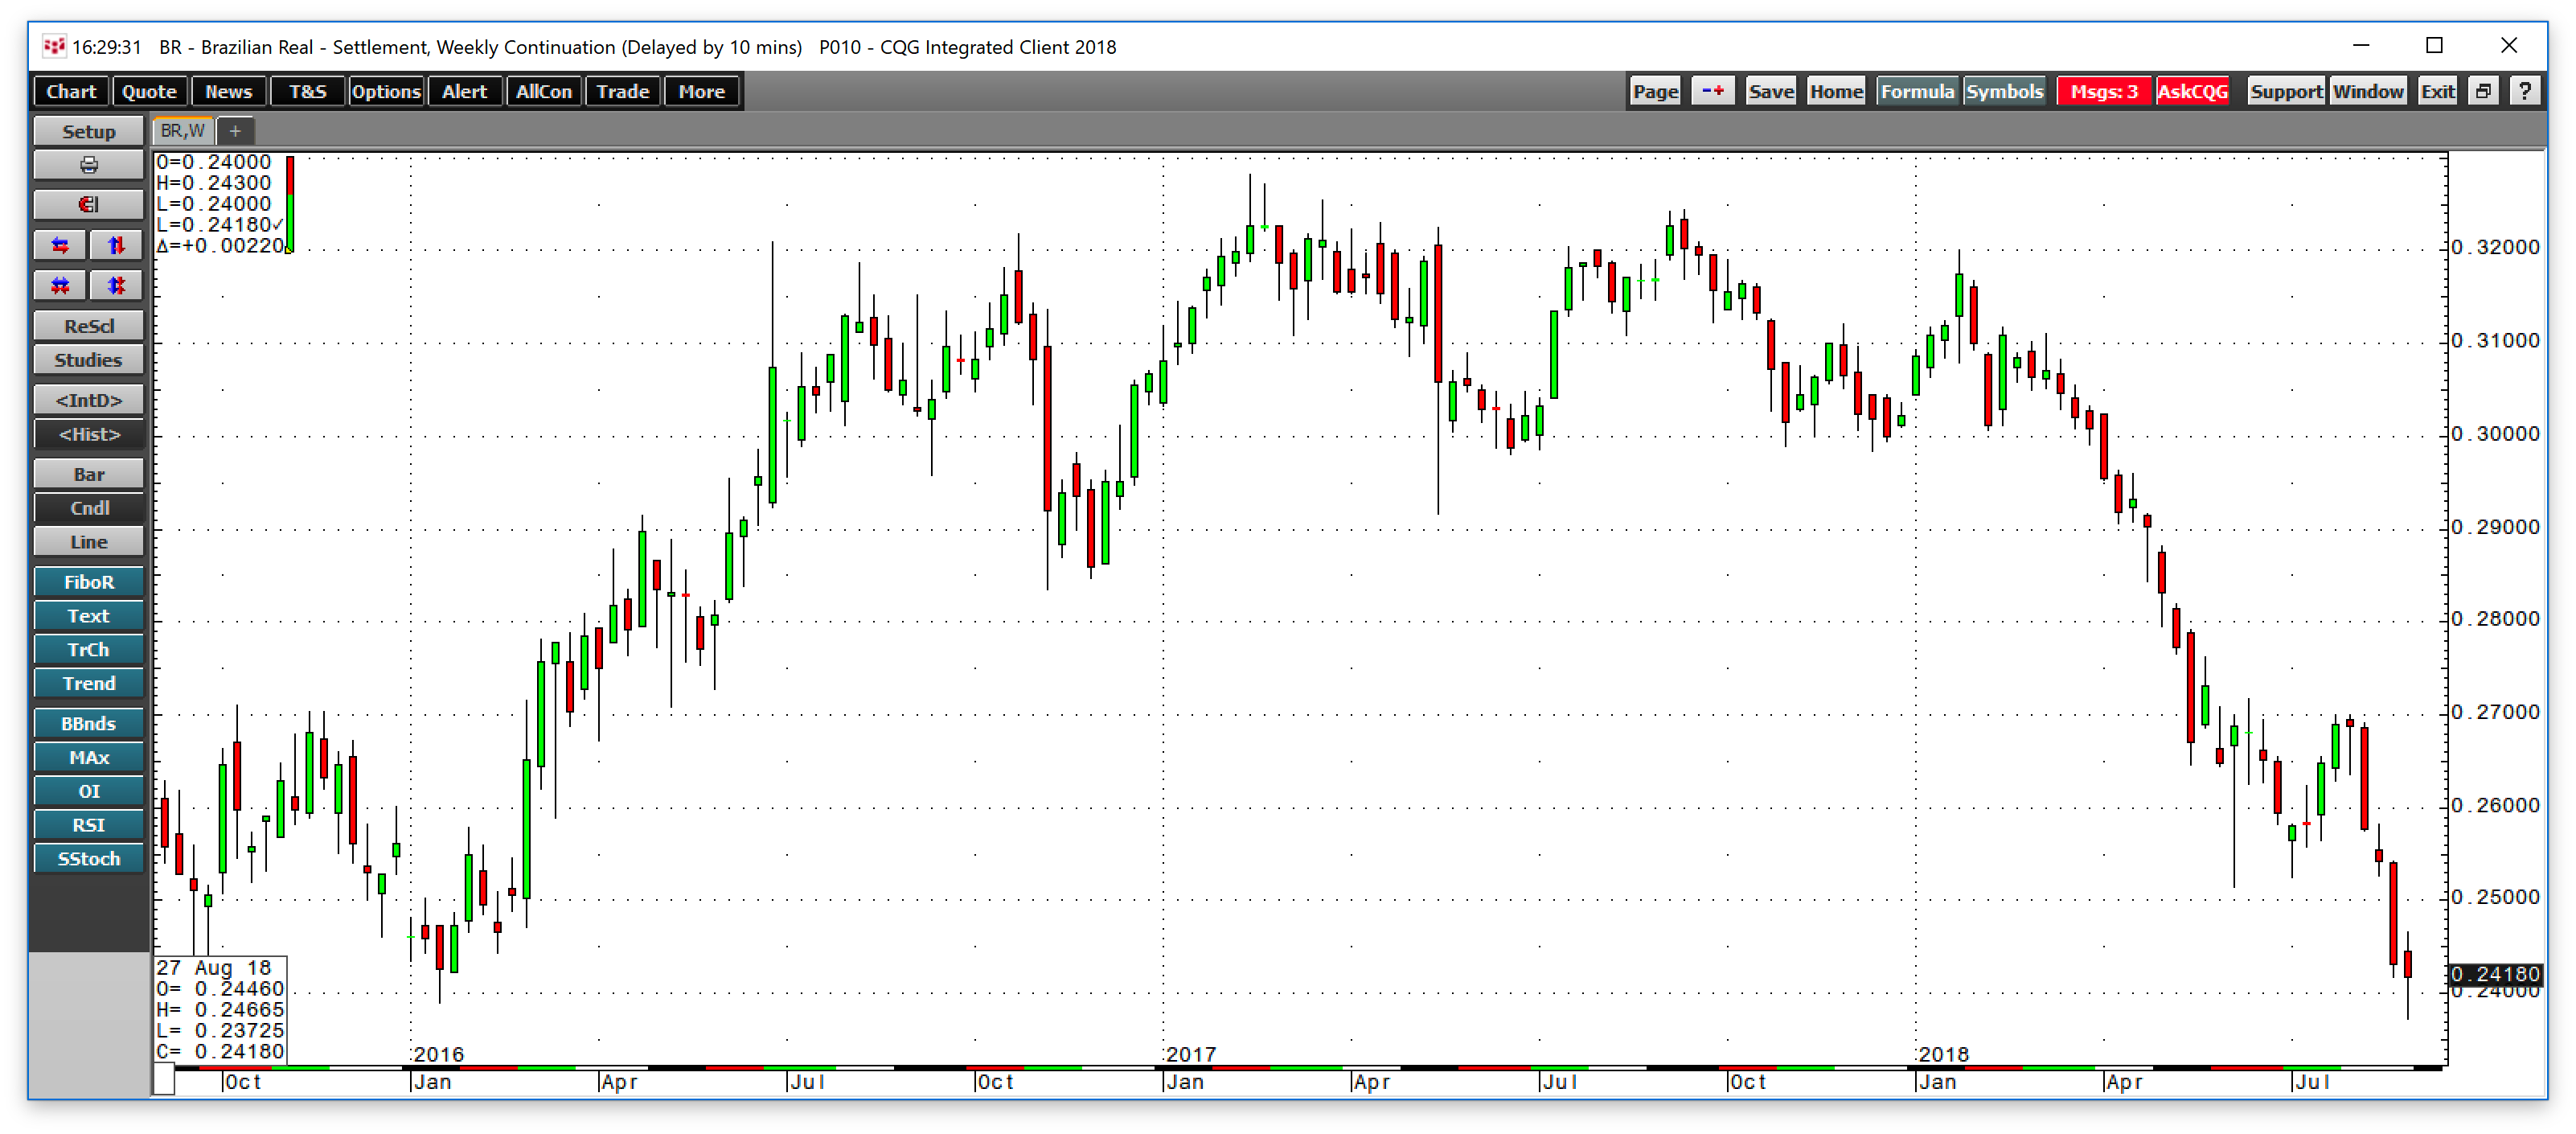
The Brazilian real dropped from 0.32005 against the dollar in January 2018 to lows of 0.23725 at the end of August, a drop of 25.8%. The weak real contributed to weakness in the sugar and coffee futures markets, which fell to multiyear lows.
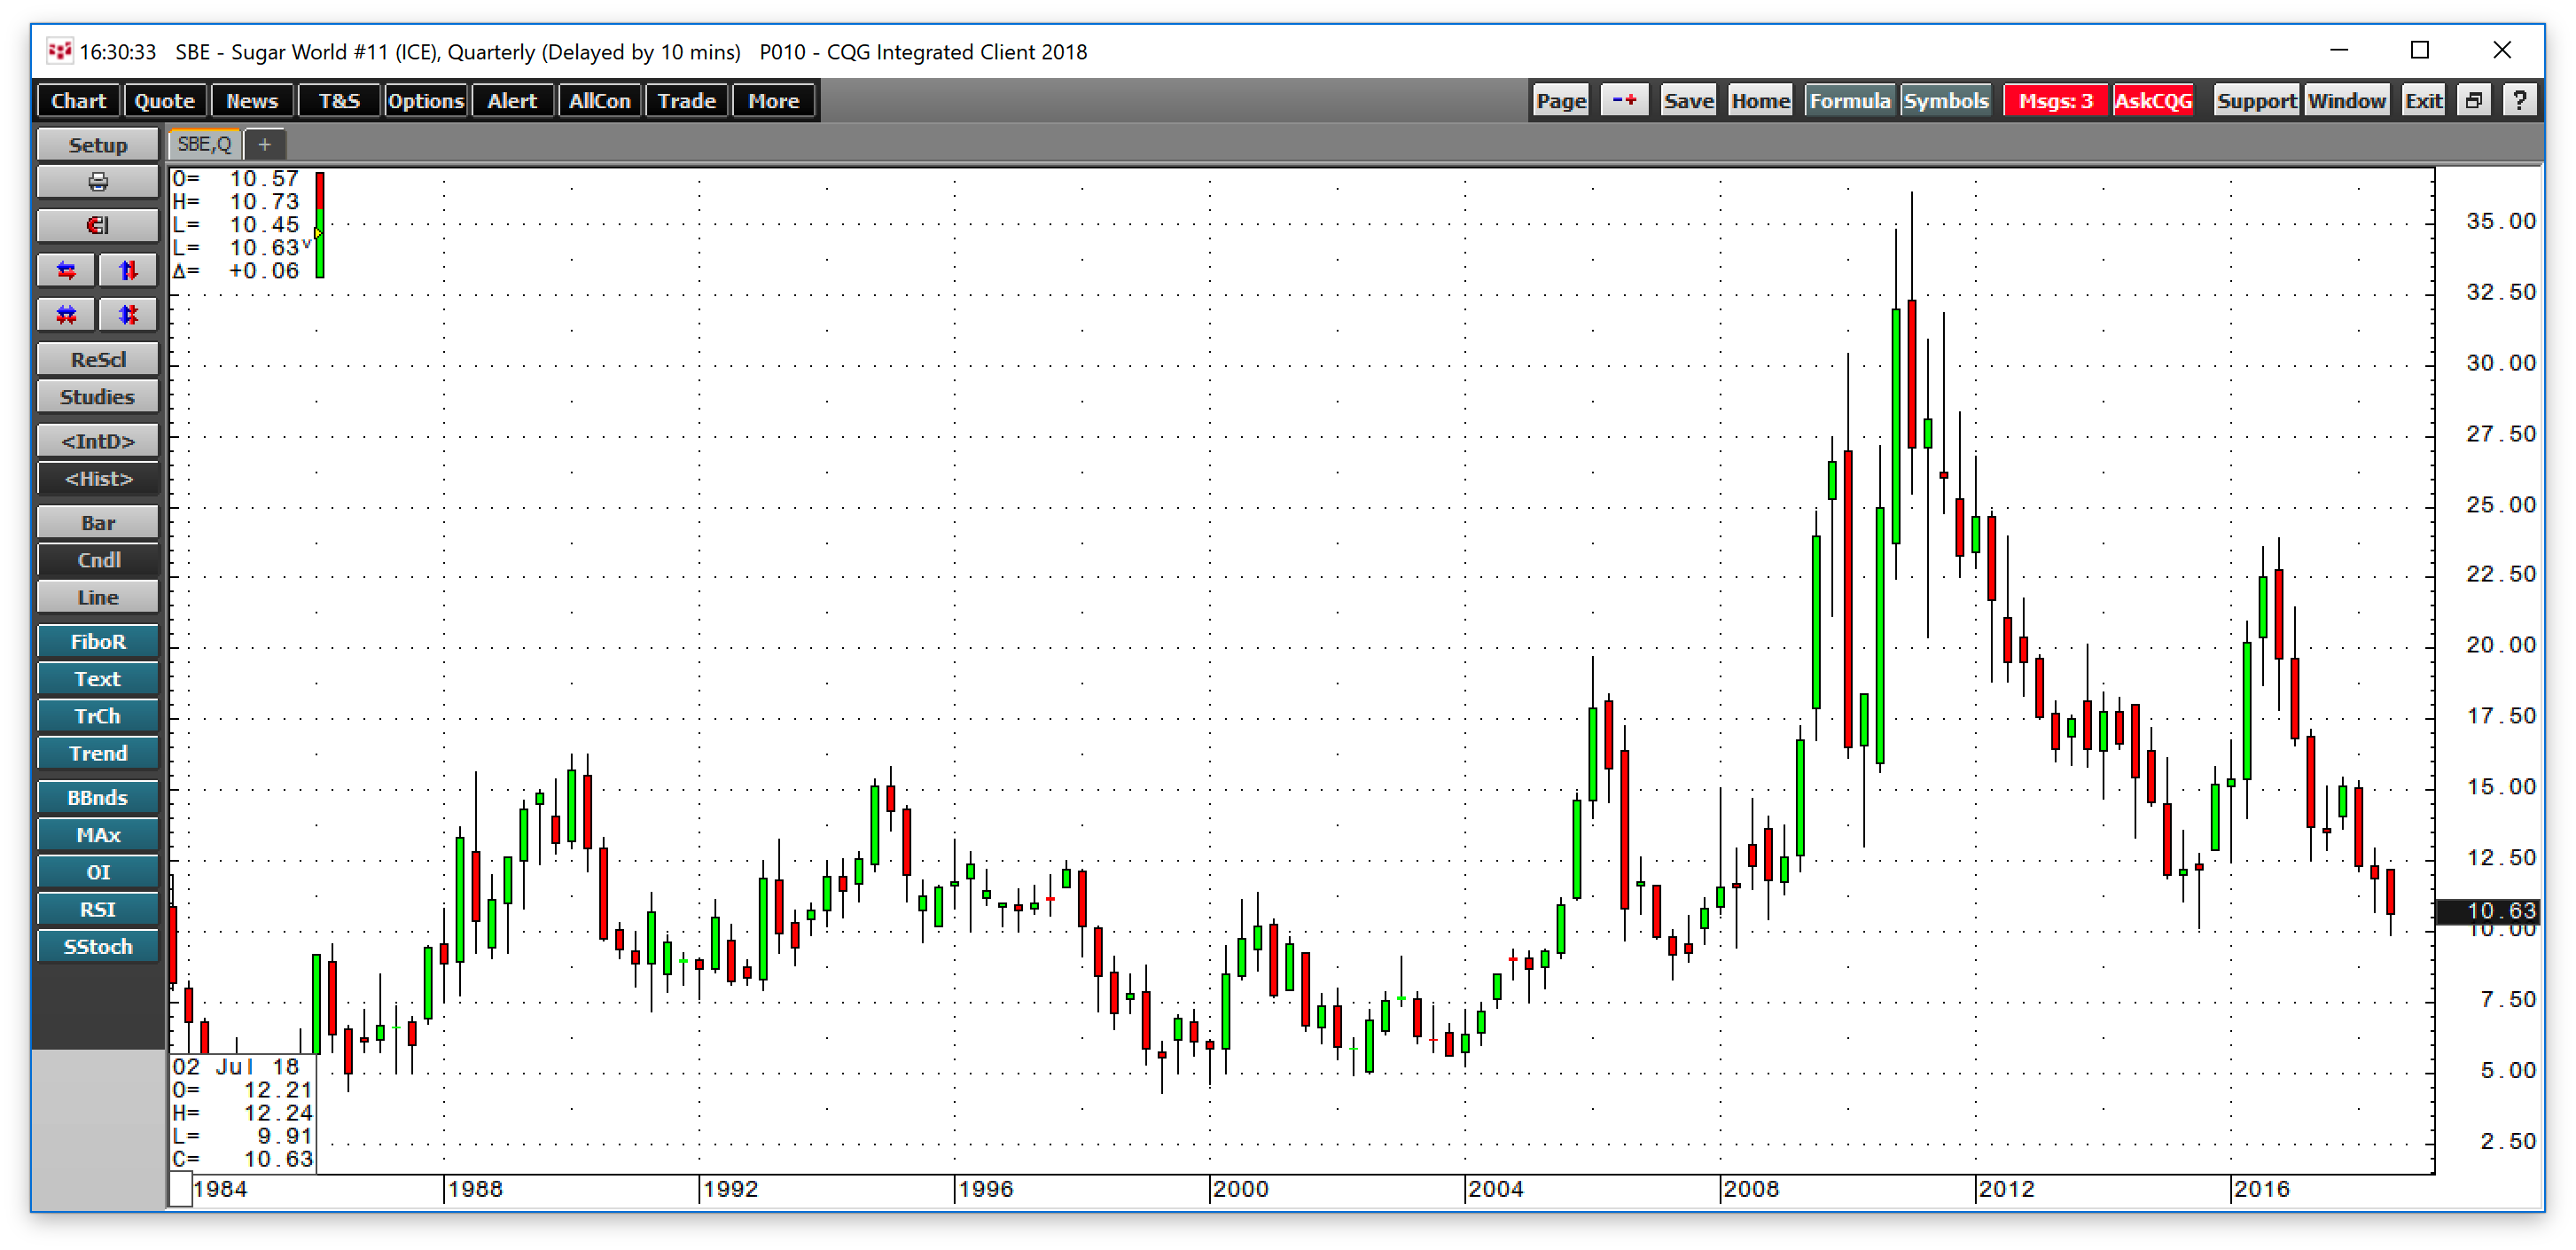
The quarterly chart of ICE sugar futures shows that the October futures contract moved to a low of 9.91 on August 22, which was the lowest price for the sweet commodity since Q2 of 2008, a decade low.
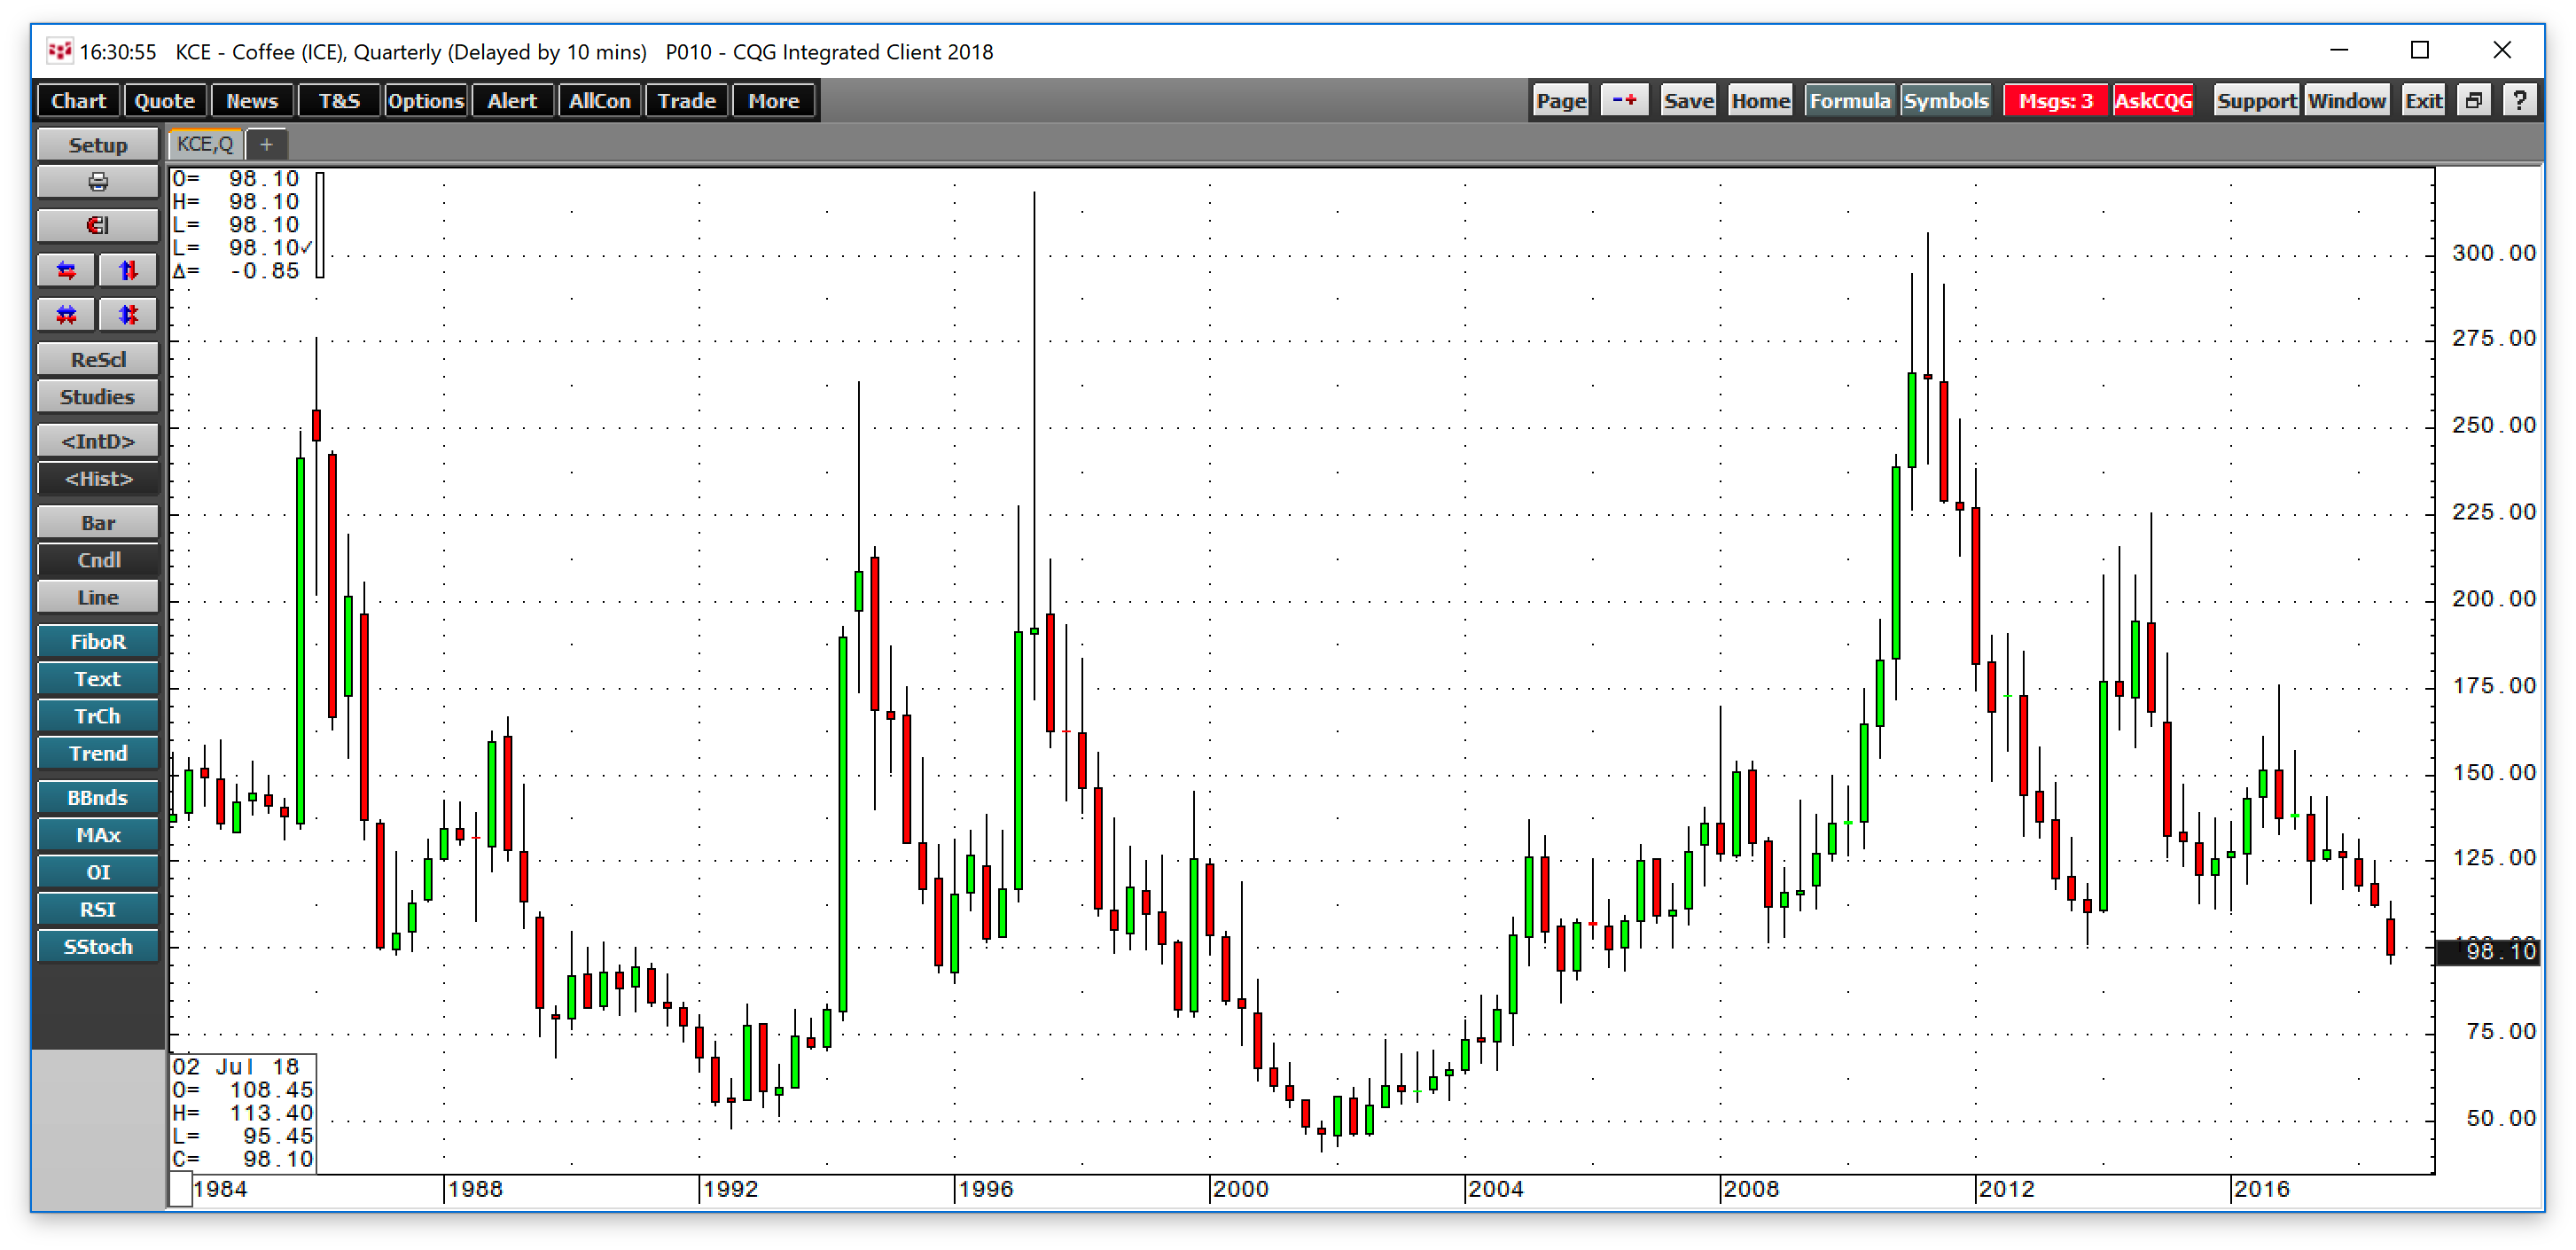
Meanwhile, the long-term chart of ICE coffee futures displays the decline to a low of 95.45 cents per pound on August 22, the lows price since Q3 2006, the lowest price in a dozen years.
While sugar and coffee crops have been more than sufficient to meet global demand, the weak Brazilian currency contributed to the moves to multiyear lows. Like most other commodities during August 2018, coffee and sugar fell to dramatic levels on the back of a strong dollar.
The crude oil bull follows to some extent
Crude oil has been in a bull market since the price of the energy commodity found a bottom in February 2016 at $26.05 per barrel. The nearby NYMEX futures contract experienced its last leg to the upside starting in June 2017 when the price was at $42.05 per barrel.
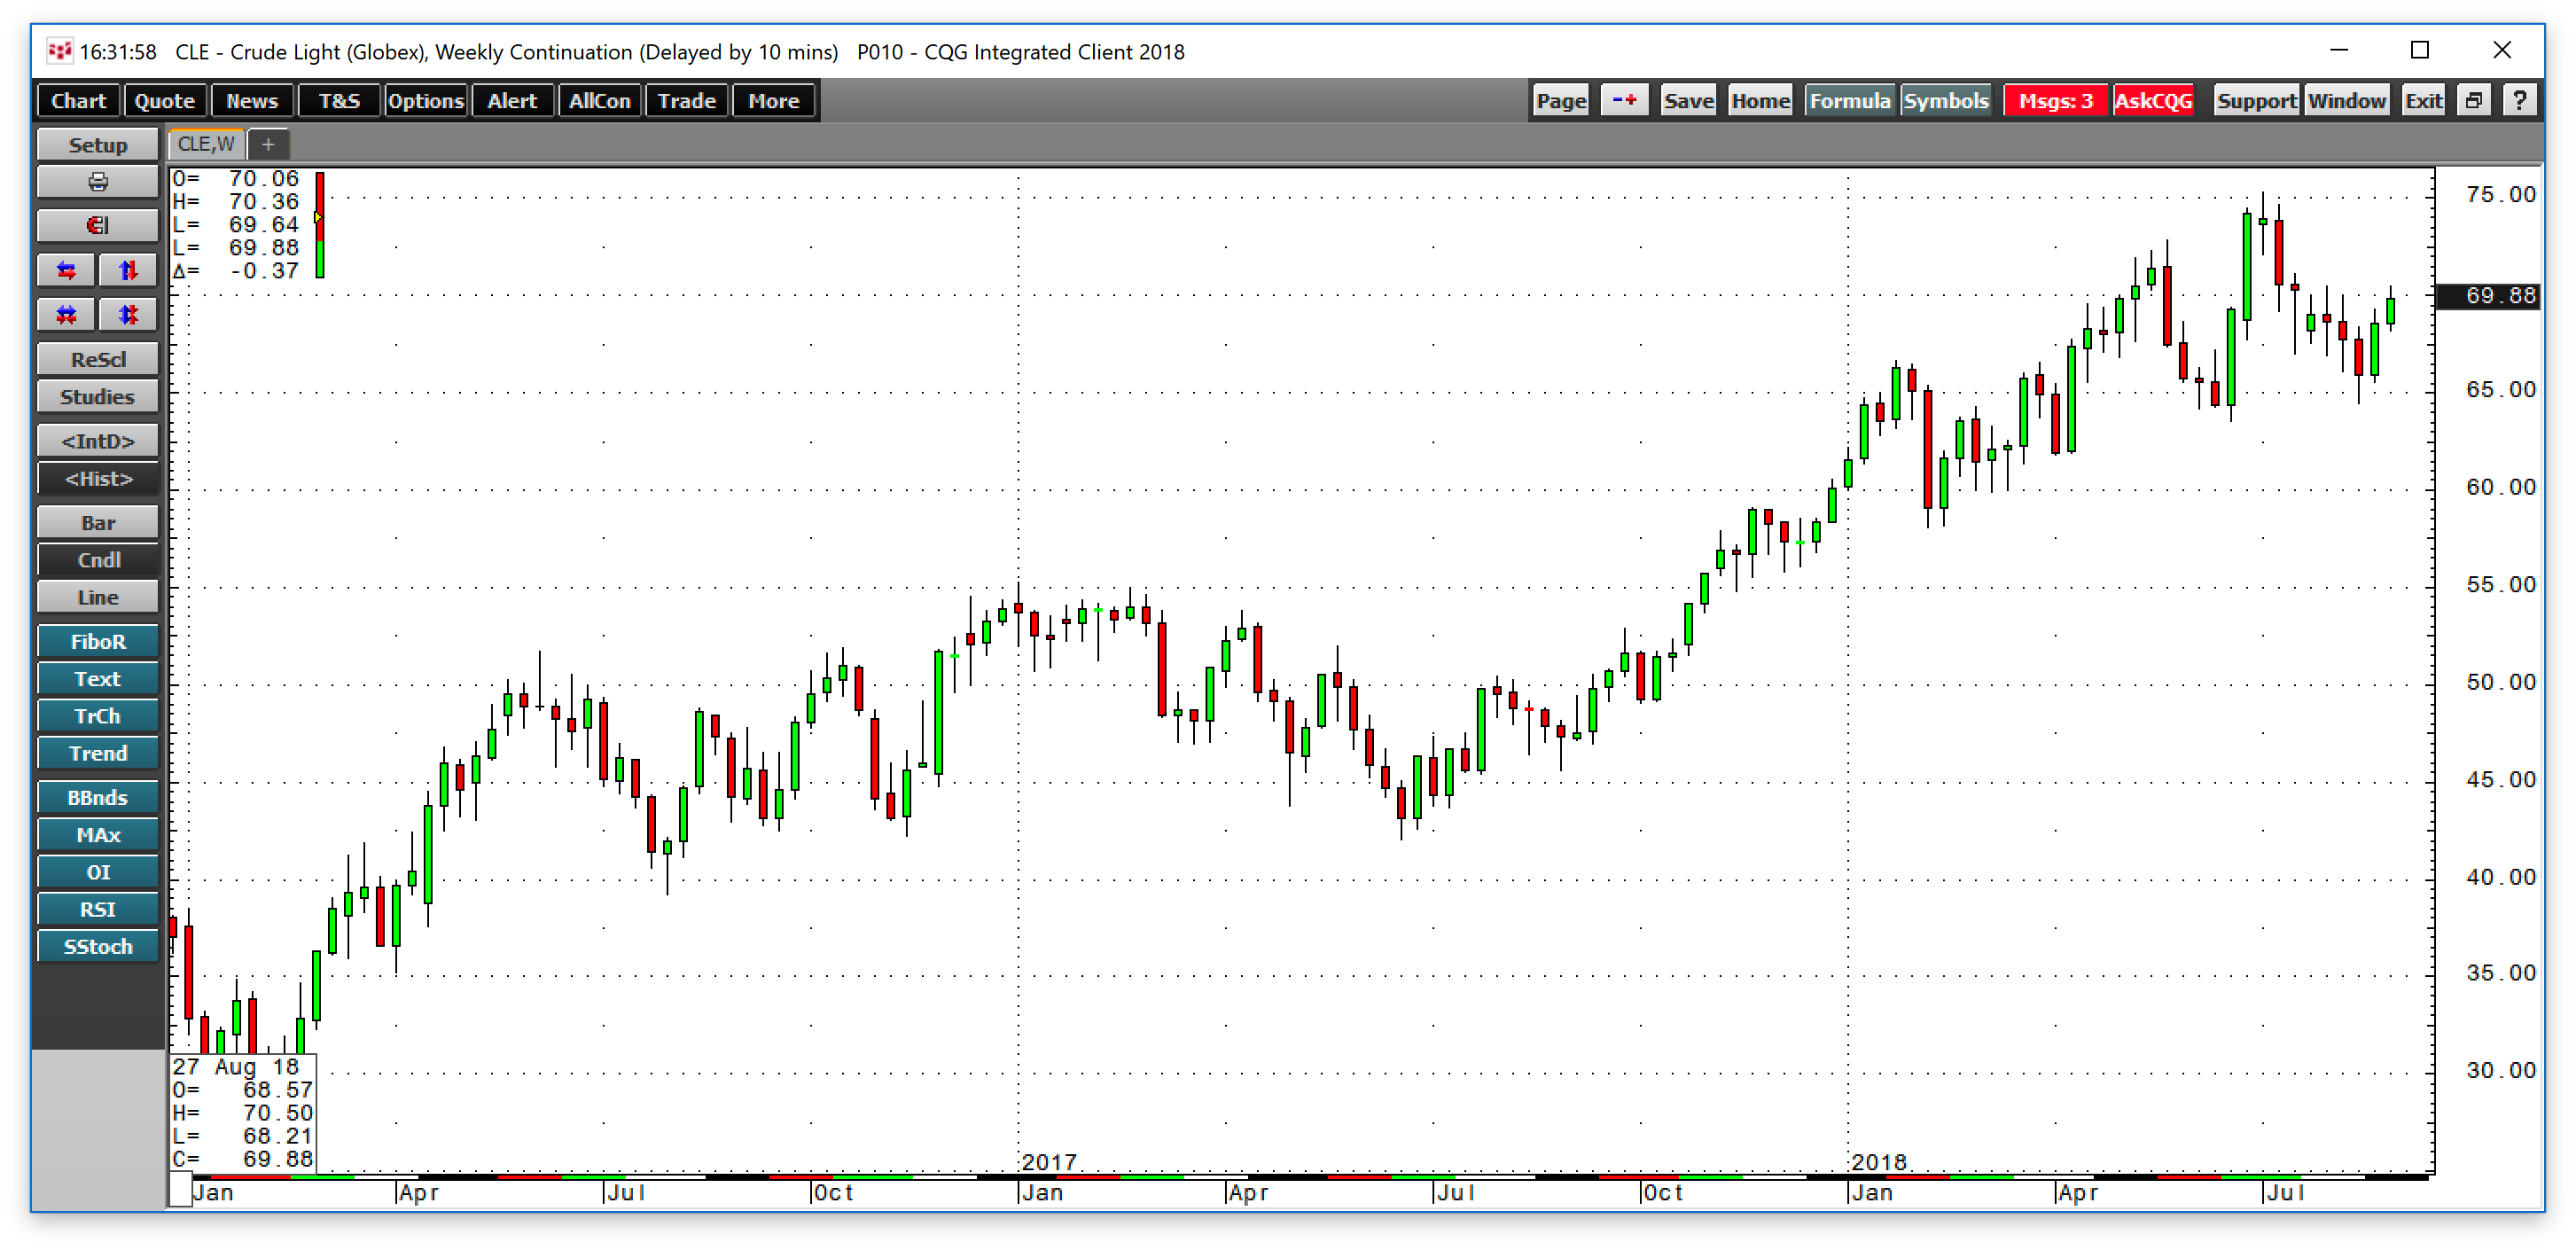
As the weekly chart shows, the price of crude oil traded to a high of $75.27 at the beginning of July. The latest speed bump came on August 16 as the dollar index hit its high, crude oil traded to a low of $64.43 per barrel, but the retreat in the dollar sent the price of oil back to the $70 barrel by the end of the month.
While many factors determine the path of least resistance for commodities prices, the dollar has been a driving force as raw materials markets continue to follow the dollar like obedient puppies.