
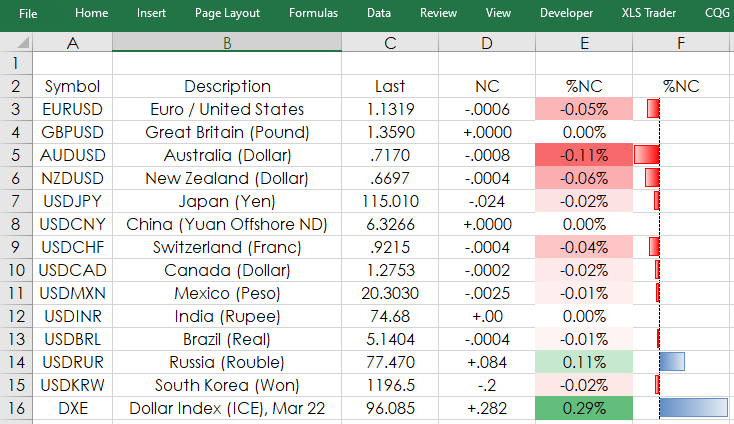
Microsoft Excel spreadsheets have functionality to format cells based on conditions. This feature is also referred to as data visualization. This post details two types of data visualizations… more
General
Added exchange names to symbol auto-suggest
Symbol auto-suggest shows more results
Charts
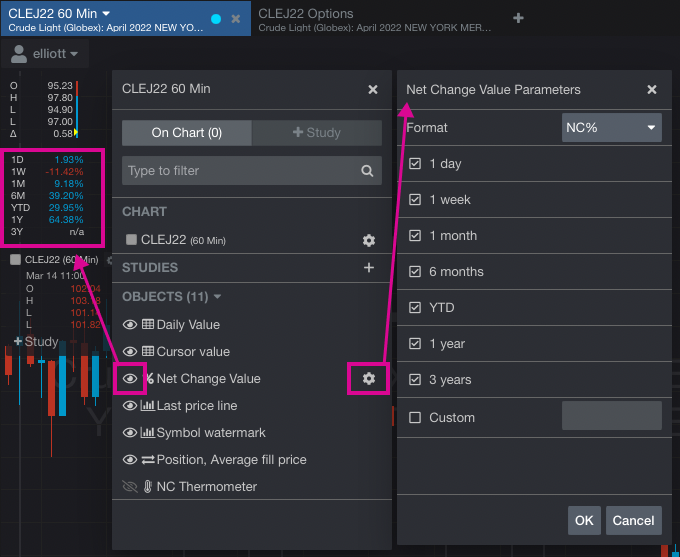
Added net change percent display for previous periods
Options
Greeks columns now available… more

Profound volatility was the primary feature of petroleum markets which had their first weekly loss since Russia’s invasion of Ukraine. Prices fell sharply after reaching historic highs on Monday.… more
There are so many things to consider when trading in the current climate. First and foremost, CAUTION is the key word, not FEAR. As Billy Joel would say, “We didn’t start the fire,” but as traders… more


Russia’s invasion of Ukraine caused a historic spike in petroleum prices which registered their largest weekly gains in terms of dollars on record. Accentuating the week was the dangerous seizure… more
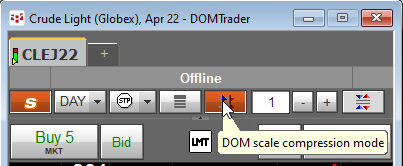
For some symbols the price ladder can be compressed, which means that ticks can be viewed in a quantity different from the exchange value.
You can set the amount of the compression next… more
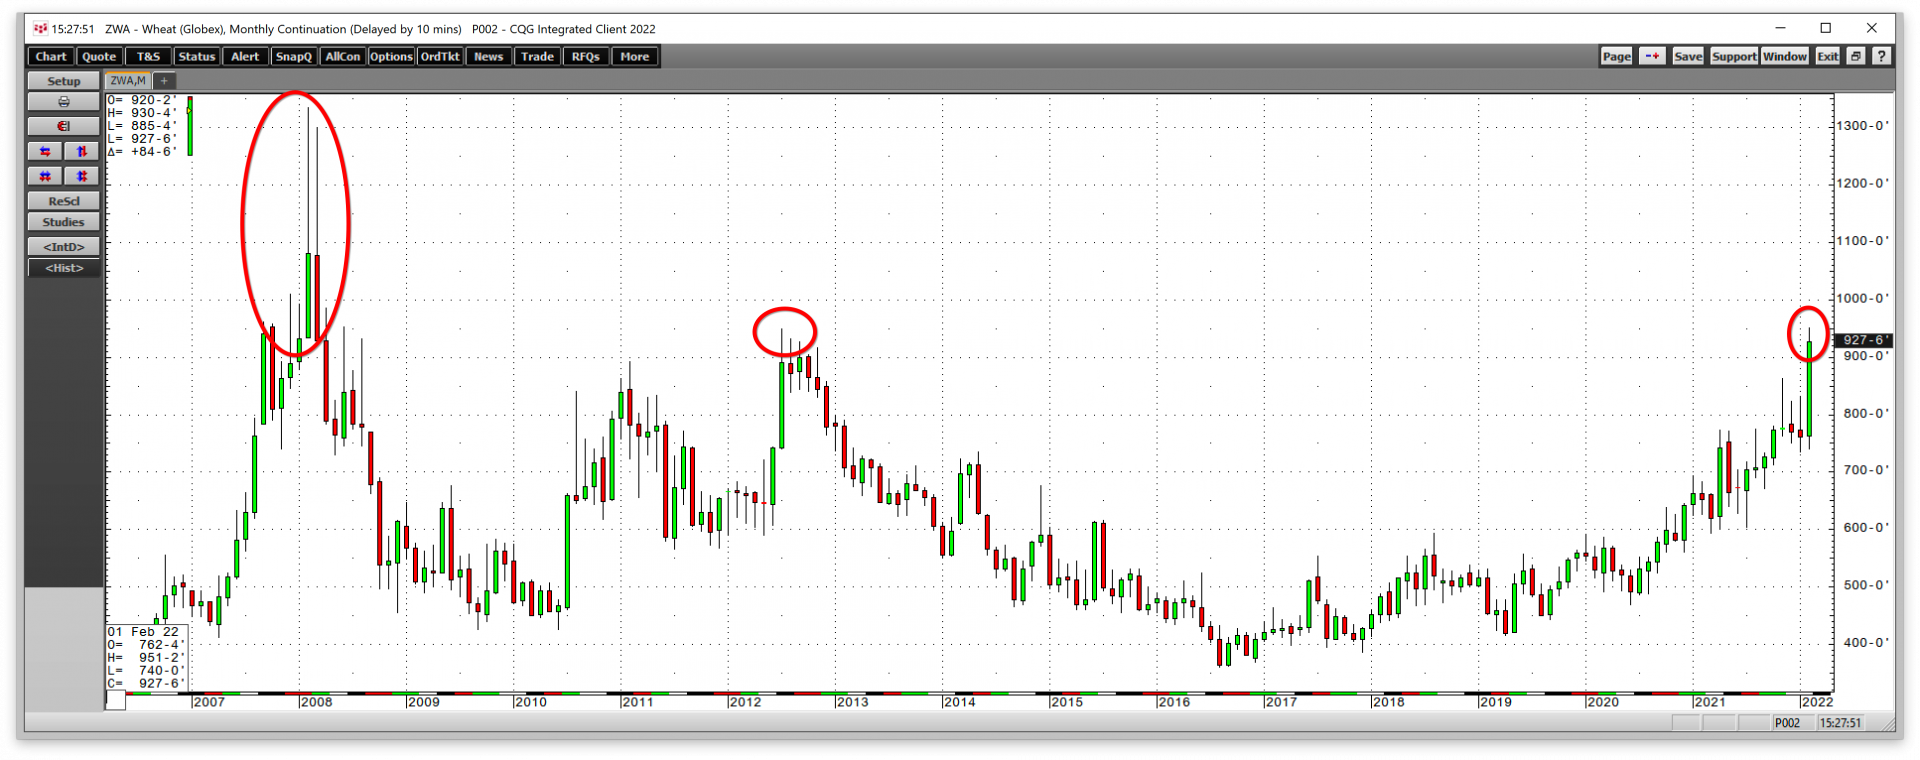
The first major war in Europe since WW II broke out in February with Russia’s invasion of Ukraine. At the beginning of March, the Ukrainian military and citizens continued to hold off the Russian… more
In this second of our series of articles on technical analysis for commercial hedgers we will look at using technical analysis to understand the basis and how it impacts the decision-making… more

There are two types of analysis used by traders to inform their trading decisions. Technical analysis and fundamental analysis. In this course, you will learn about the various patterns,… more