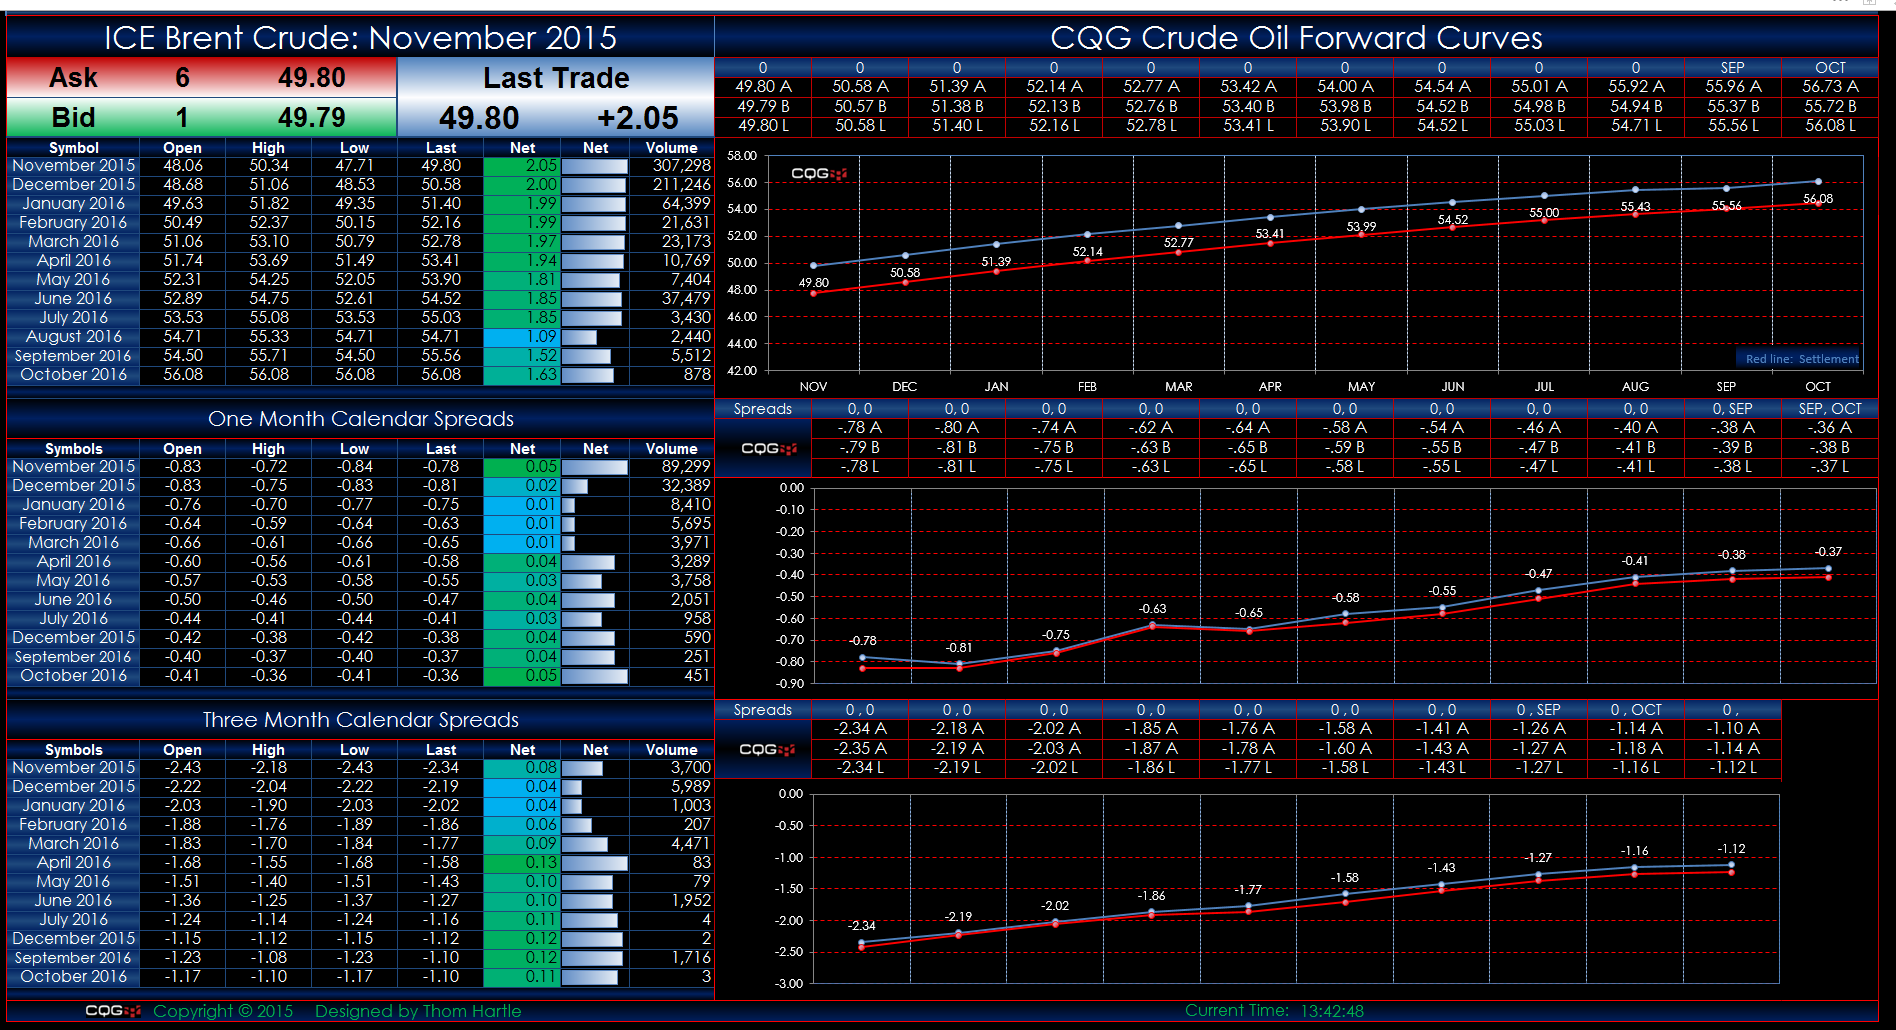
This Microsoft Excel® spreadsheet uses the CQG Toolkit to pull in Brent Crude Oil market data traded on the ICE exchange.
The forward curves display today's data. If the last price is… more
This Microsoft Excel® spreadsheet uses the CQG Toolkit to pull in Brent Crude Oil market data traded on the ICE exchange.
The forward curves display today's data. If the last price is… more
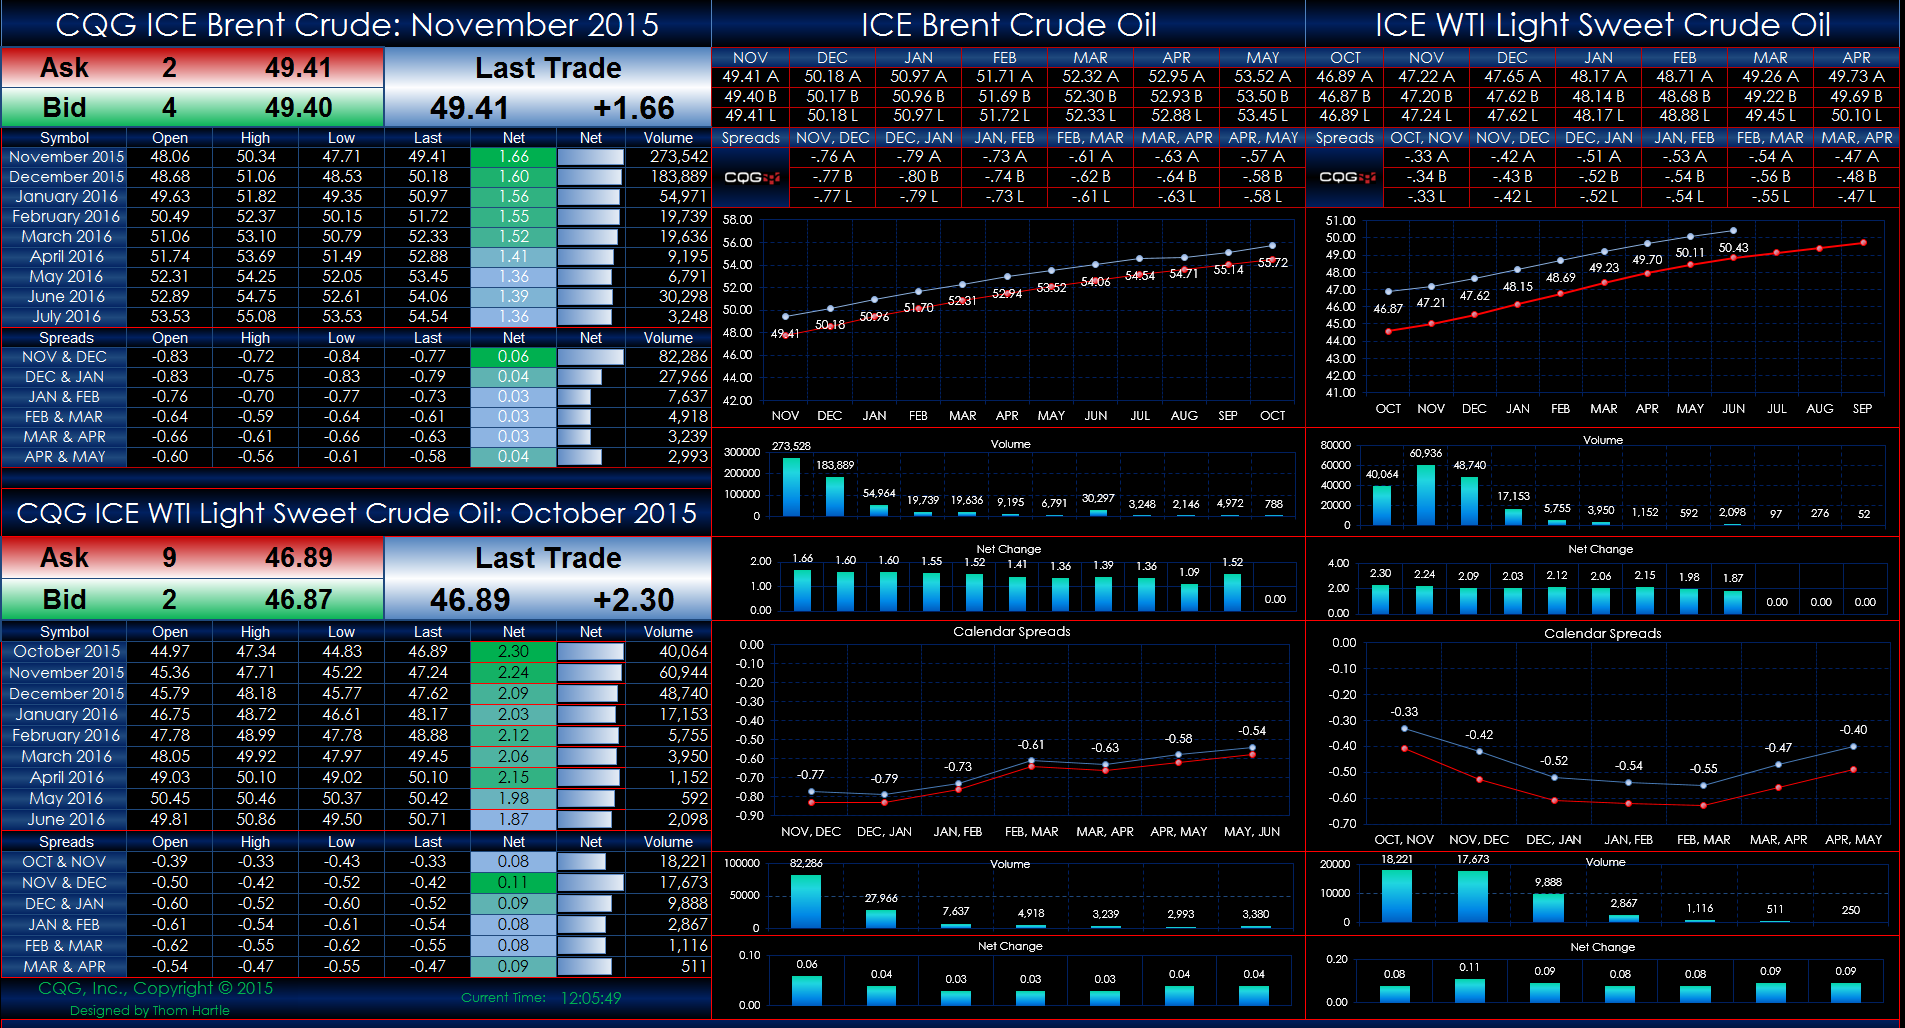
This Microsoft Excel® spreadsheet uses the CQG Toolkit to pull in Brent Crude Oil and WTI Light Sweet Crude Oil market data traded on the ICE exchange.
The forward curves display today's… more
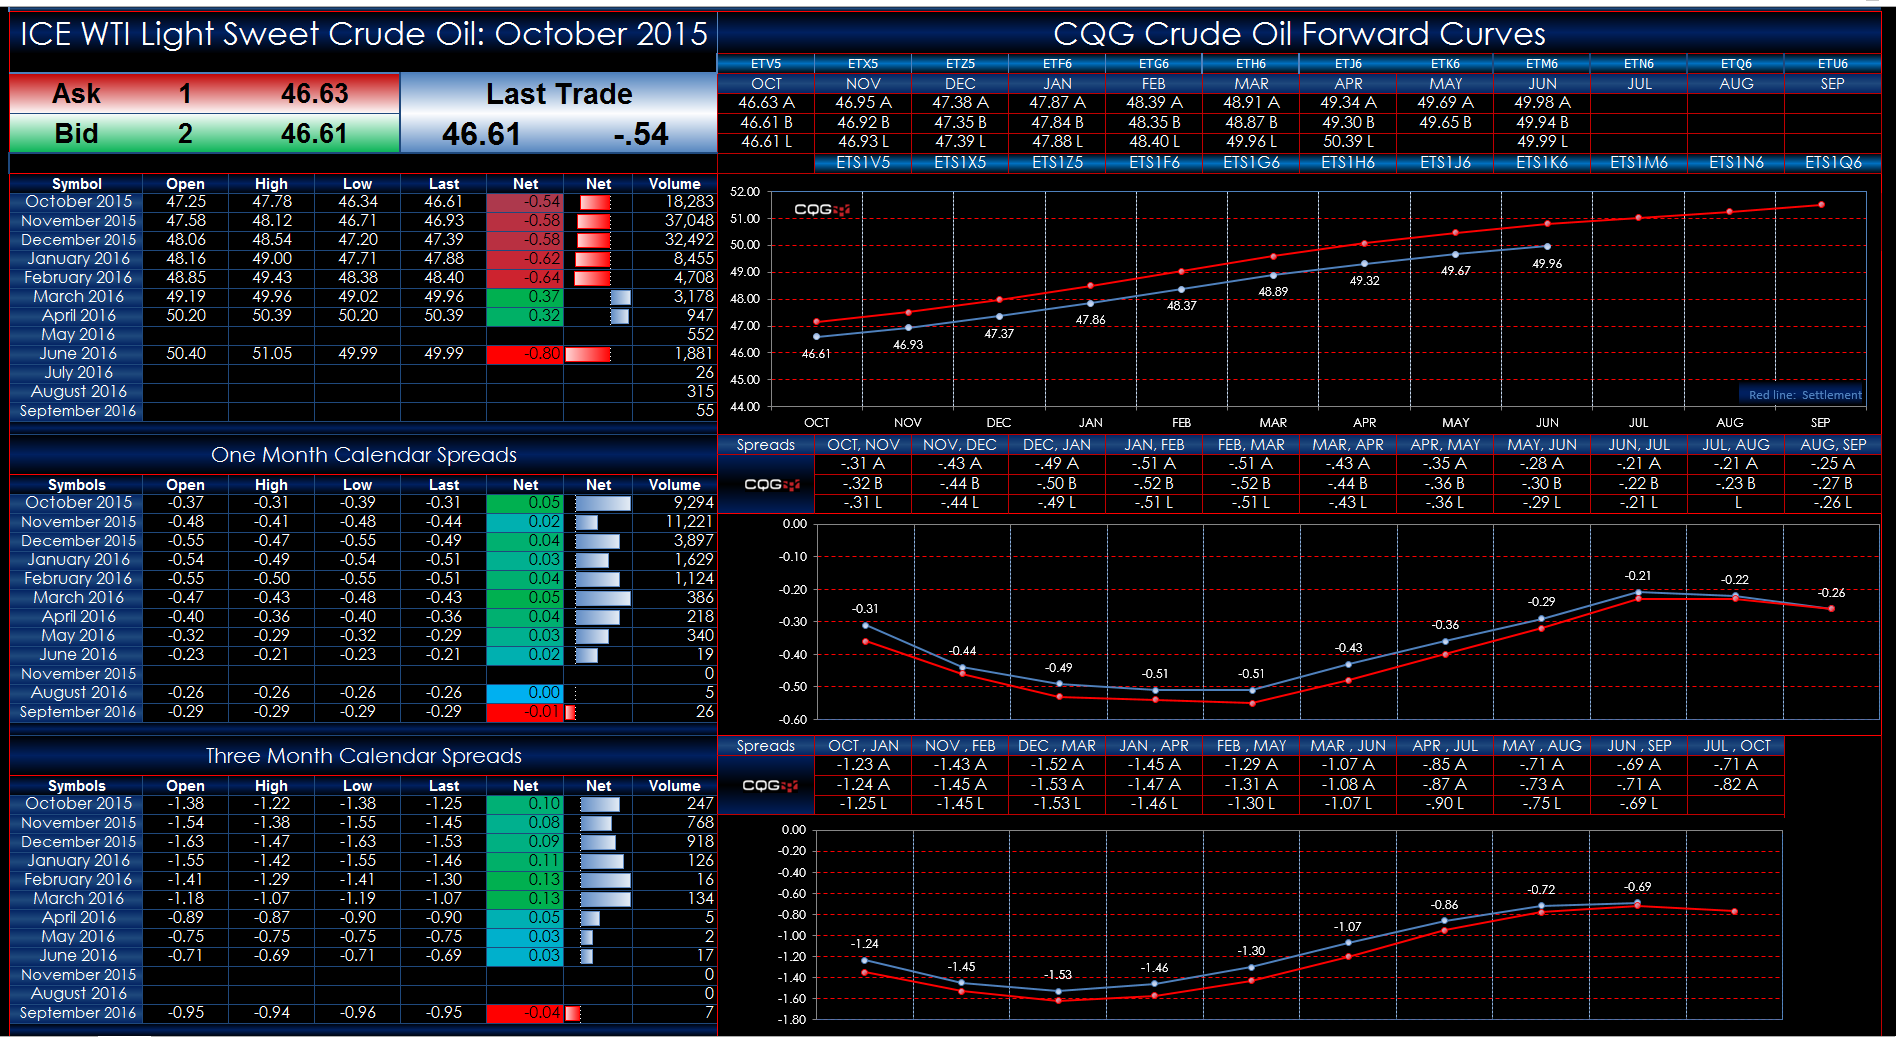
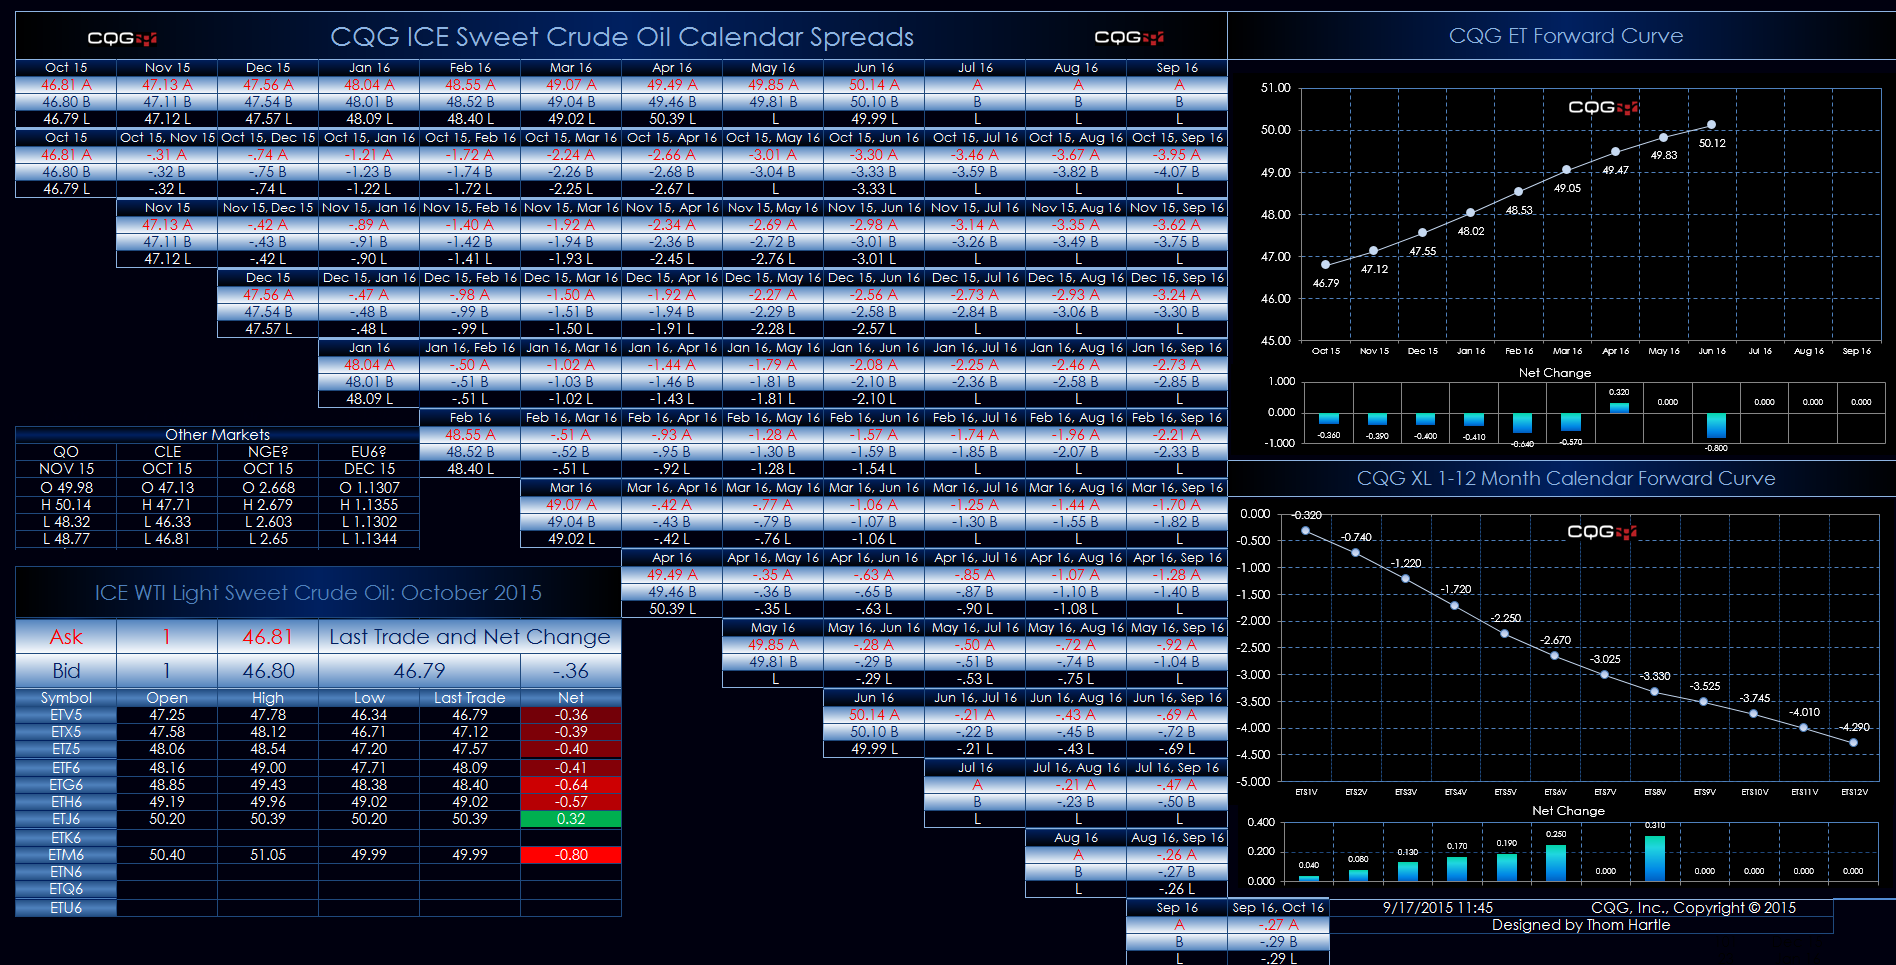
This Microsoft Excel® spreadsheet uses the CQG Toolkit to pull in WTI Light Sweet Crude Oil market data traded on the ICE exchange.
The dashboard uses a matrix-style presentation with the… more
This Microsoft Excel® spreadsheet uses the CQG Toolkit to pull in WTI Light Sweet Crude Oil market data traded on the ICE exchange.
The dashboard uses a matrix-style presentation with the… more
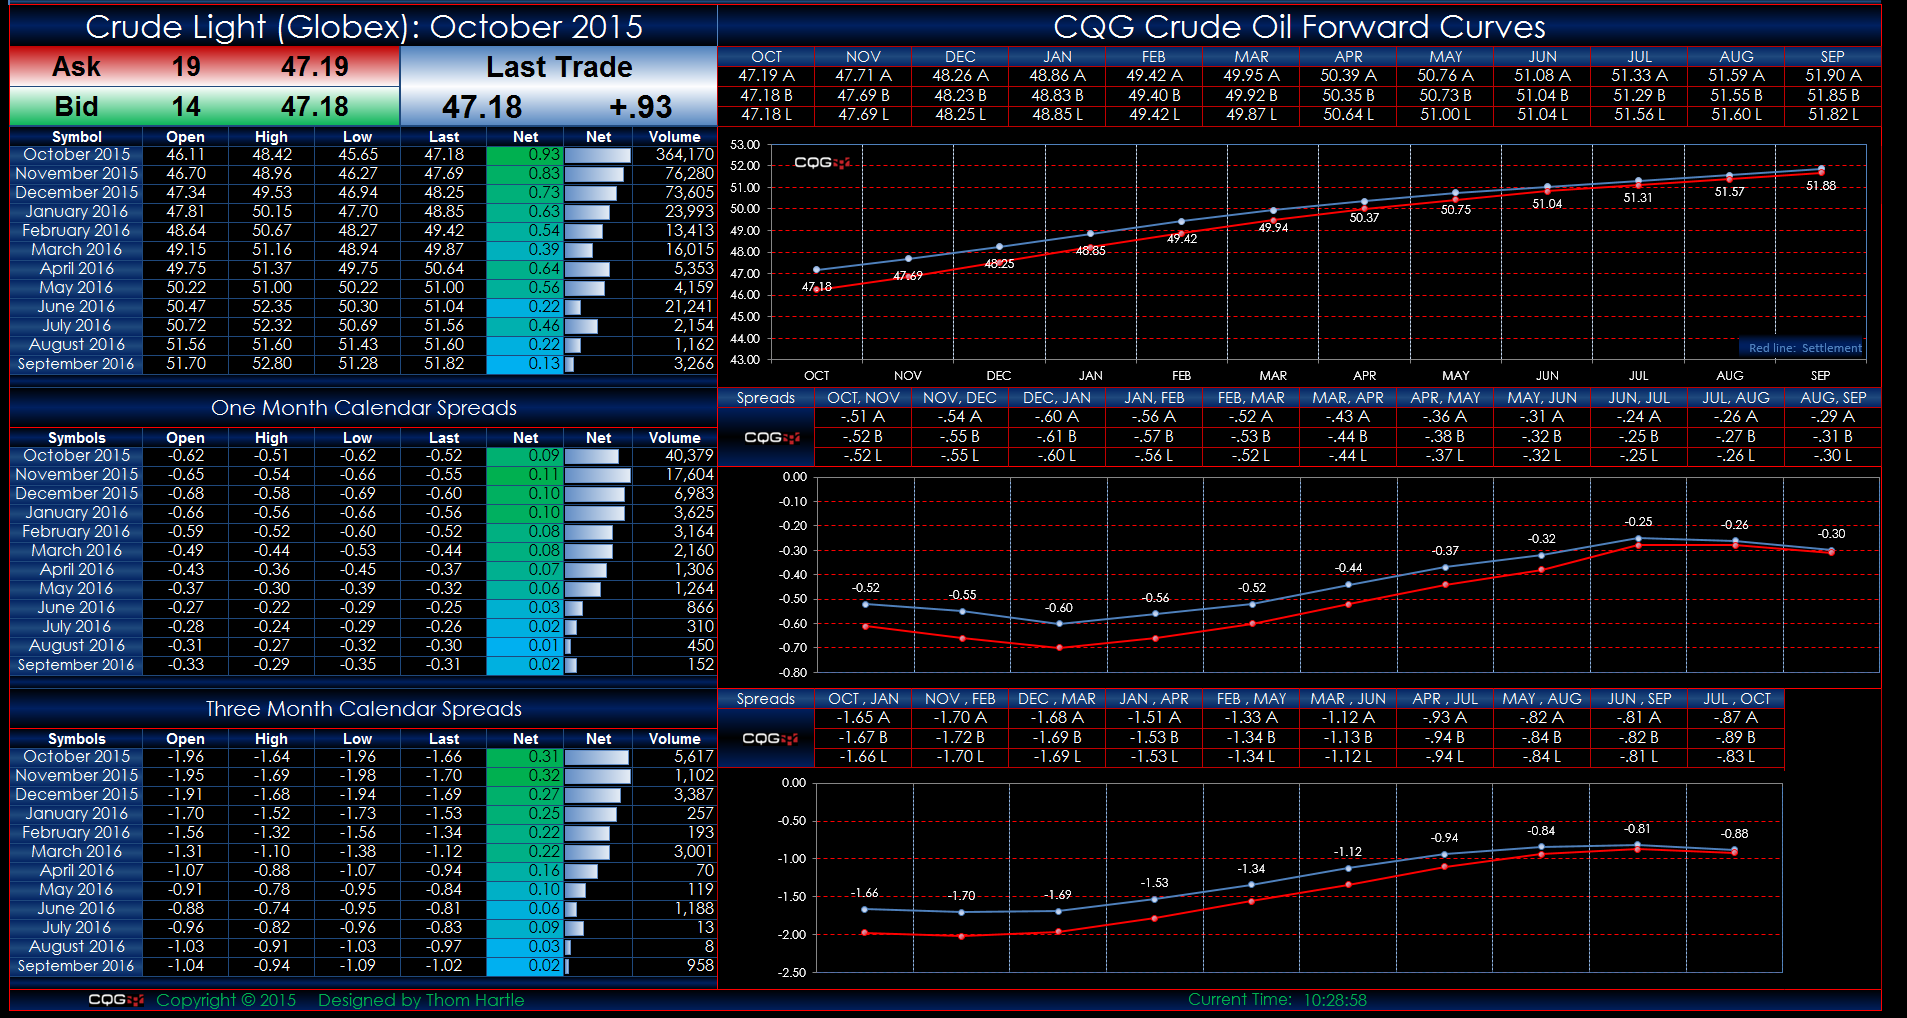
This Microsoft Excel® spreadsheet uses the CQG Toolkit to pull in market data for crude oil traded on CME Globex.
Twelve months of outrights, one-month, and three-month calendar spreads are… more
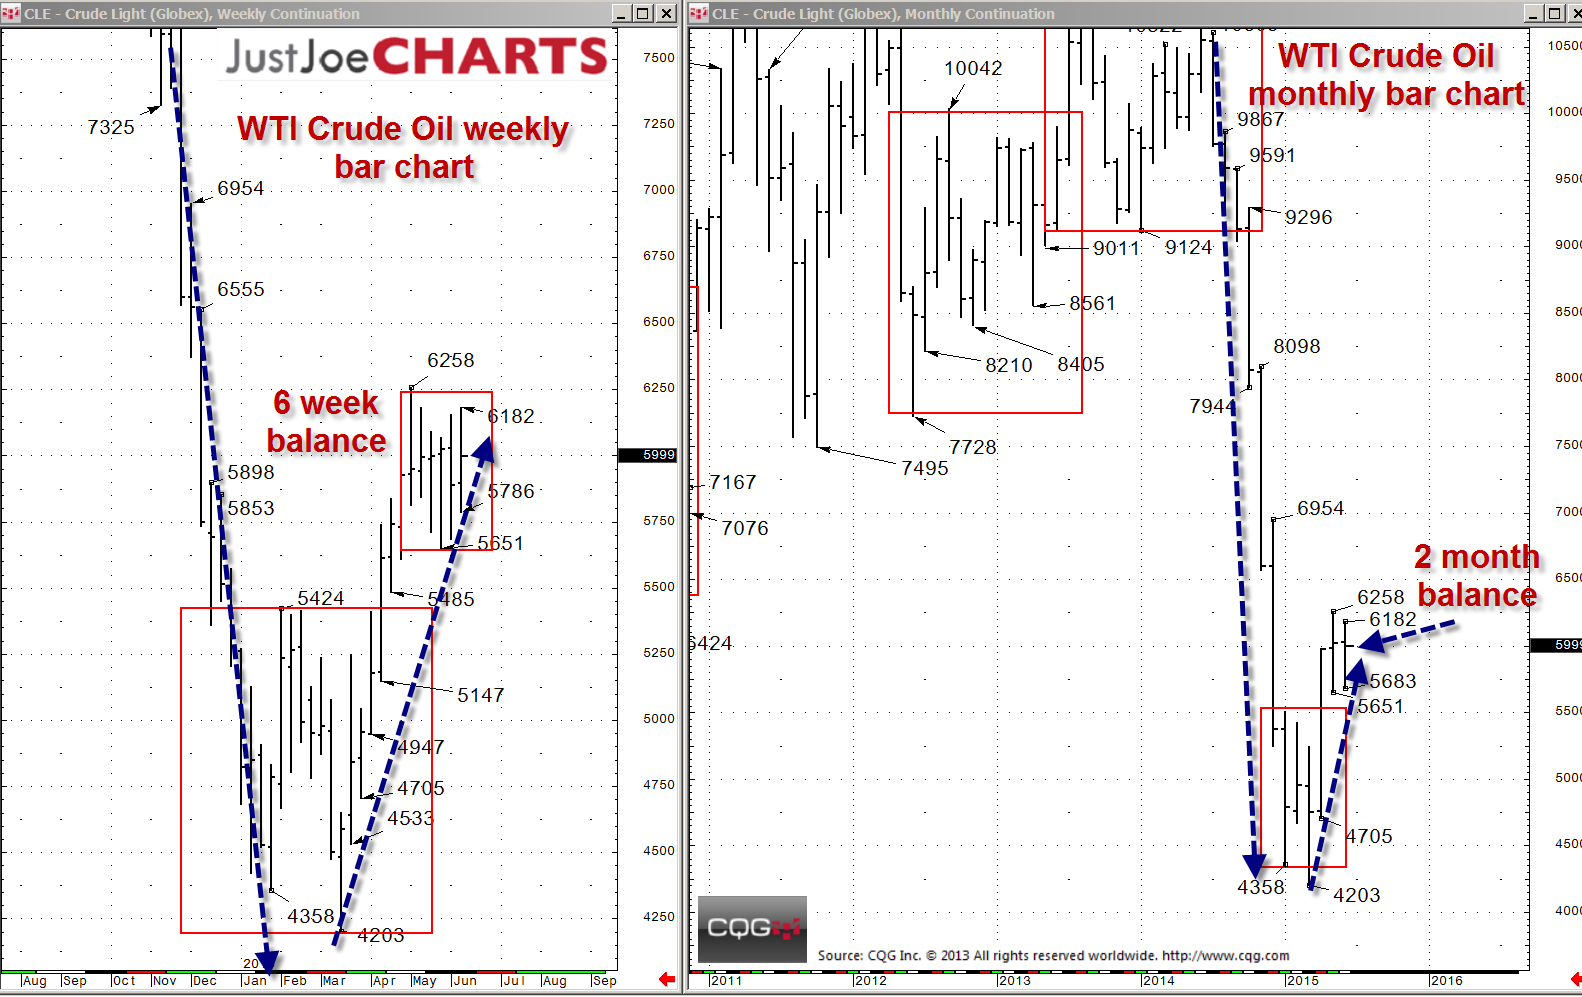
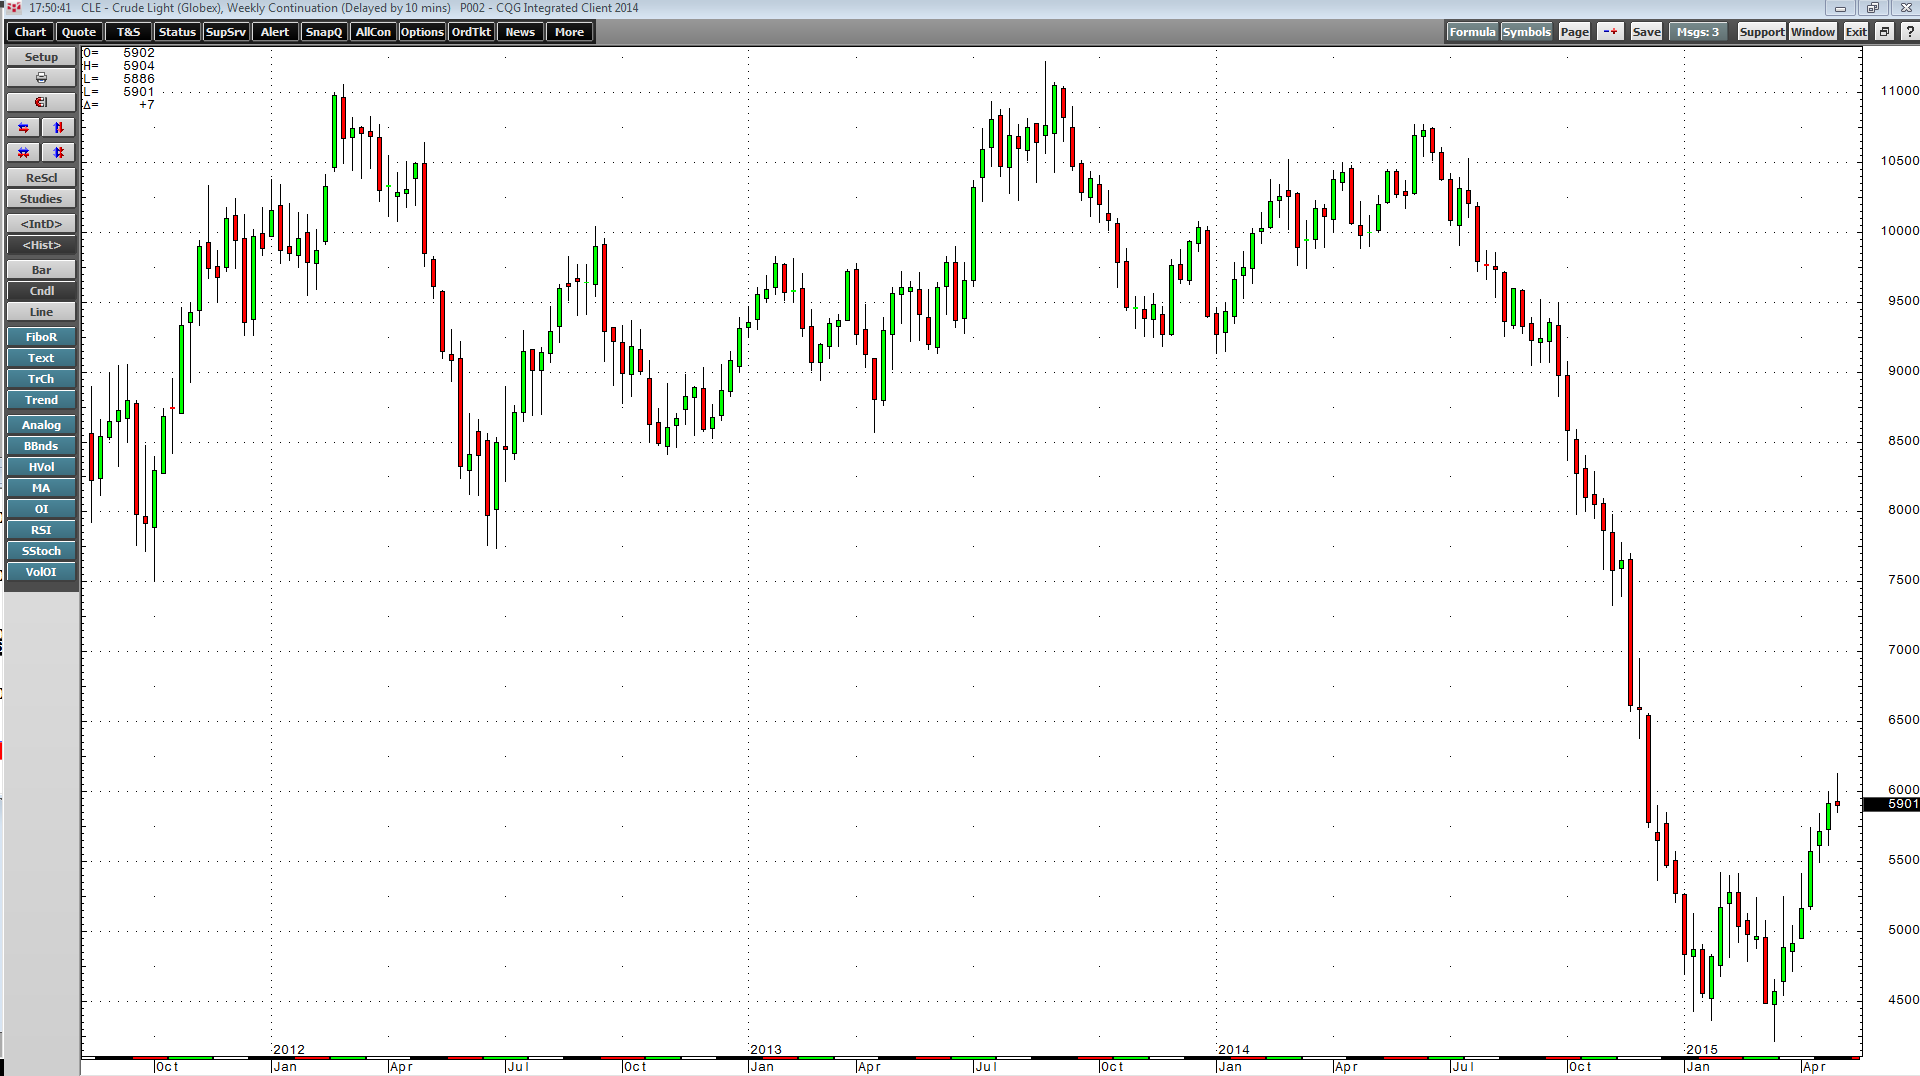
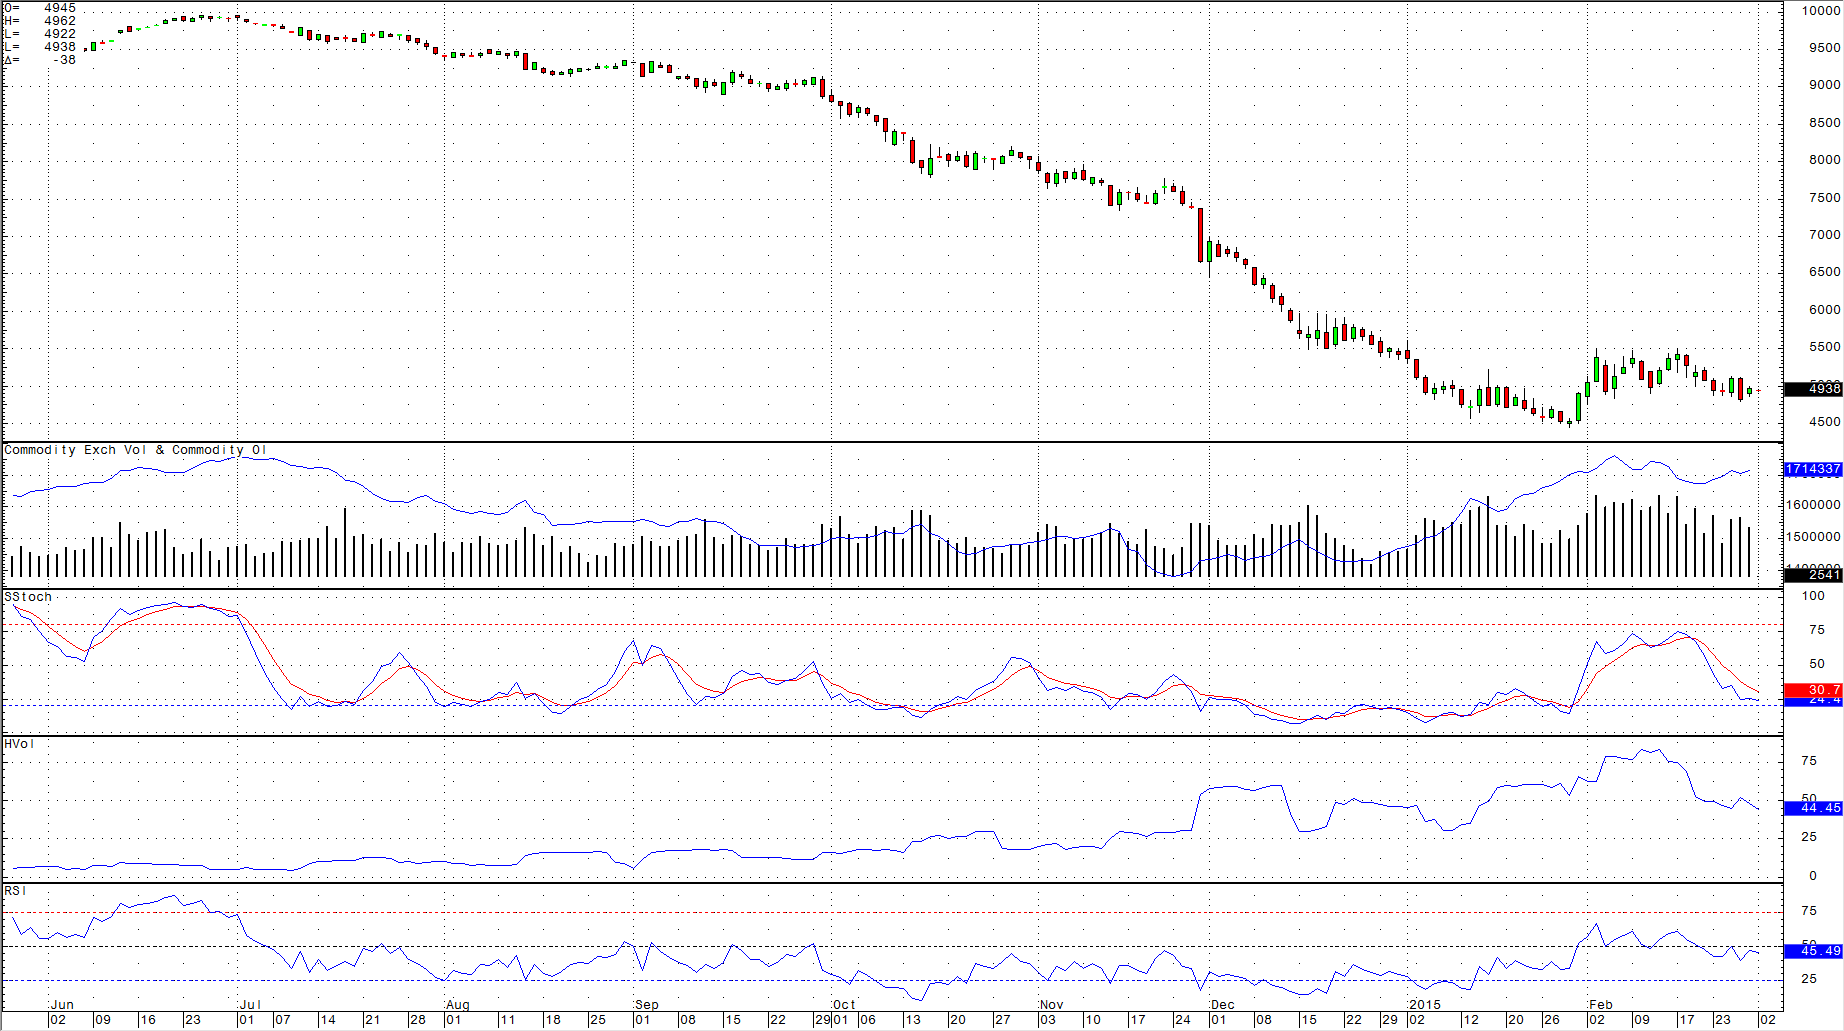
In the summer of 2014, Crude began a seven-month, over $50 decline to about $42. However over the past four months, it has slowly traded back above $60, settling near that price on Friday, June 12… more
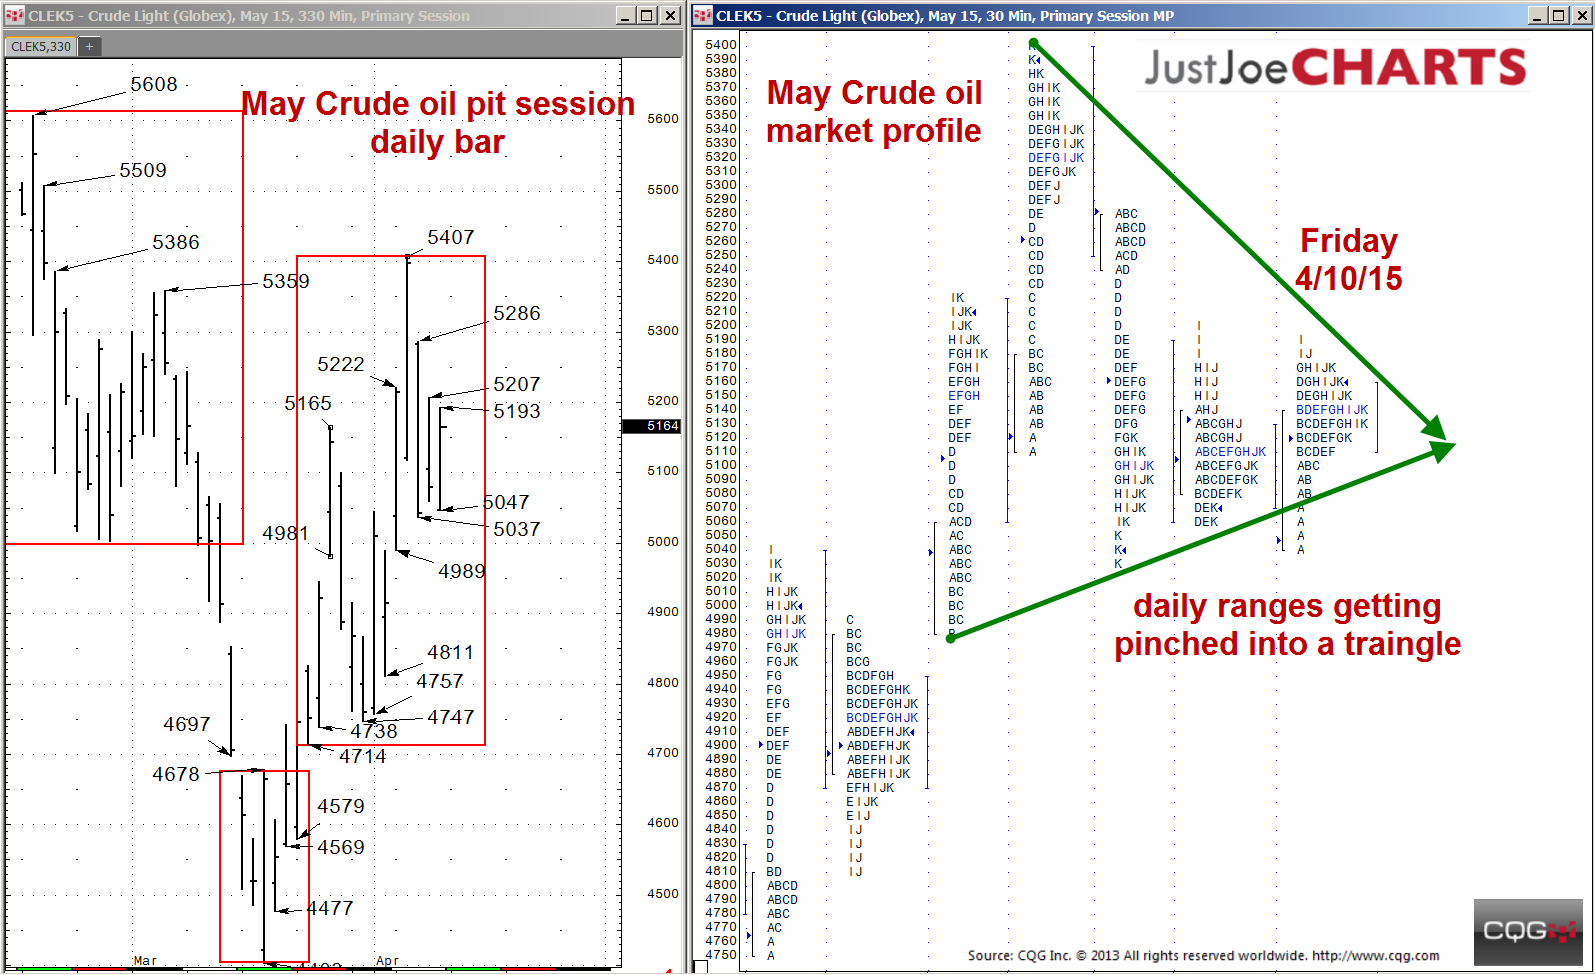
Over the past three weeks, May crude oil has been trading within a 4714-to-5407 balance range. However, over the past five days, the daily ranges have been gradually shrinking, essentially getting… more
The price of active month NYMEX crude oil is what everyone is focusing on these days, but that price is only a view from thirty thousand feet of what is actually going on in the global oil patch.… more
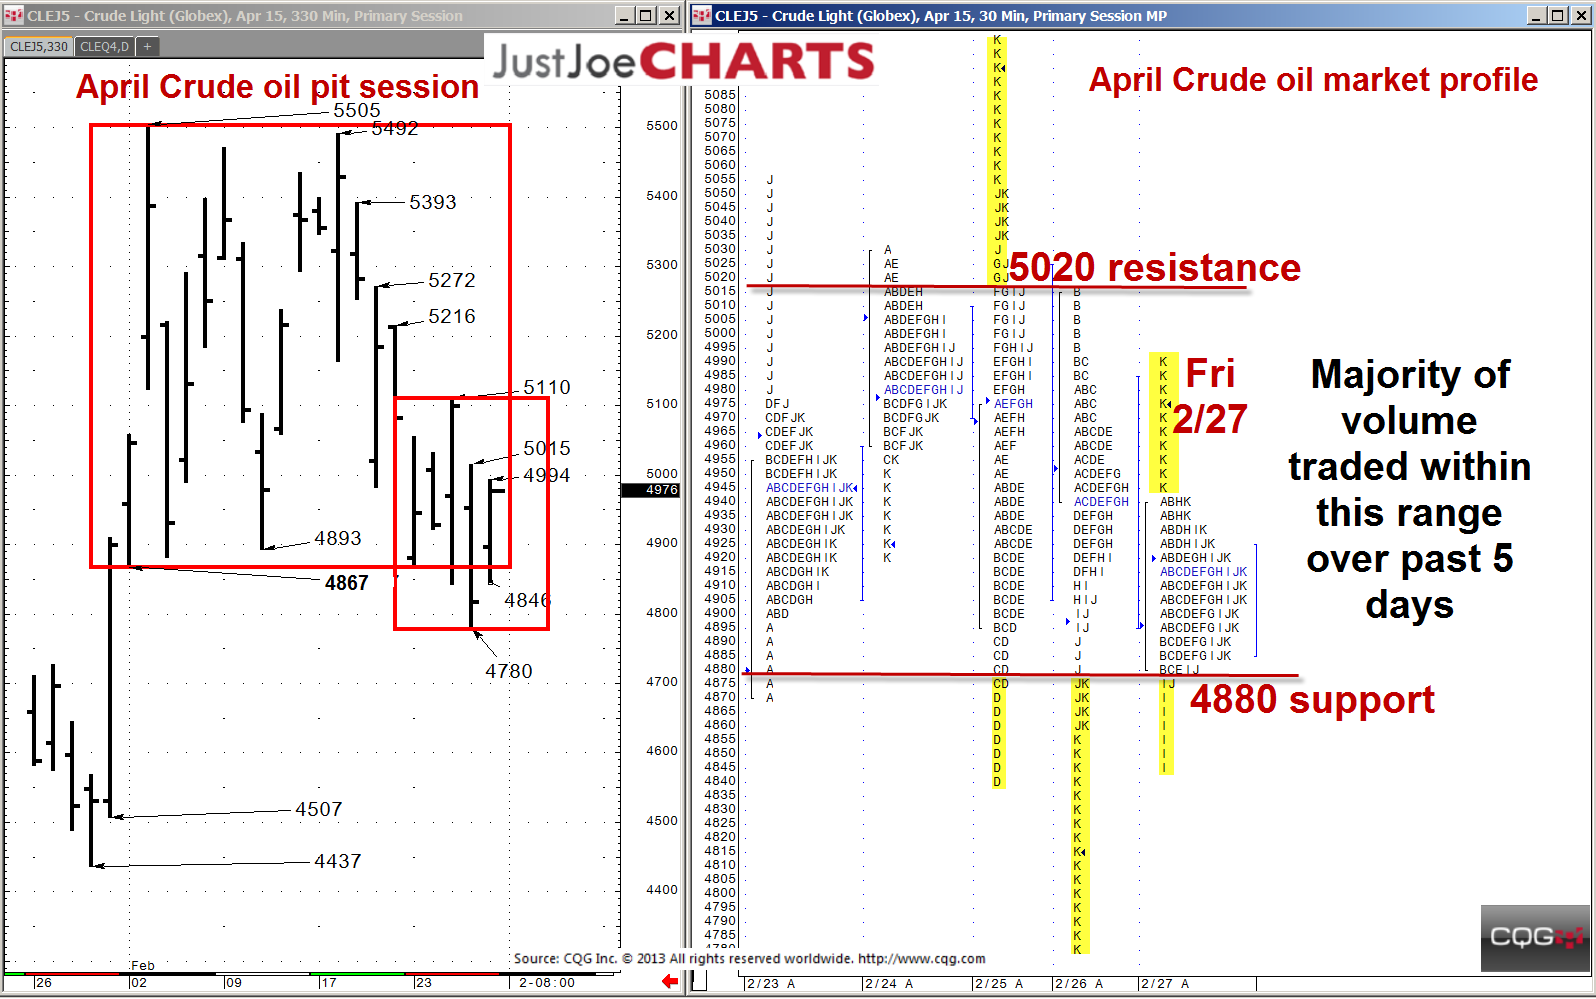
Over the past three weeks, April crude oil found a rotational balance range of 4867-to-5505, traveling from the bottom to the top and back to the bottom of that range a few times. However, three… more