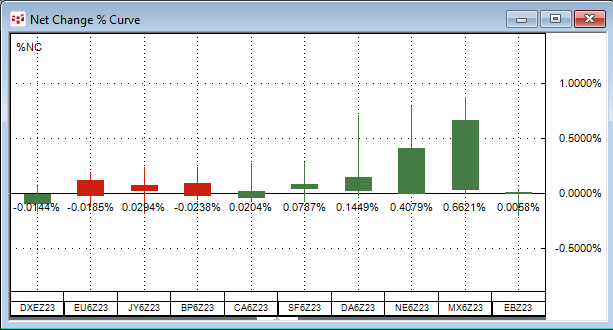
The Net Change Curve chart displays a collection of symbols’ daily net price change or daily net percentage change making it easy to compare on a relative basis each market’s current session’s… more
Equities
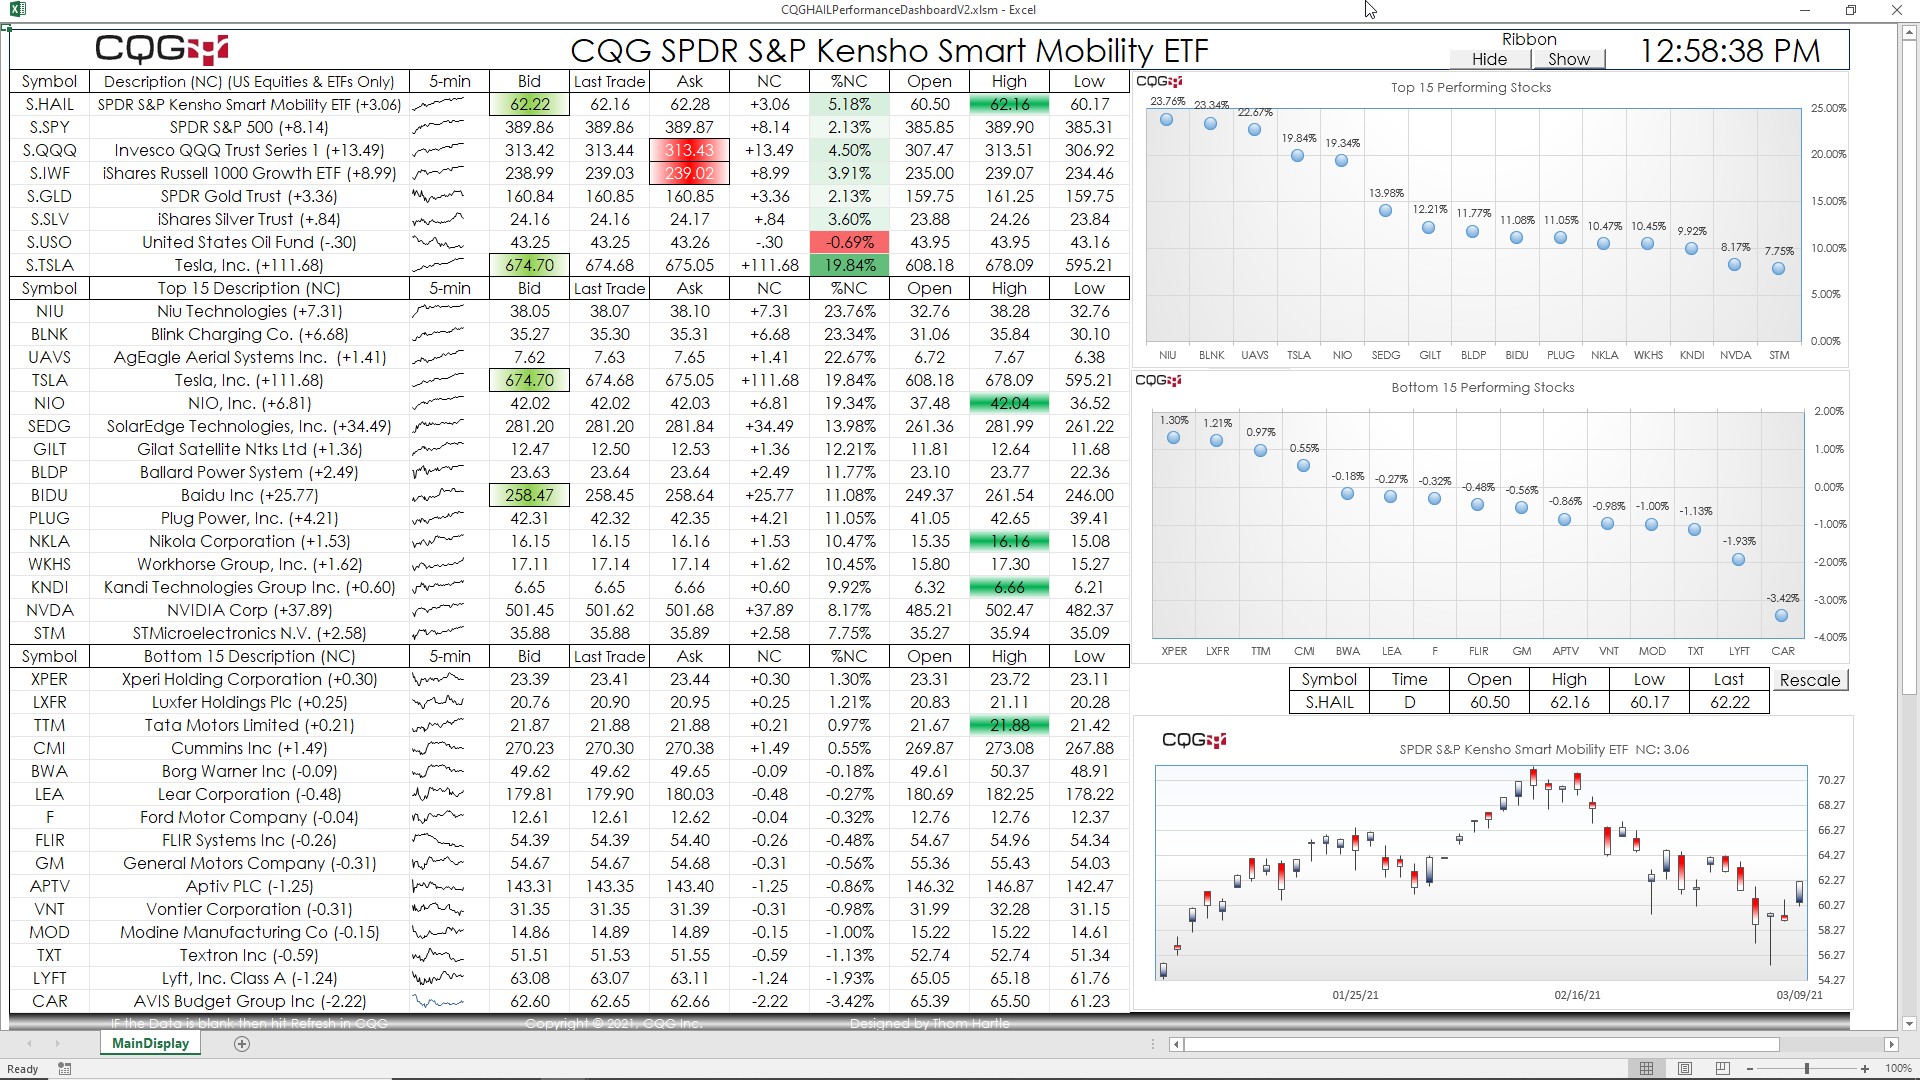
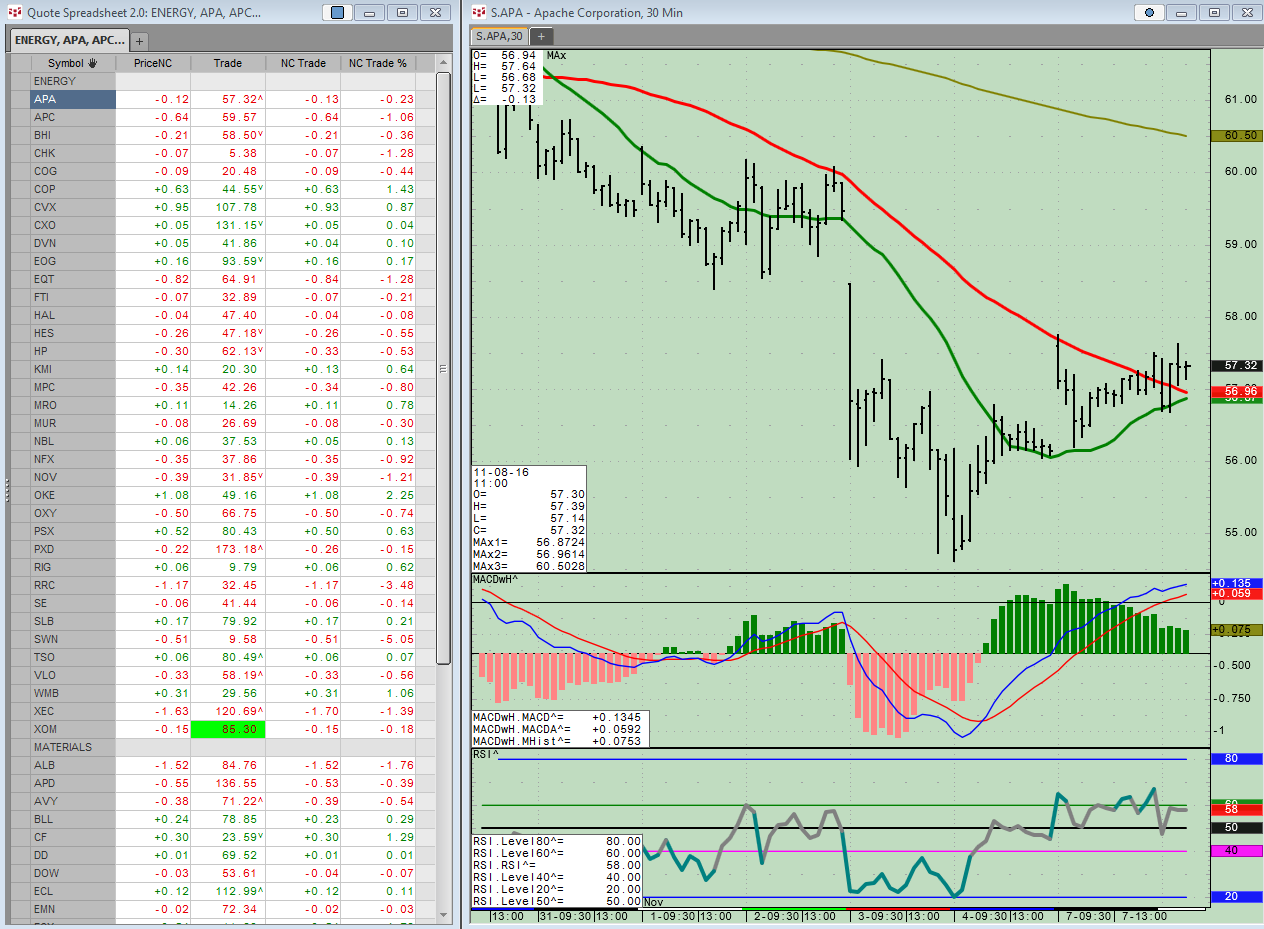
This Microsoft® Excel Dashboard comes frontloaded with 30 Sector and Industry symbols. However, you can enter in whatever symbols you like using the Symbols tab. The long description of the symbol… more
Traders and investors have a multitude of opportunities for theme investing. That is, ETFs are structured to invest in companies that are part of an industry, such as Biotech, Internet, Aerospace… more
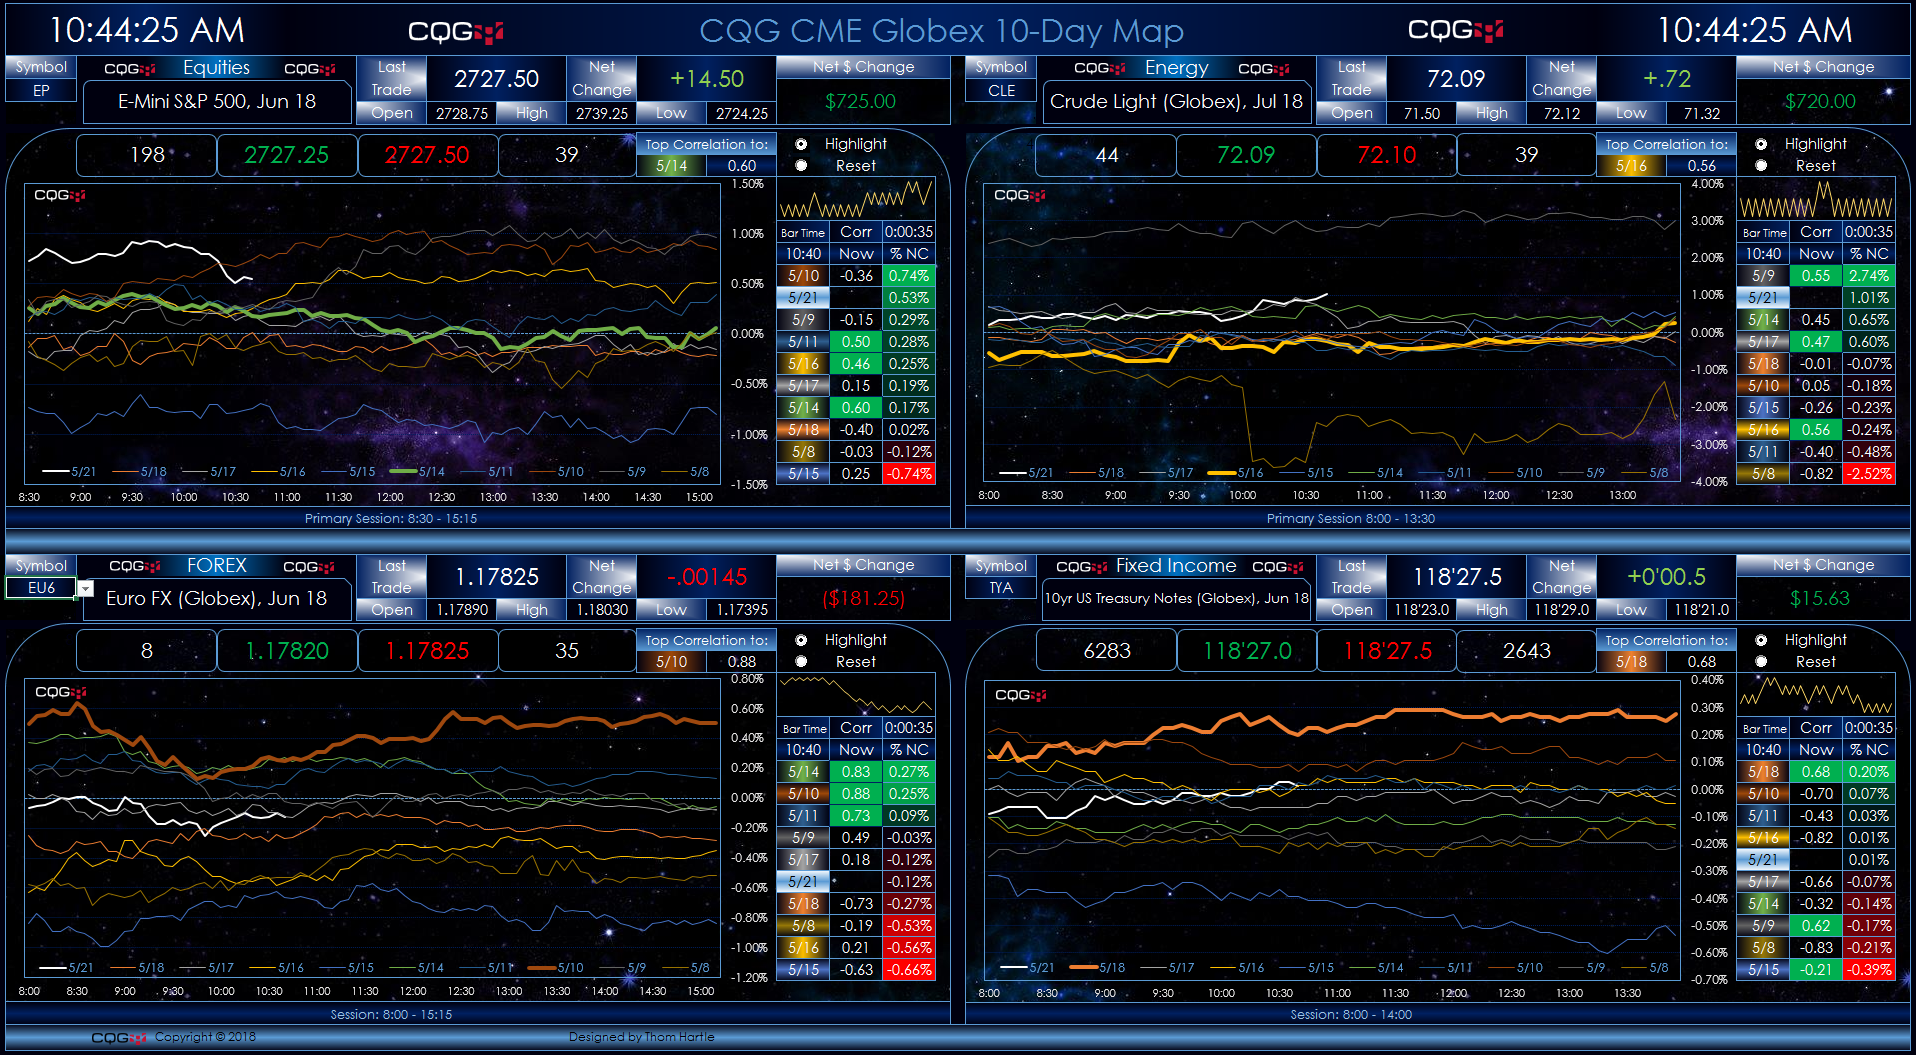
This is an updated post detailing new features in the original dashboards from a previous post. The three downloadable Microsoft Excel® dashboards present a unique view of four markets. Each… more
The component pac at the end of this article contains holdings or components of eleven SPDR ETF portfolios. You can use a portfolio to create a quote page… more
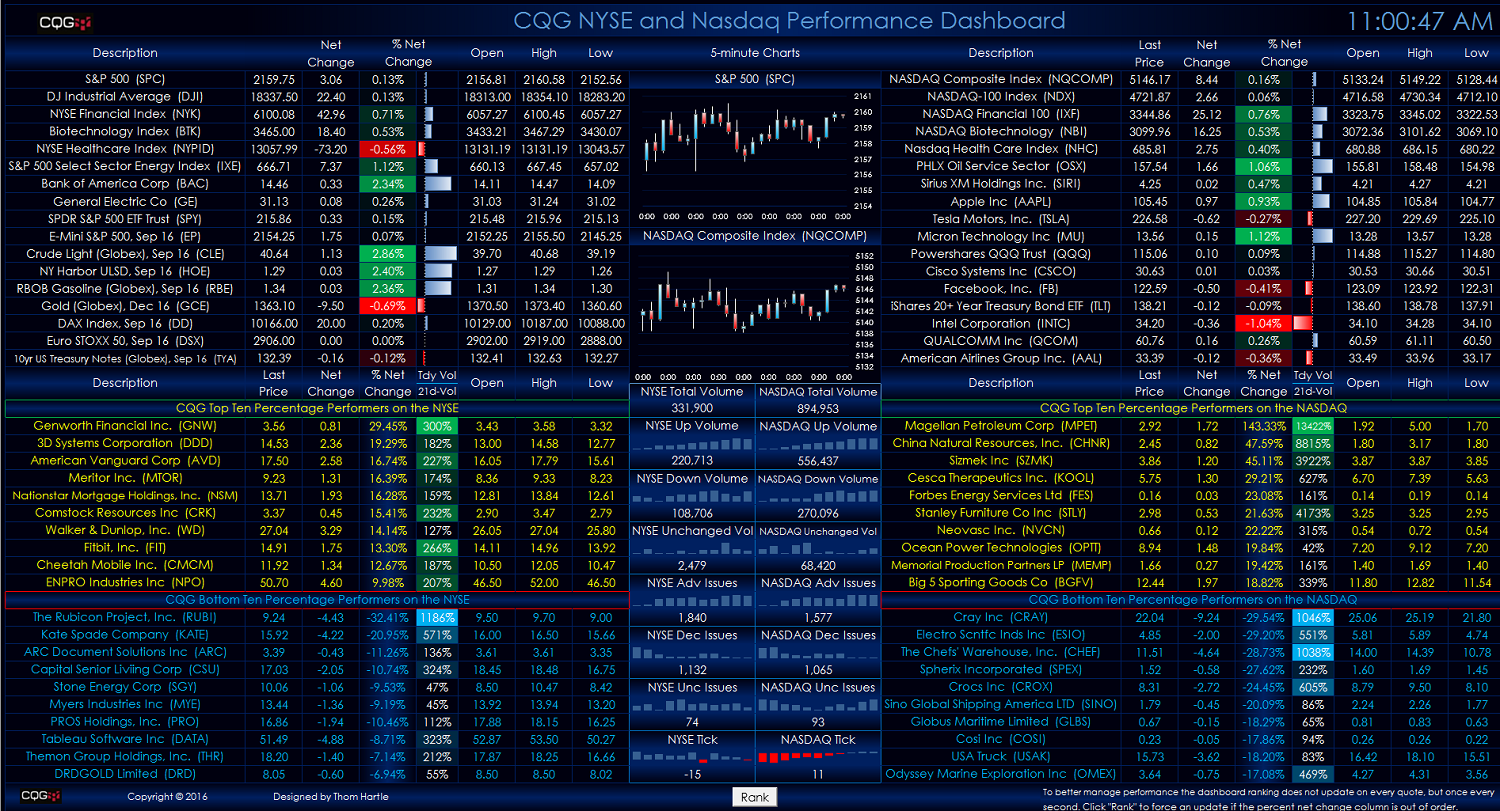
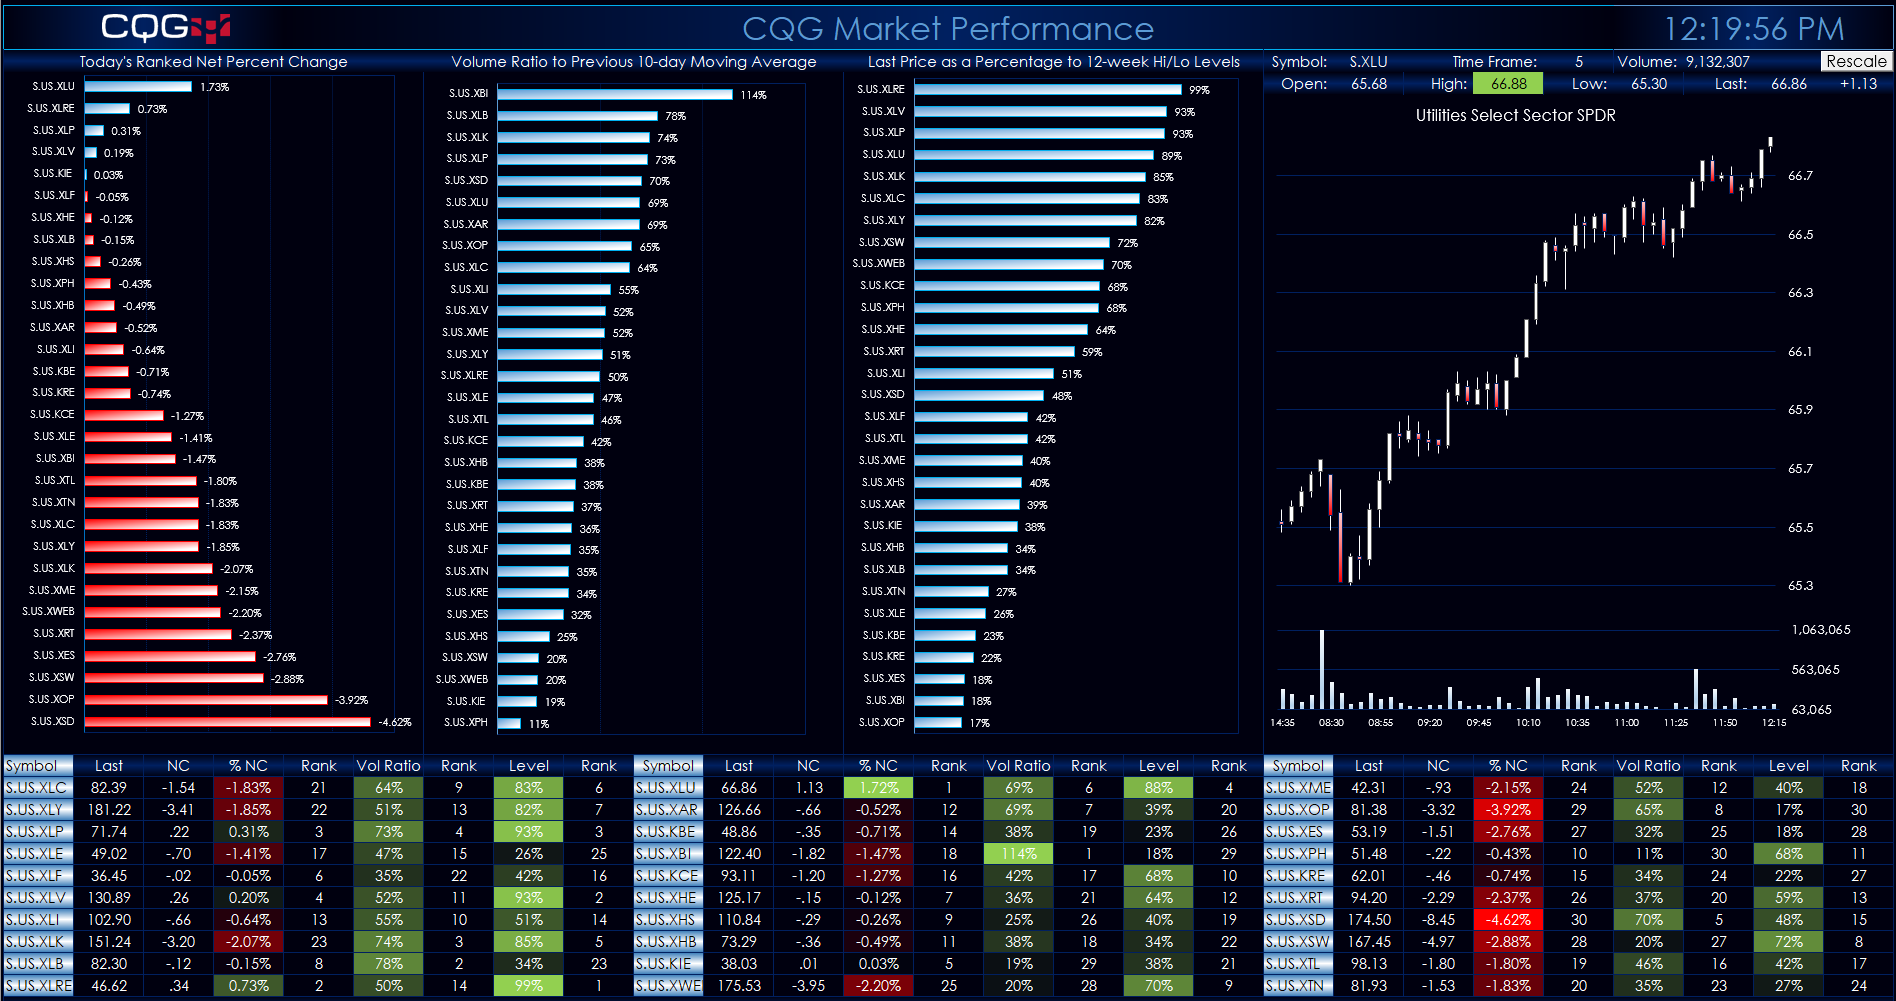
This Microsoft Excel® dashboard offers a two-window view for tracking market performance (You have to enable macros when this dashboard is first opened.) The top half displays market data using… more

CQG customers can now trade equities directly from CQG platforms and APIs Chicago
CQG announced today the launch of a global equities partnership with Ditto Trade, a next generation robo-… more

This Microsoft Excel® dashboard offers an automatic performance ranking of exchange-traded funds (ETFs) that is focused on equity performance by country. This dashboard requires the NYSE… more