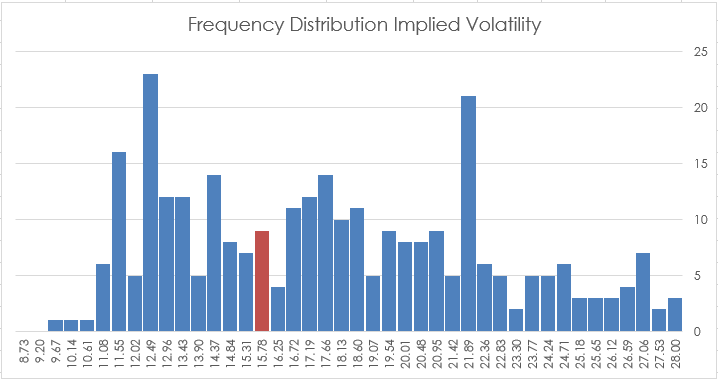
CQG IC and QTrader offer two studies that track volatility: Implied Volatility and Historical Volatility. This post details each study and provides an Excel spreadsheet for tracking the two.
… moreFrequency Distribution
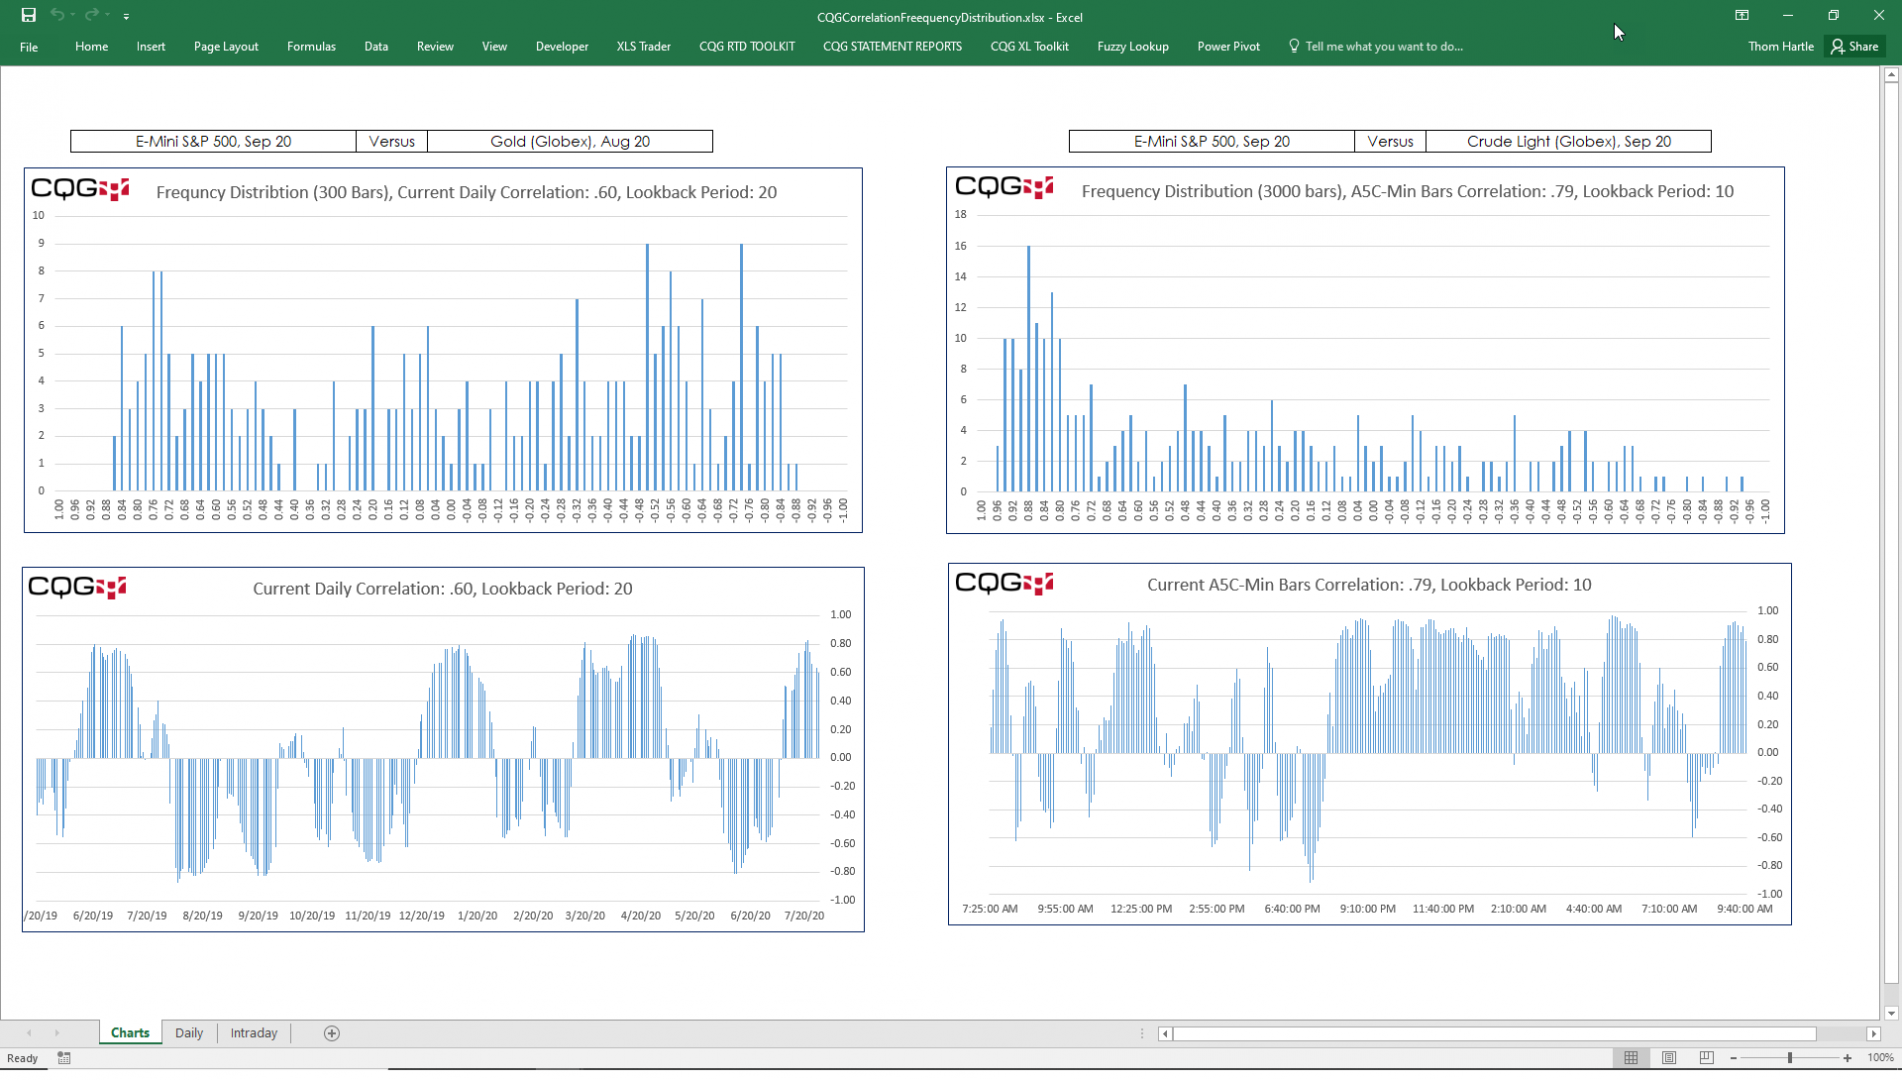
Imagine that today the 20 day correlation between the E-mini S&P 500 futures contract (symbol: EP) and the Crude Oil Contract (symbol: CLE) is 0.82. Now, is that a typical value or an unusual… more
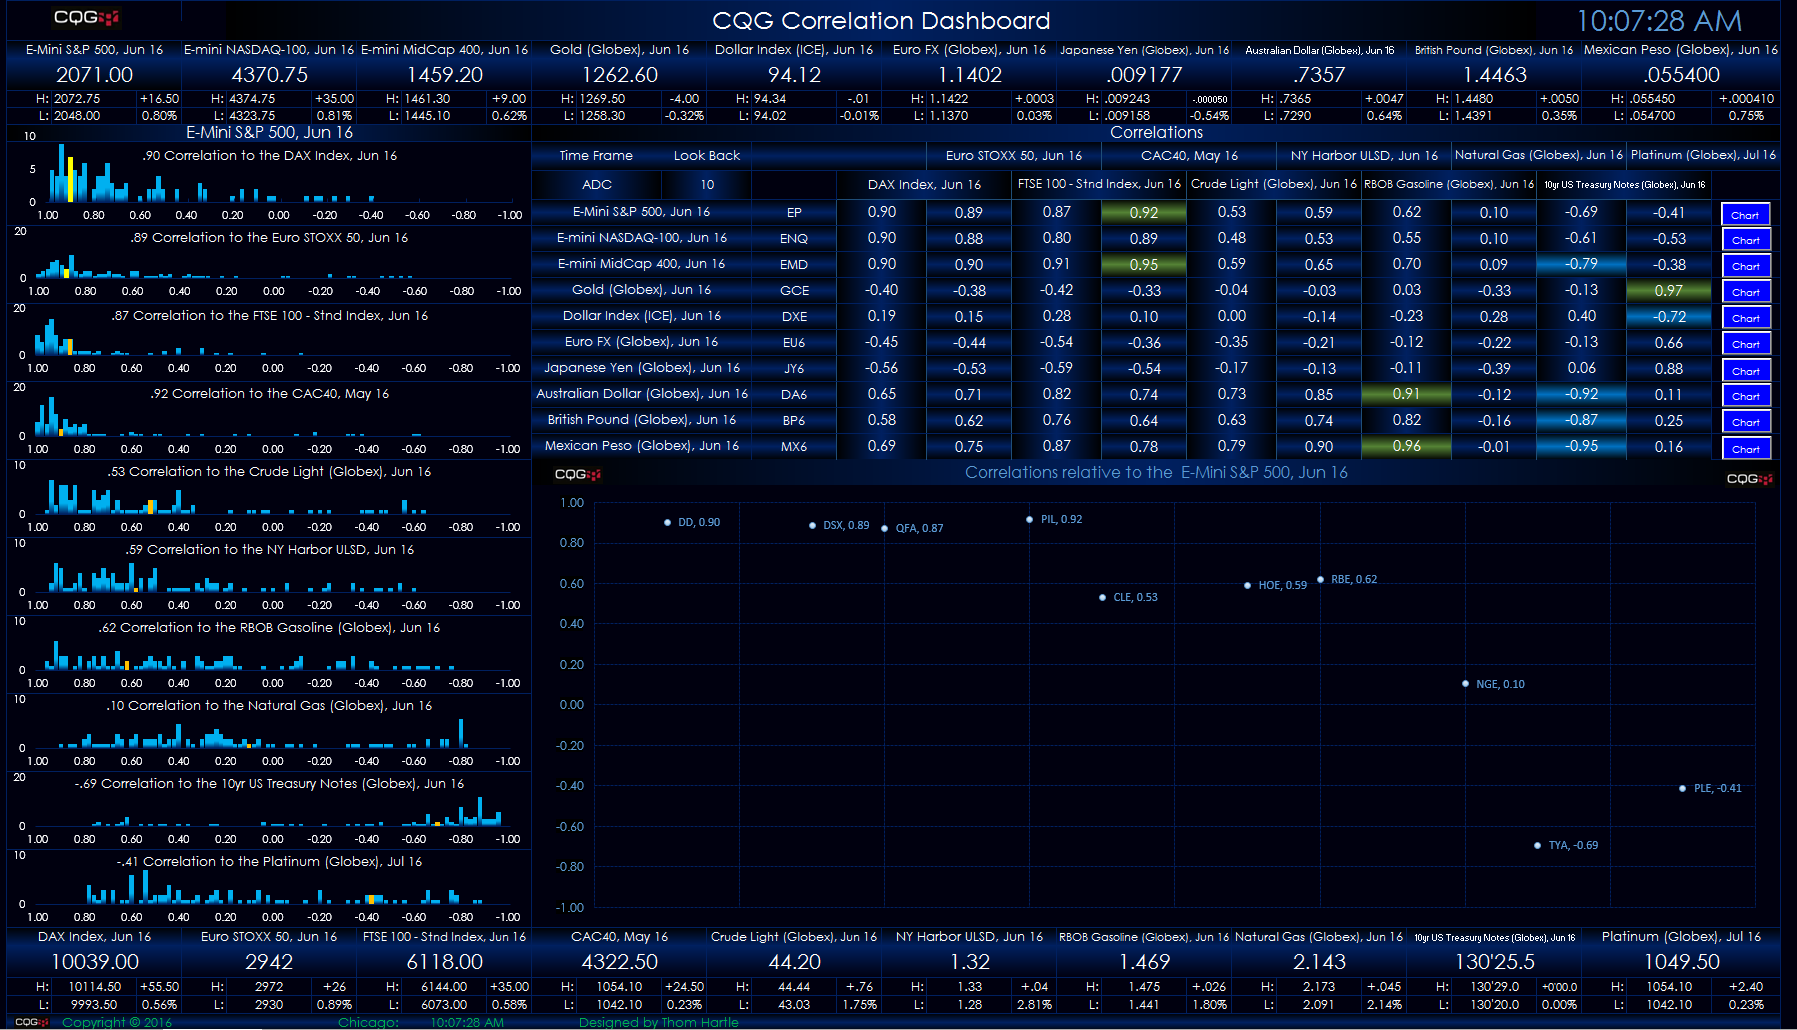
This Microsoft Excel® spreadsheet presents a ten-by-ten correlation matrix.
There is a symbols tab where you enter symbols and price formatting, such as two decimal places, etc. The… more