CQG One carries on the tradition of CQG product offerings with best-in-class market data visualization with the introduction in CQG One version 9.1.45025 the CQG Profile chart type and the CP… more
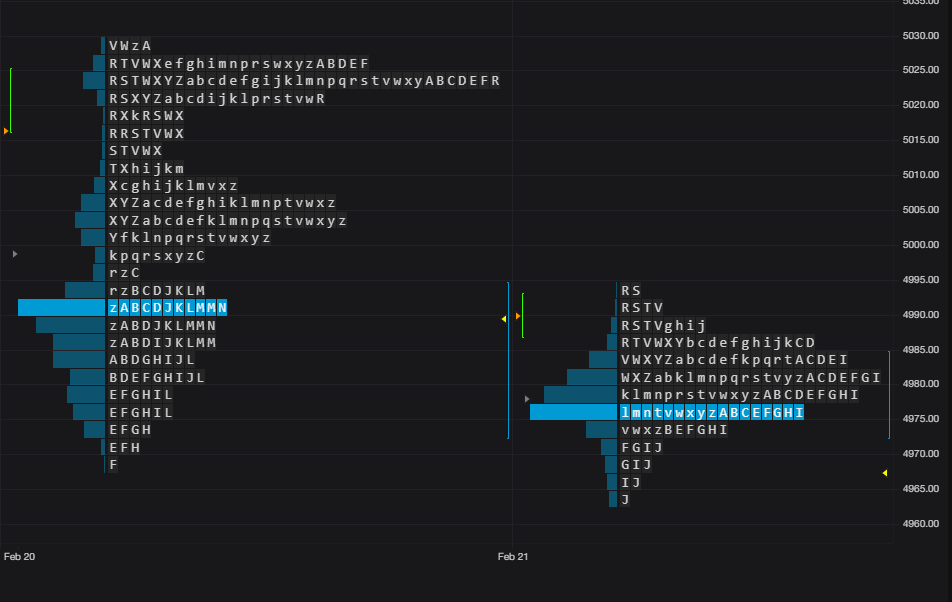
Market Profile
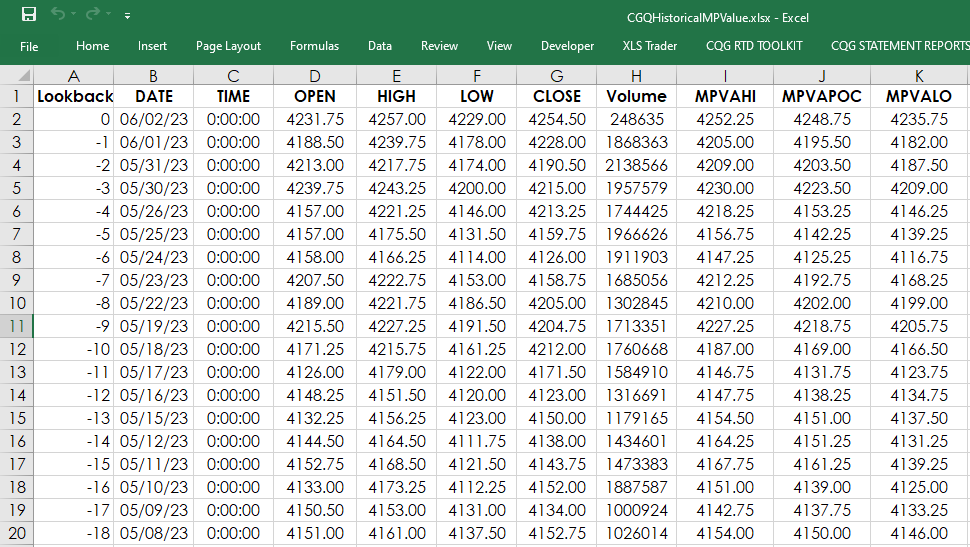
This study calculates the Market Profile’s value area and point of control (POC). First, a brief overview of the Market Profile chart then the Excel RTD formulas for MPVAPOC, MPVAHigh and the… more
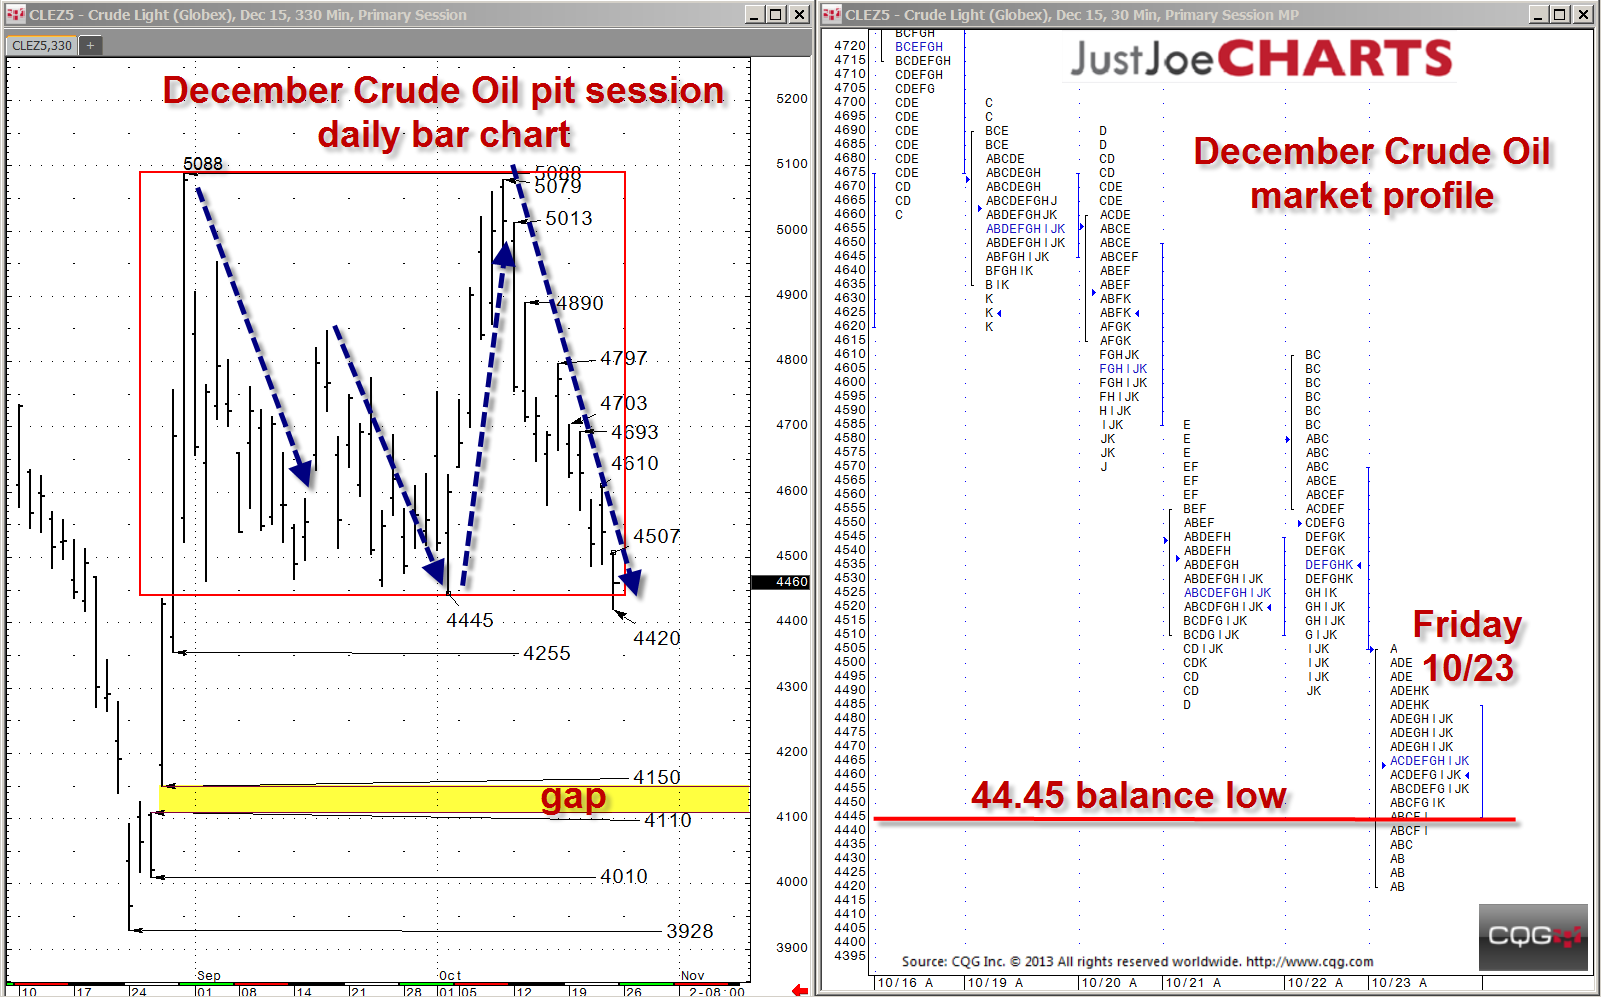
During the past two months, December crude oil has been contained within a 44.45 to 50.88 range. About two weeks ago, the market came within ten ticks of the 50.88 balance high, but failed to take… more
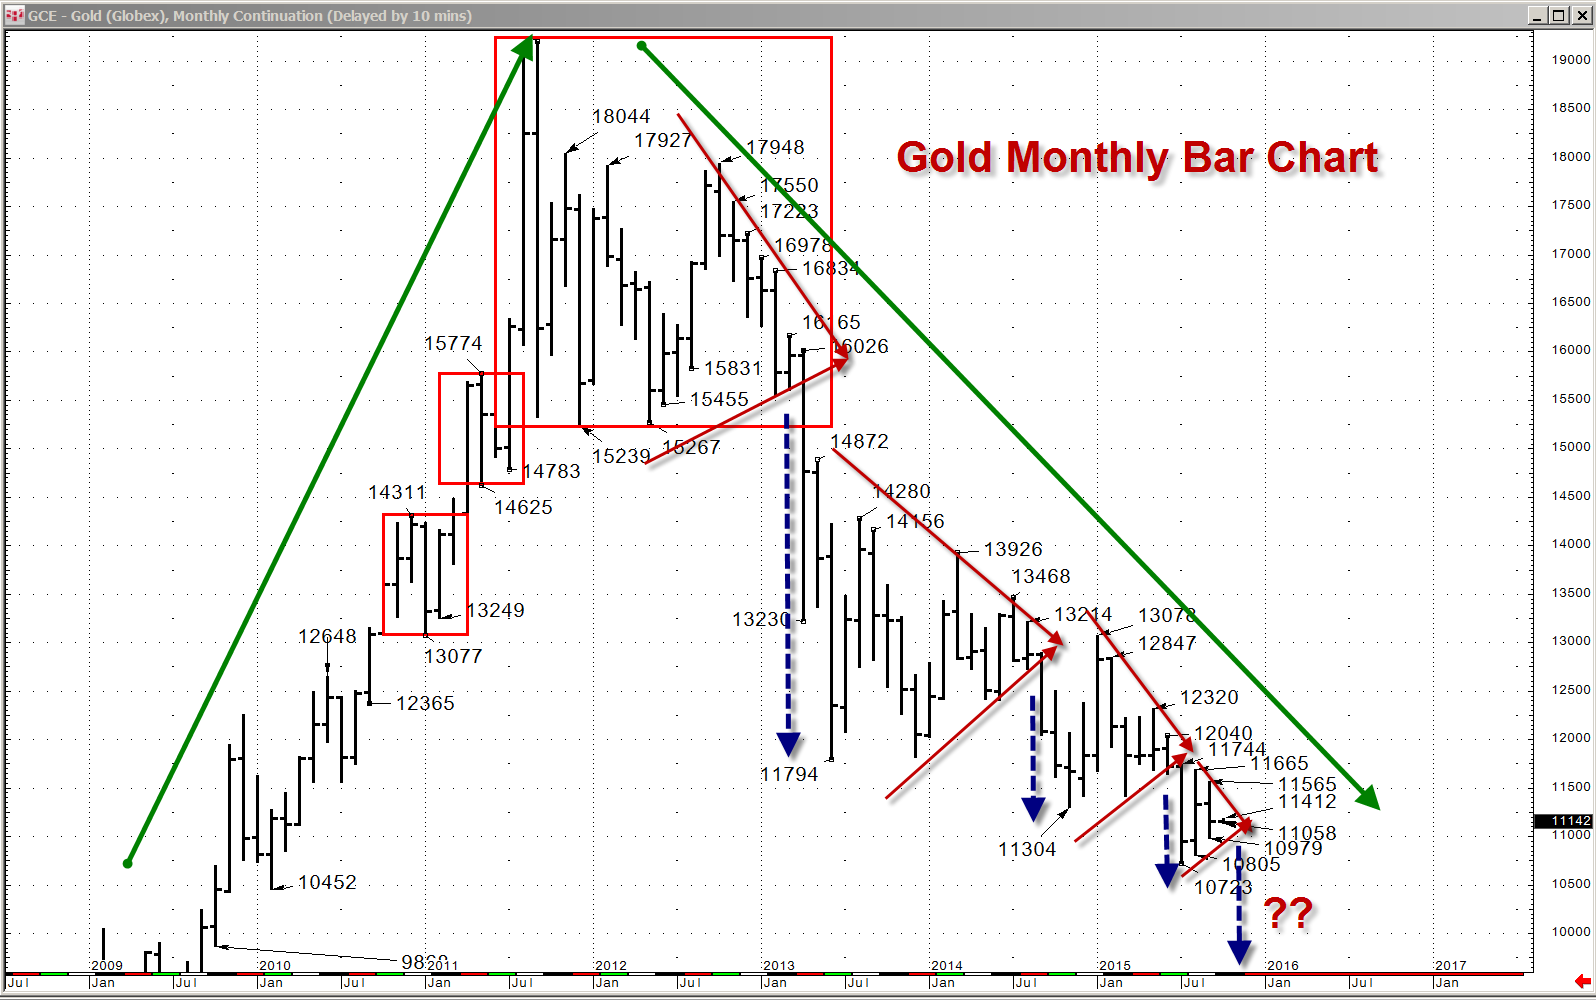
Since 2011, gold has been in a downtrend from the 19207 all-time high to the 10723 low made earlier this year. During this four-year trend, gold has had a series of consolidations, in the form of… more
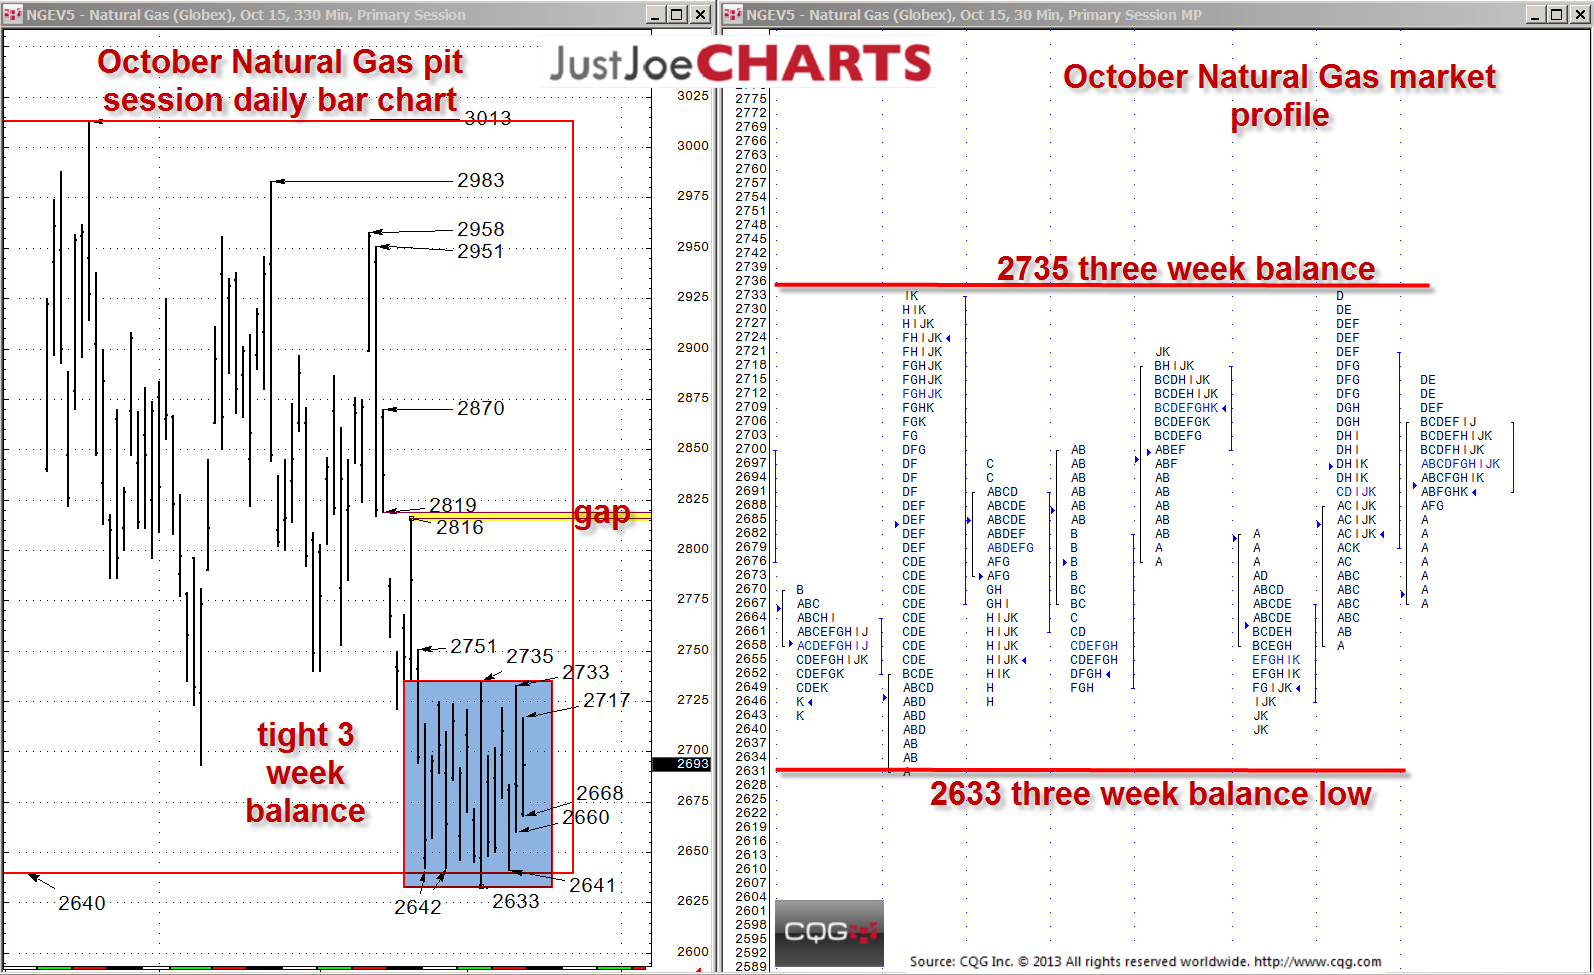
Two weeks ago, I wrote an article about how natural gas was testing the low of a several-month balance of 2640 to 3013. Additionally, at that time natural gas had formed a relatively… more
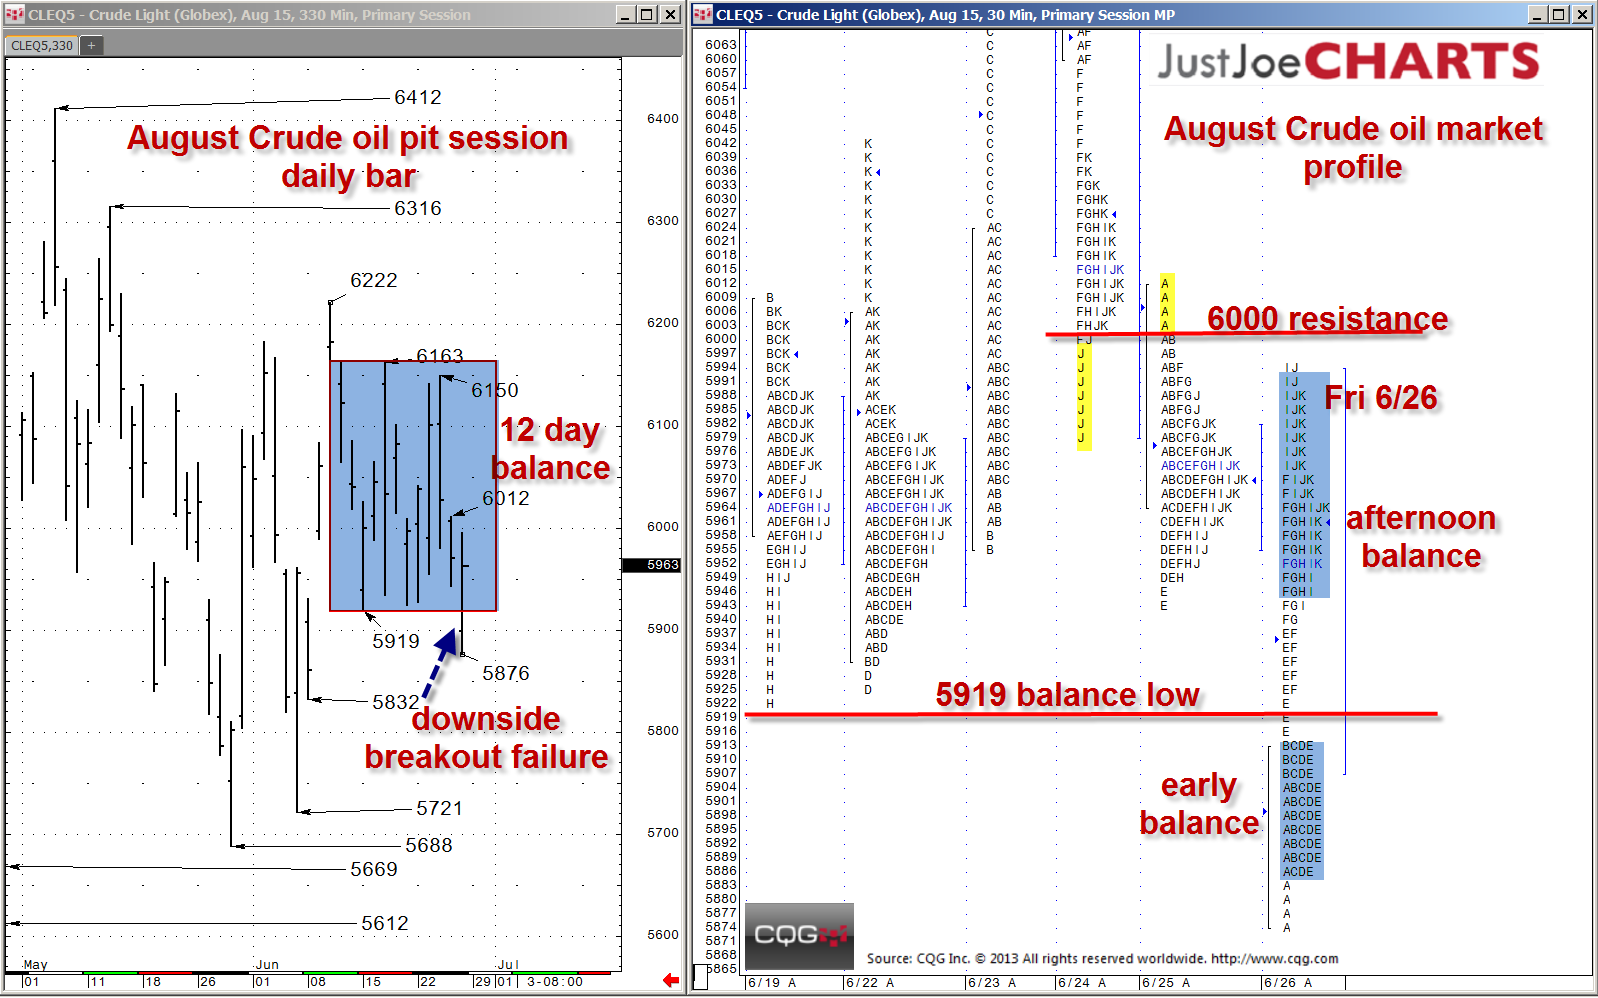
For the last two weeks, August crude oil found a relatively tight, 5919-to-6163 rotational trading range. During that time, the market tested the range's extremes several times on each end.… more
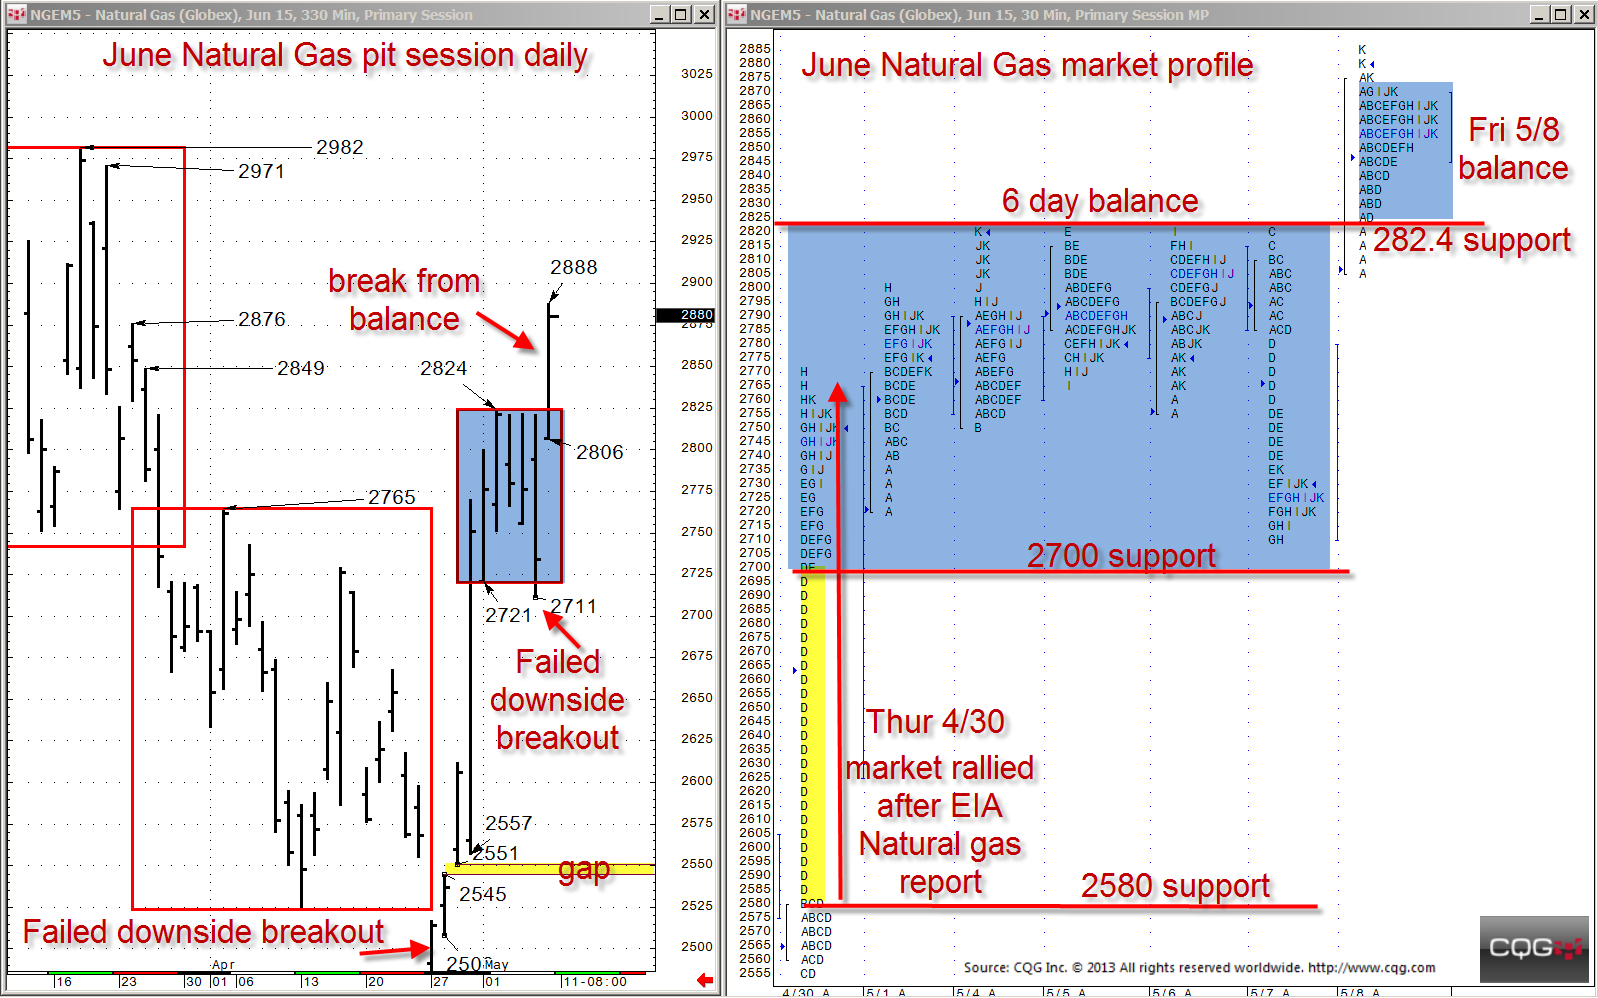
From the middle of March until the end of April, June natural gas held a steady decline from about 290.0 down to below 250.0. However, over the last ten days, much of that decline has been… more
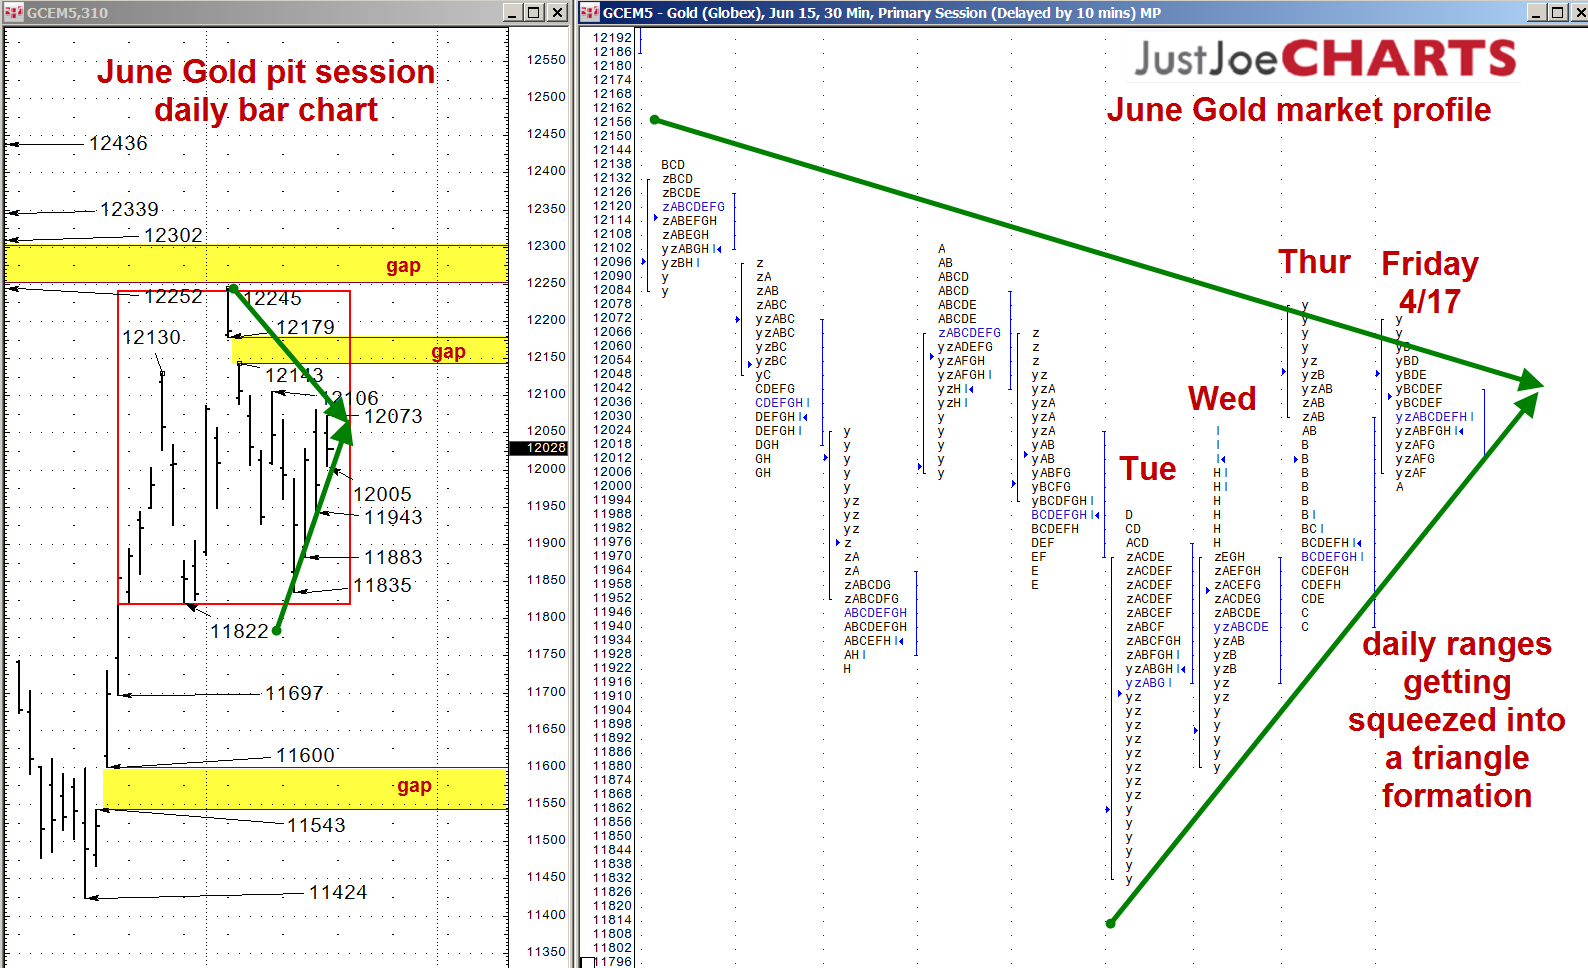
Over the past month, June gold has been trading within a 11822-to-12245 balance range. However, over the past two weeks, the daily ranges have been getting pinched smaller and smaller, forming a… more
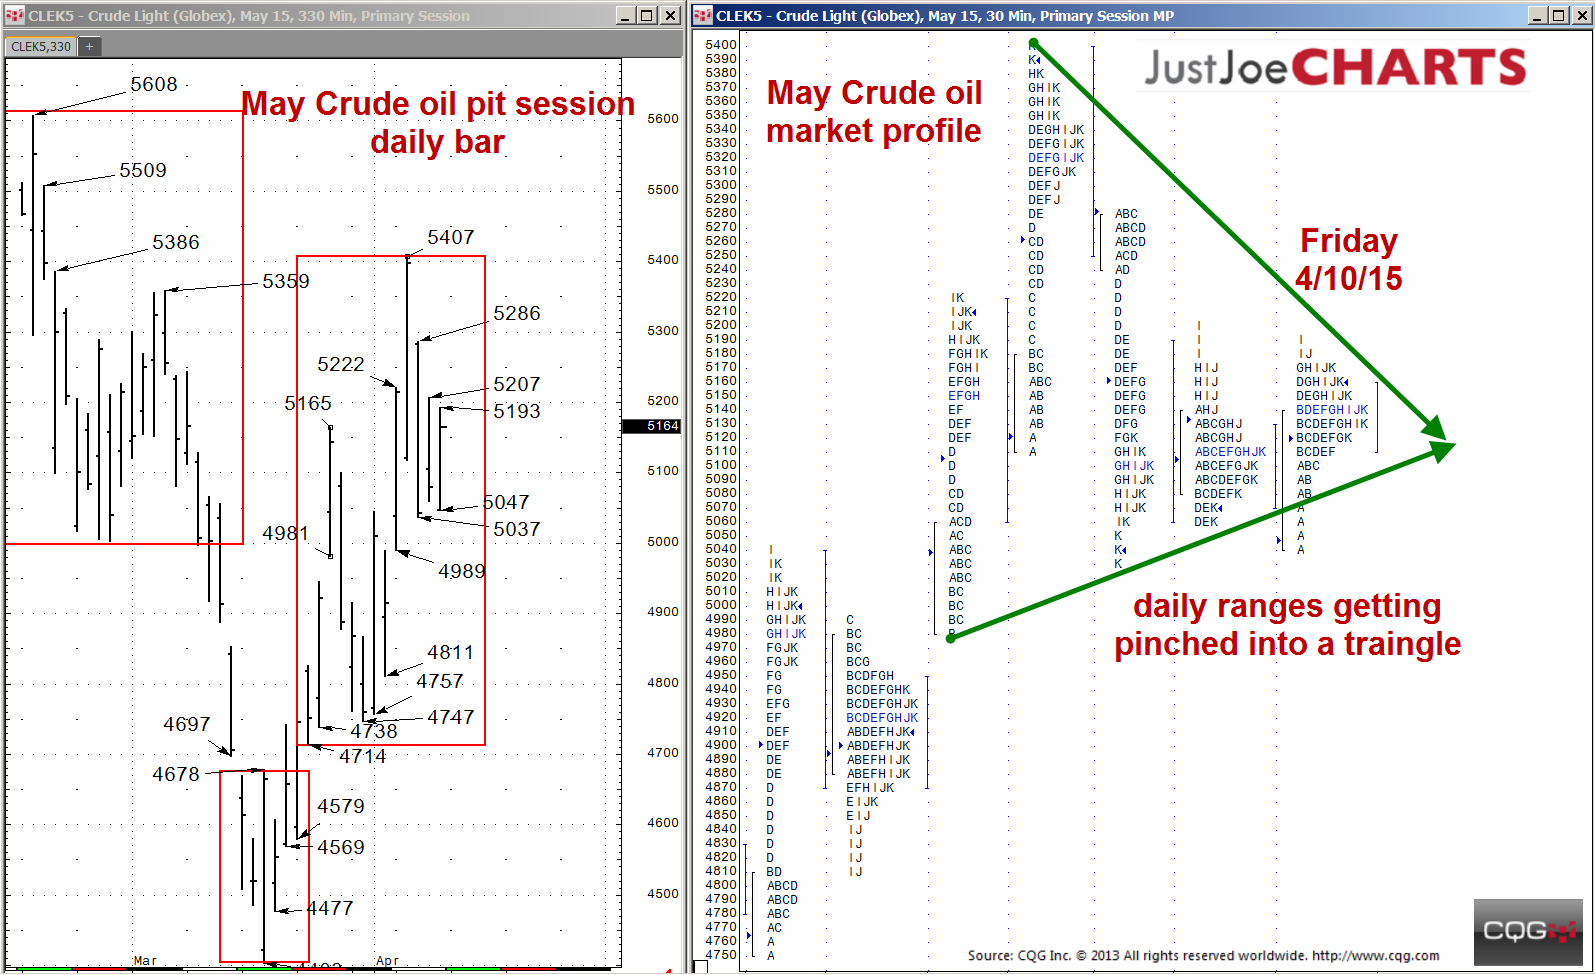
Over the past three weeks, May crude oil has been trading within a 4714-to-5407 balance range. However, over the past five days, the daily ranges have been gradually shrinking, essentially getting… more
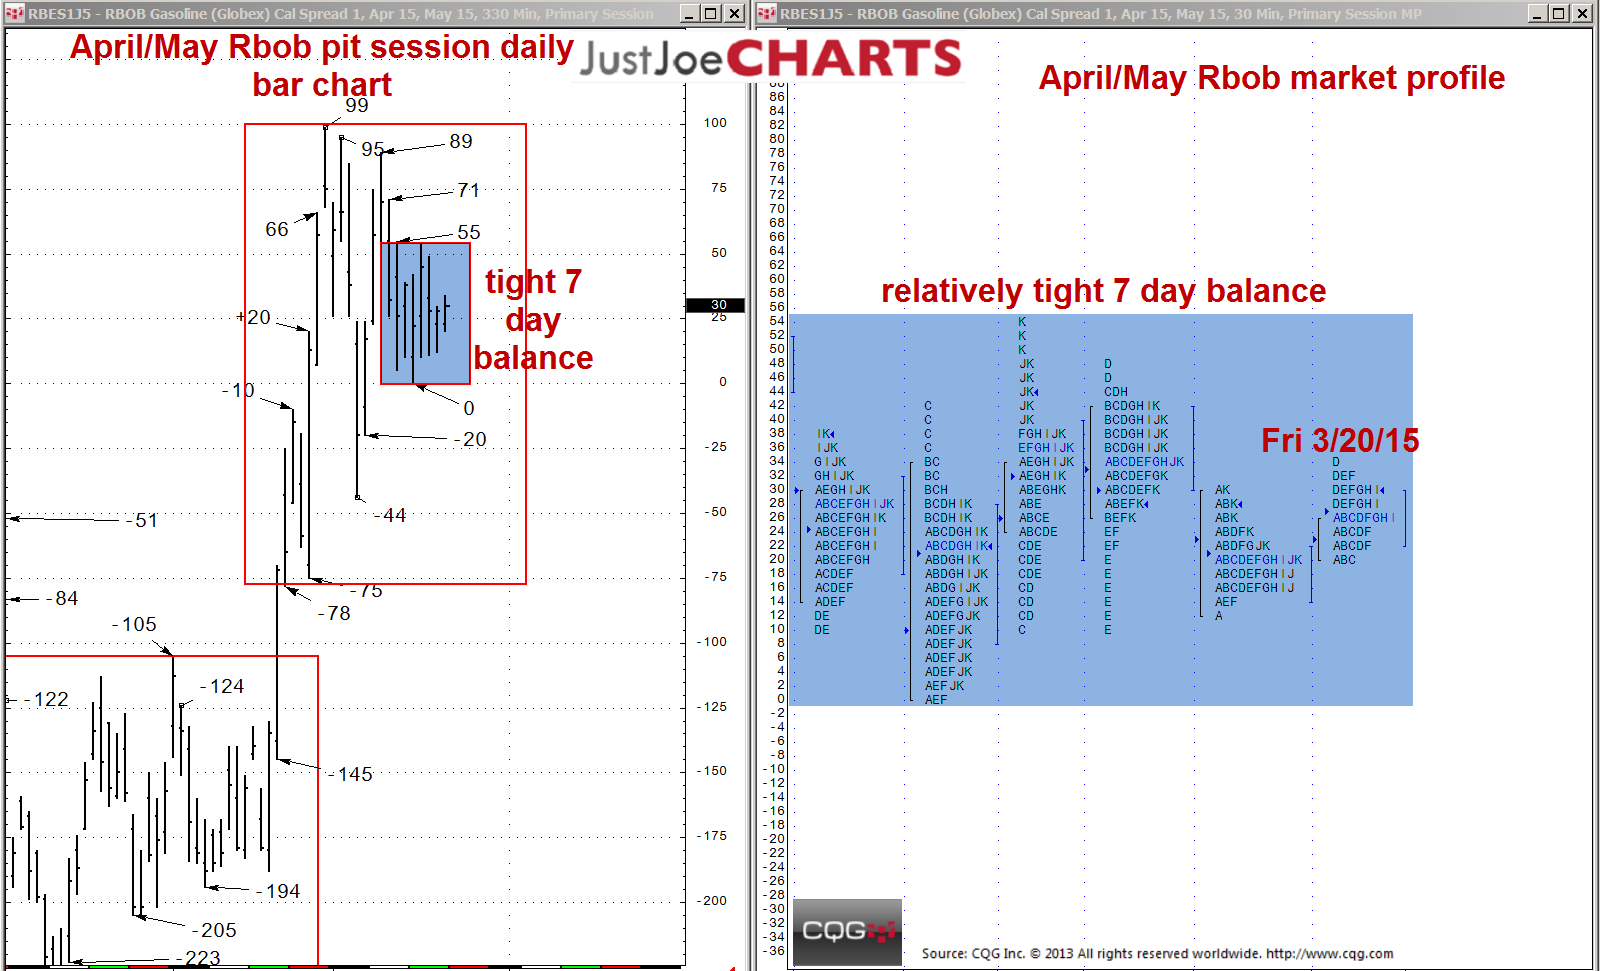
During the last few weeks, the April/May RBOB calendar spread has formed a rotational range of -78 to +99. However, over the past seven trading days, the trading range has shrunk to 0 to +55. A 55… more