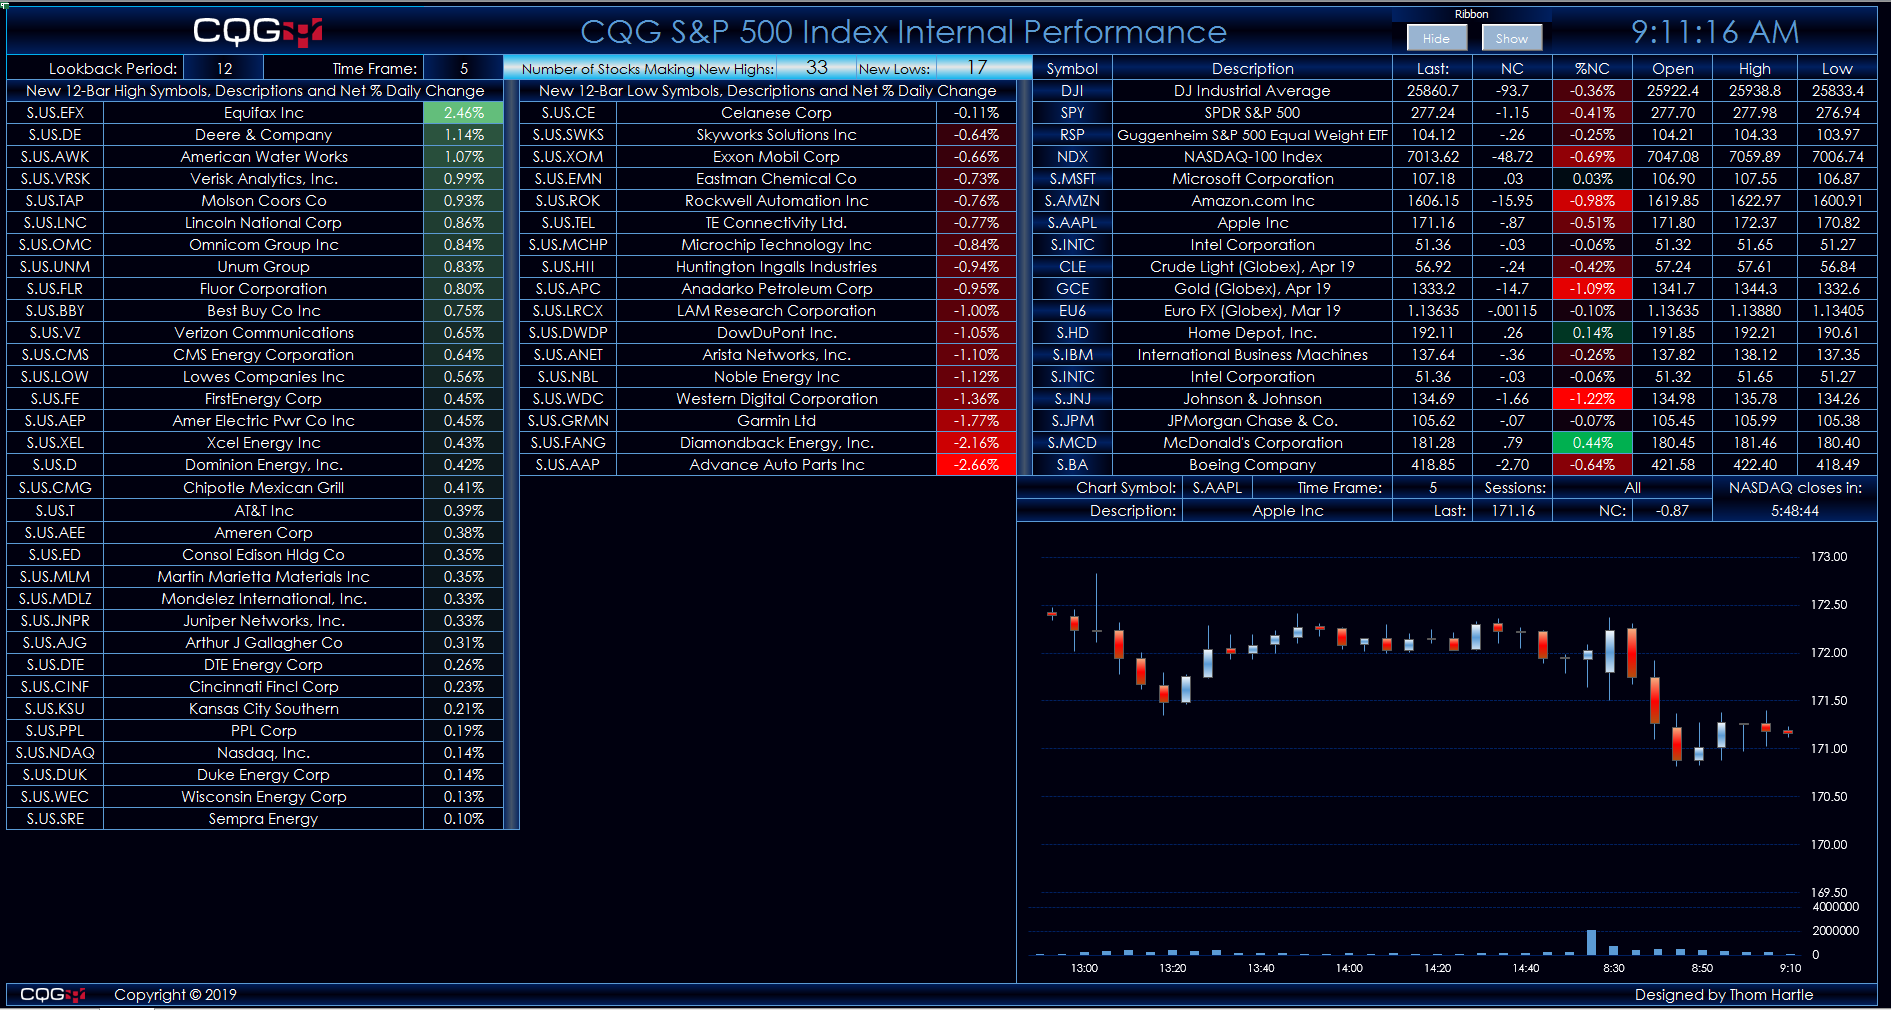
This Microsoft Excel® dashboard tracks the 506 stocks in the S&P 500 index using CQG’s Level function. The Level function plots two lines, which identify the highest and lowest price levels… more
S&P
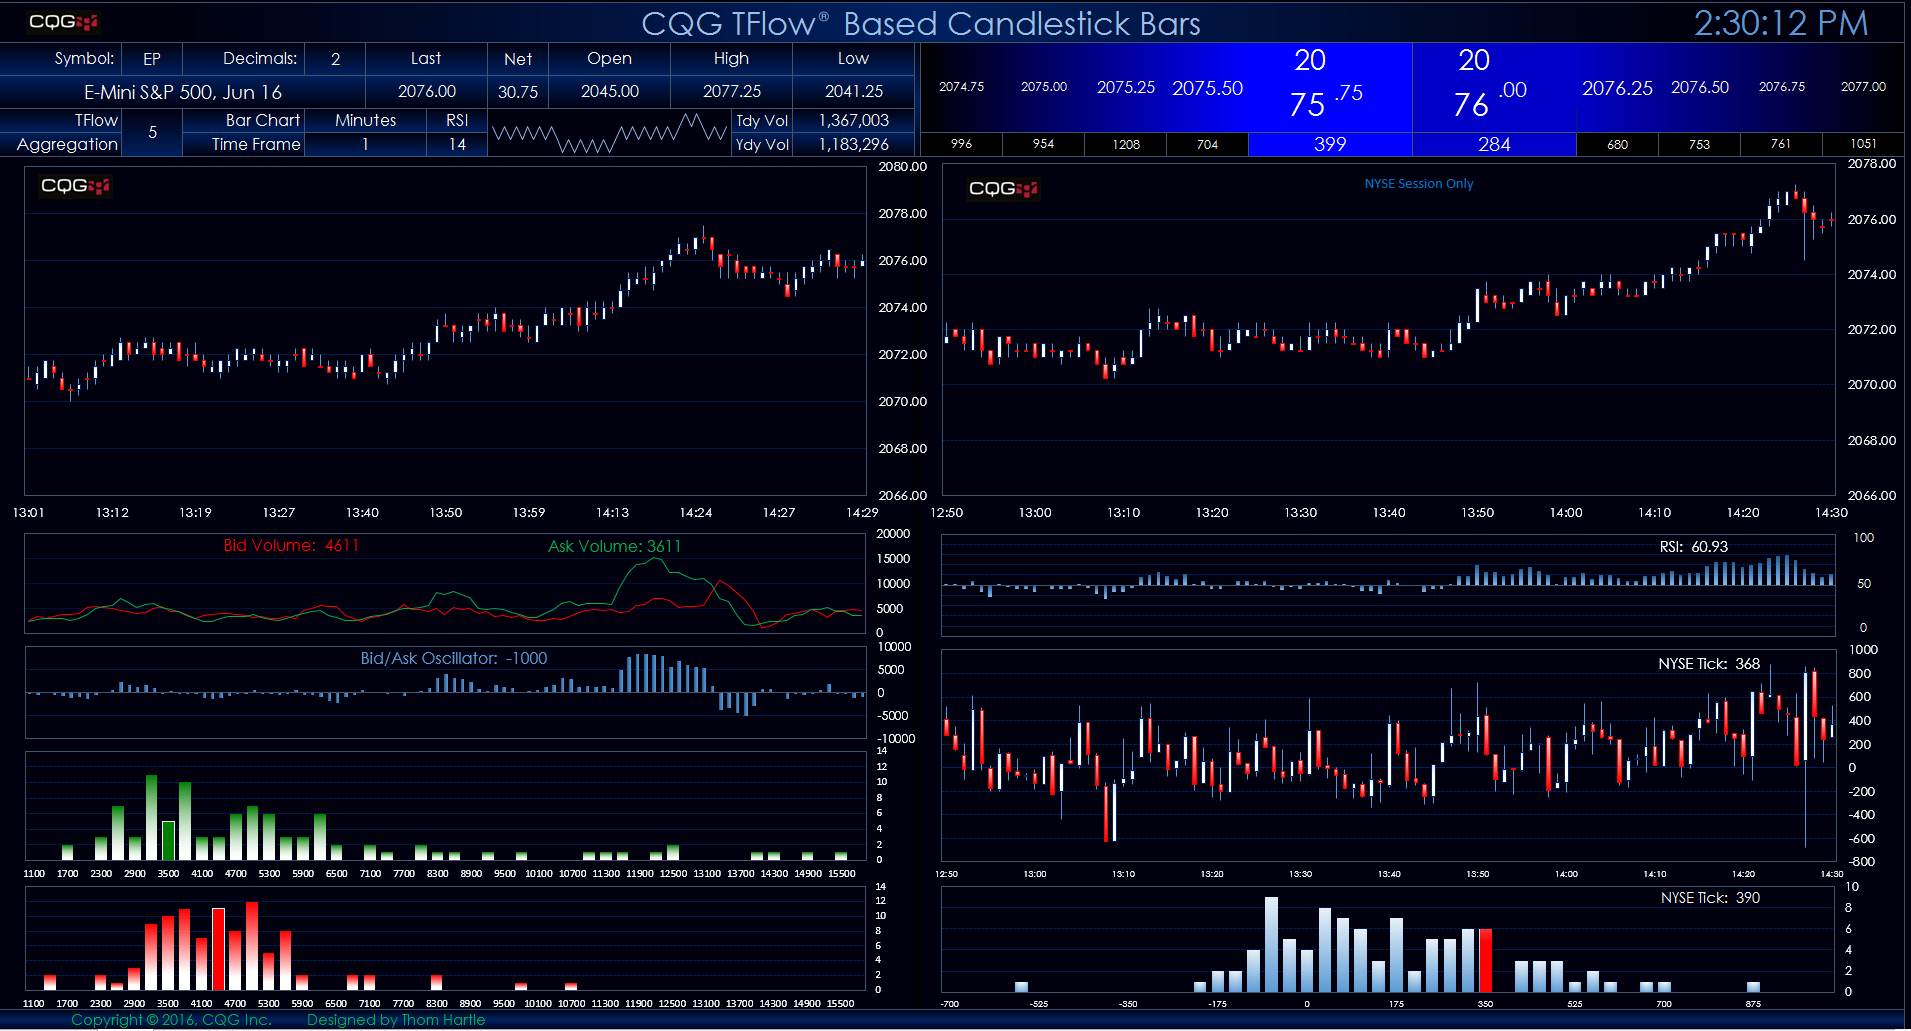
This Microsoft Excel® spreadsheet presents two views of the E-mini S&P contract. The left-hand view displays candlestick bars using CQG’s proprietary TFlow chart data. You can use the… more

A Picture is Worth A Thousand Words
Join Andrew Egan Baptiste, CEO of T.A.G., the new and independent Technical Analysis Group, for a detailed webinar on reviewing and forecasting major macro… more