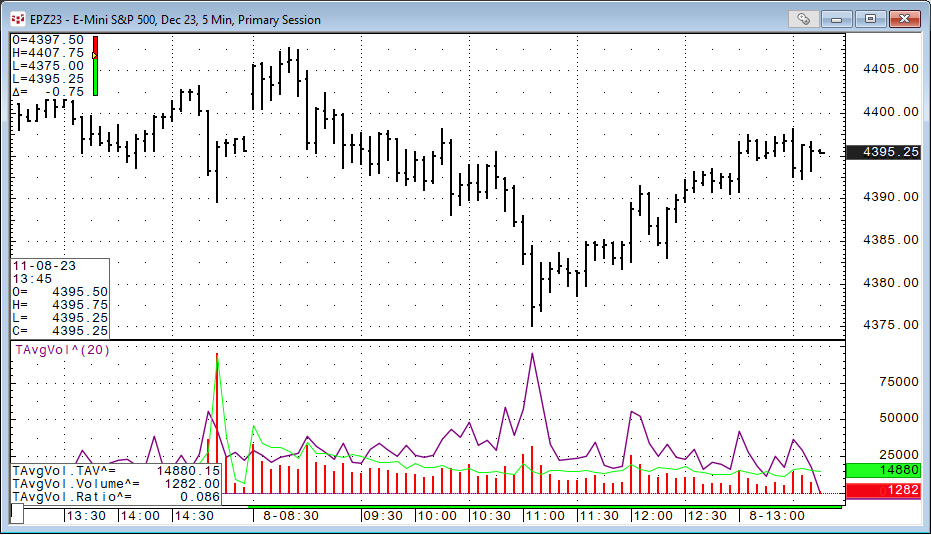
This post details the use of the CQG function: Time Average (TimeAvg), which calculates the average for values taken at the same time of day over the lookback period.
In this example, the… more
This post details the use of the CQG function: Time Average (TimeAvg), which calculates the average for values taken at the same time of day over the lookback period.
In this example, the… more
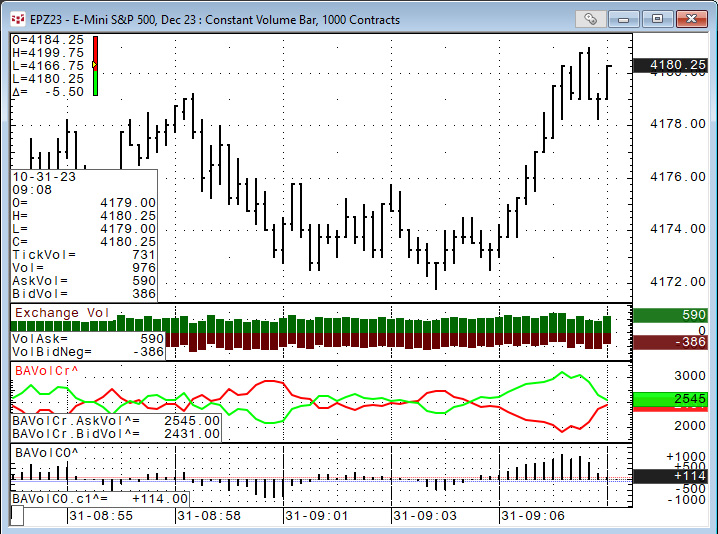
CQG IC and QTrader offer charts that utilize volume for the horizontal scale, not time. The first chart type to discuss is Constant Volume Bars.
Constant Volume Bar (CVB)
The Constant… more
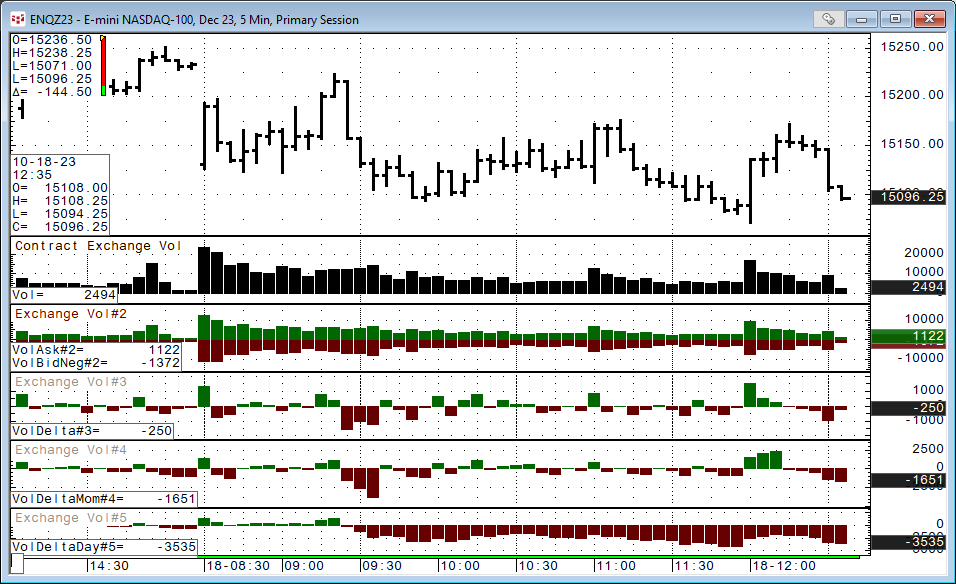
There are a number of volume-based studies available to customers using CQG IC or QTrader. This post walks you through the basic details of the various studies, then correlation analysis is… more
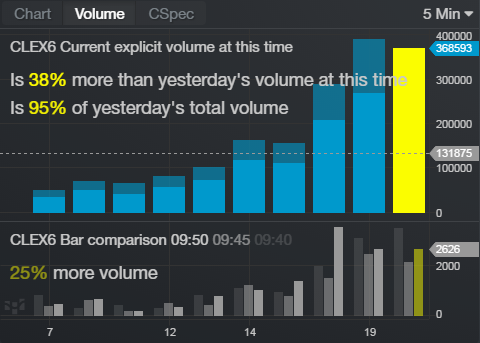
In CQG M version 2.6 on the desktop, the Volume Comparison widget has been updated.
The Volume Comparison widget consolidates volume information and provides greater market transparency by… more
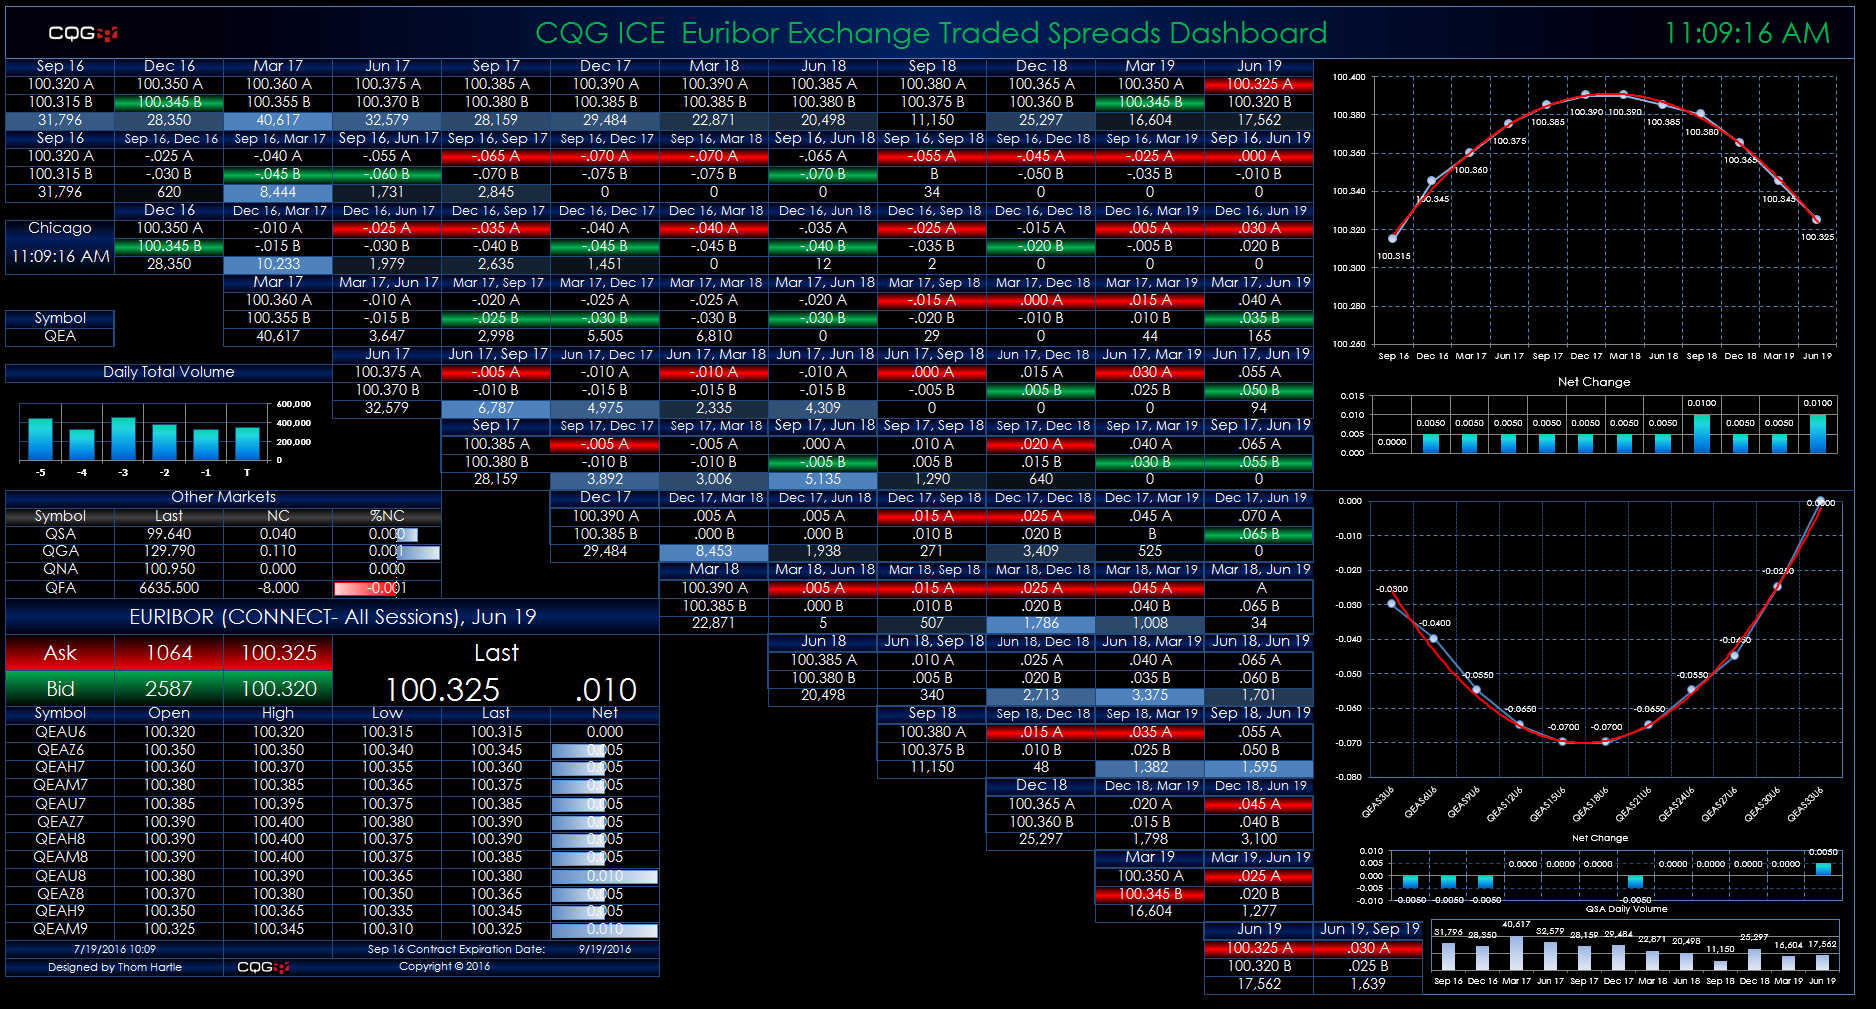
This Microsoft Excel® dashboard displays market data for Euribor calendar spreads traded on the ICE platform. This monitor uses a matrix-style format. The outrights are displayed along the… more
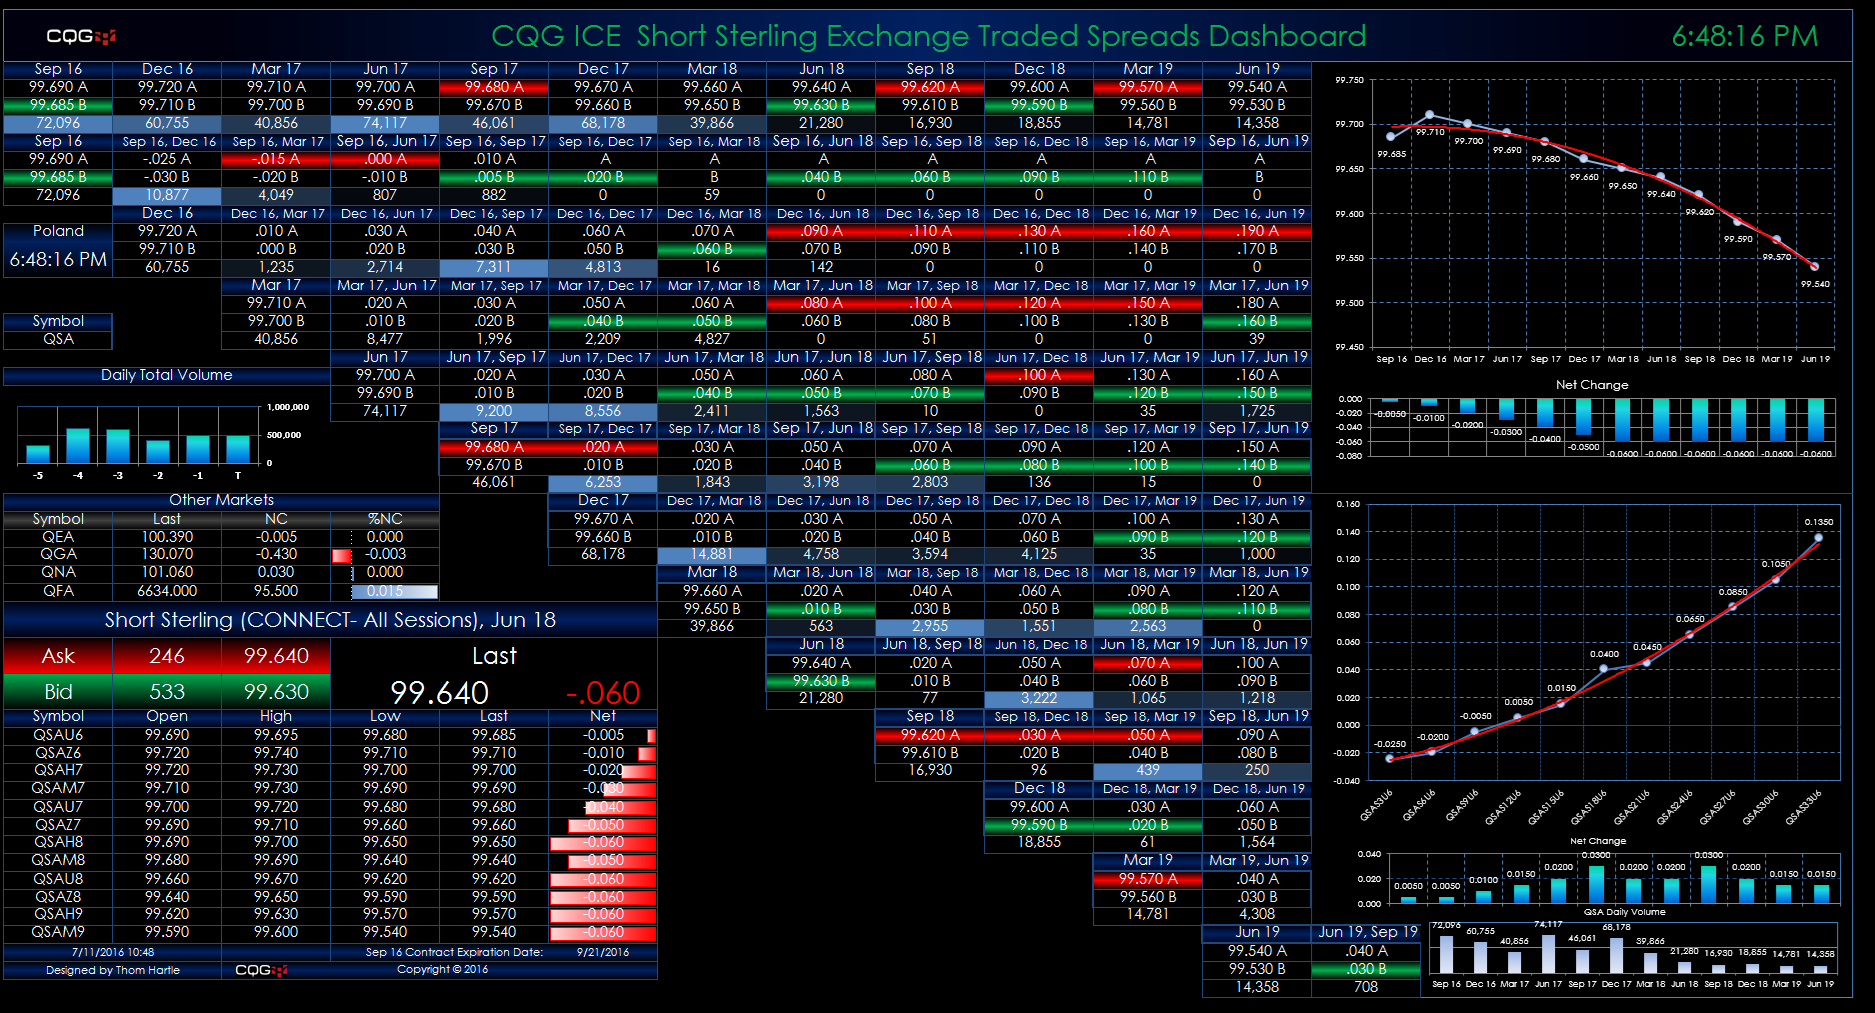
This Microsoft Excel® dashboard displays market data for Short Sterling calendar spreads traded on the ICE platform. This monitor uses a matrix-style format. The outrights are displayed along the… more
CQG provides the ability to separate volume into trades executed at the best bid price and trades executed at the best ask price. This feature gives you more insight into market action because you… more
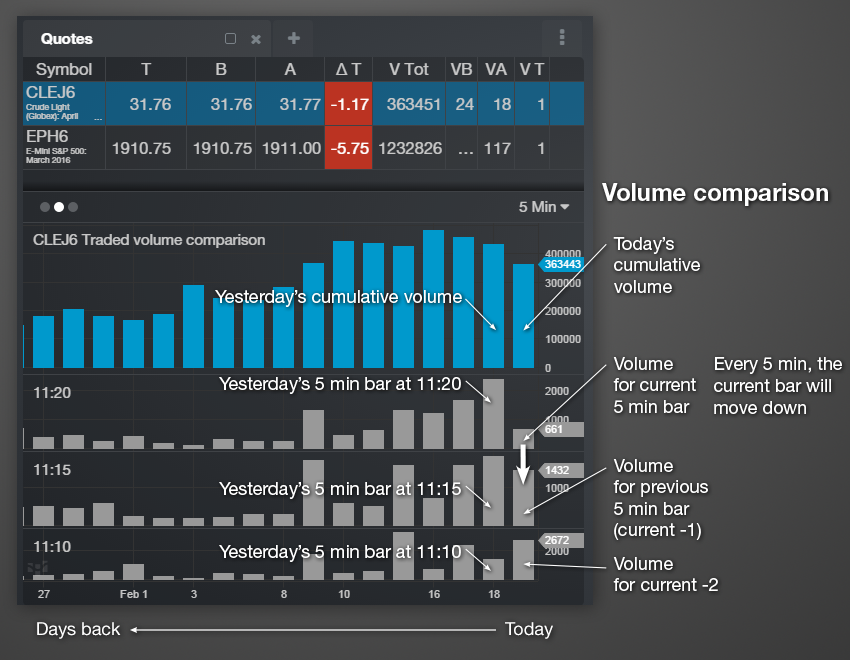
With our 2.0 release on mdemo.cqg.com, we've also added a volume comparison widget. You can access it by swiping on the chart that's attached to a quote board.
What is it and why is it … more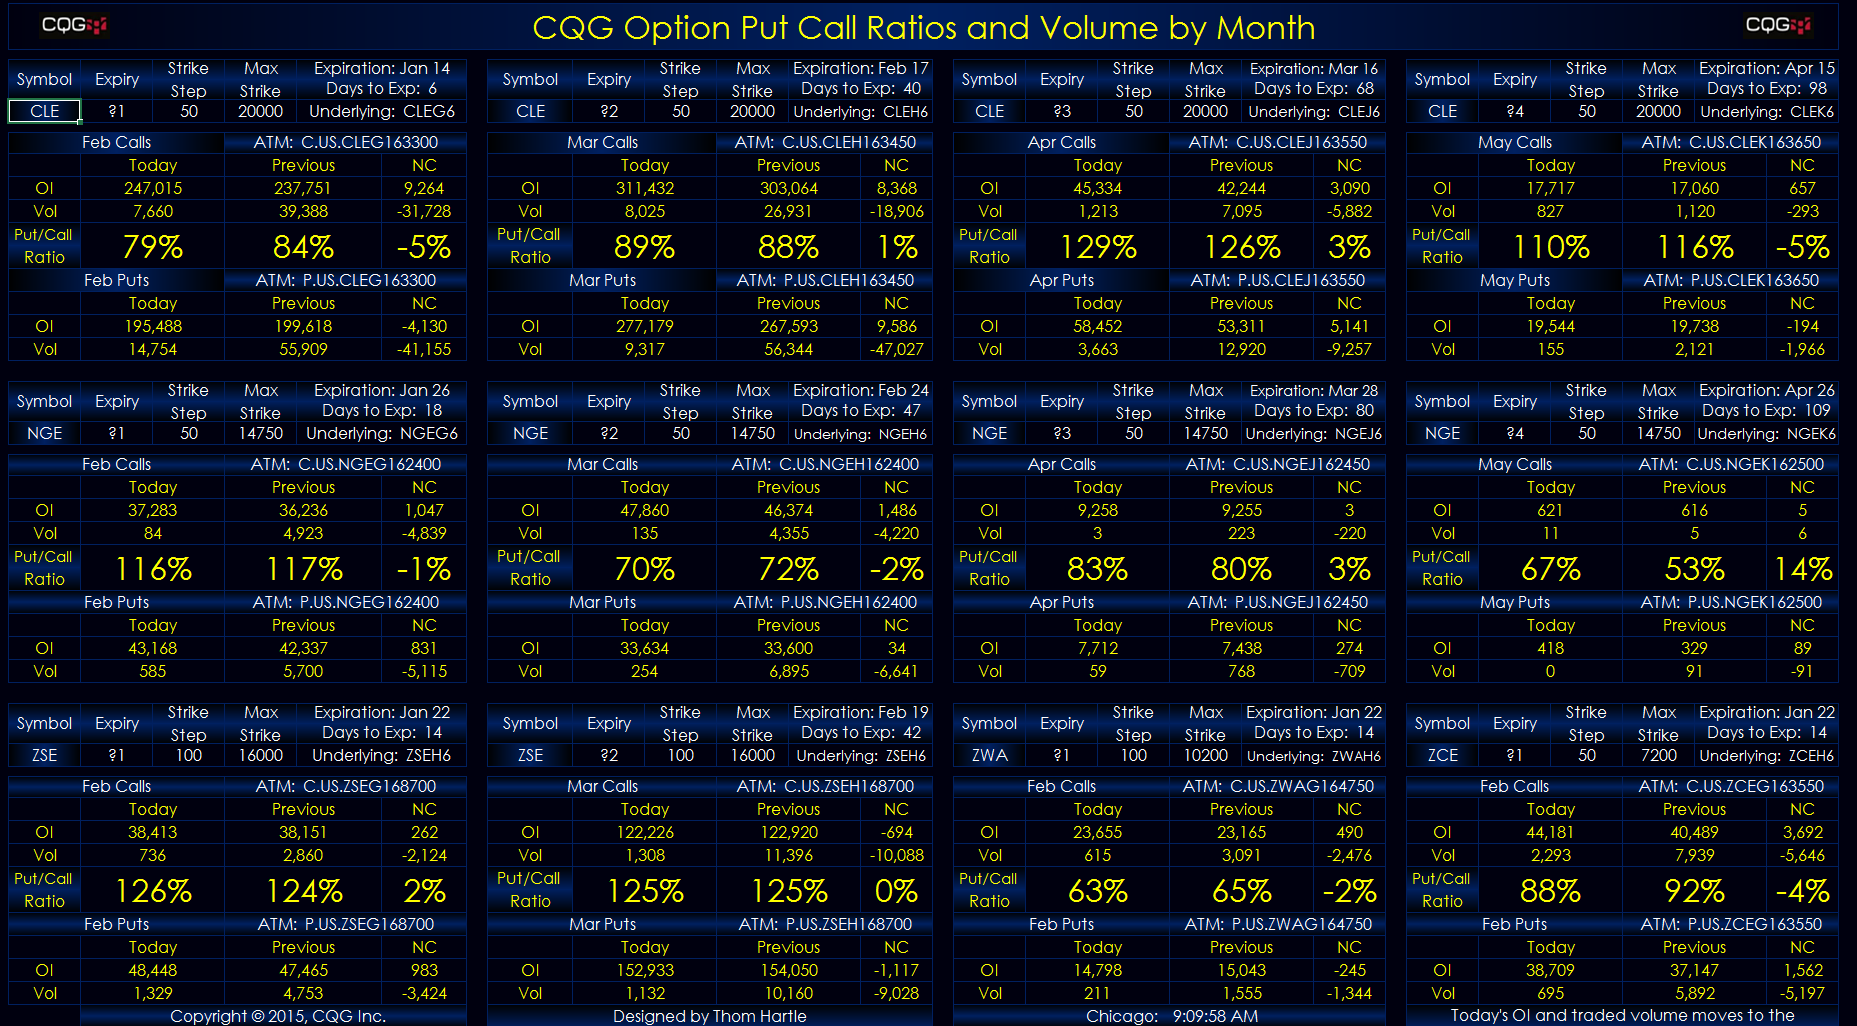
This Microsoft Excel® dashboard displays today’s open interest and traded volume for all of the strikes by month for both call and put options on futures. In addition, the current put/call ratio… more