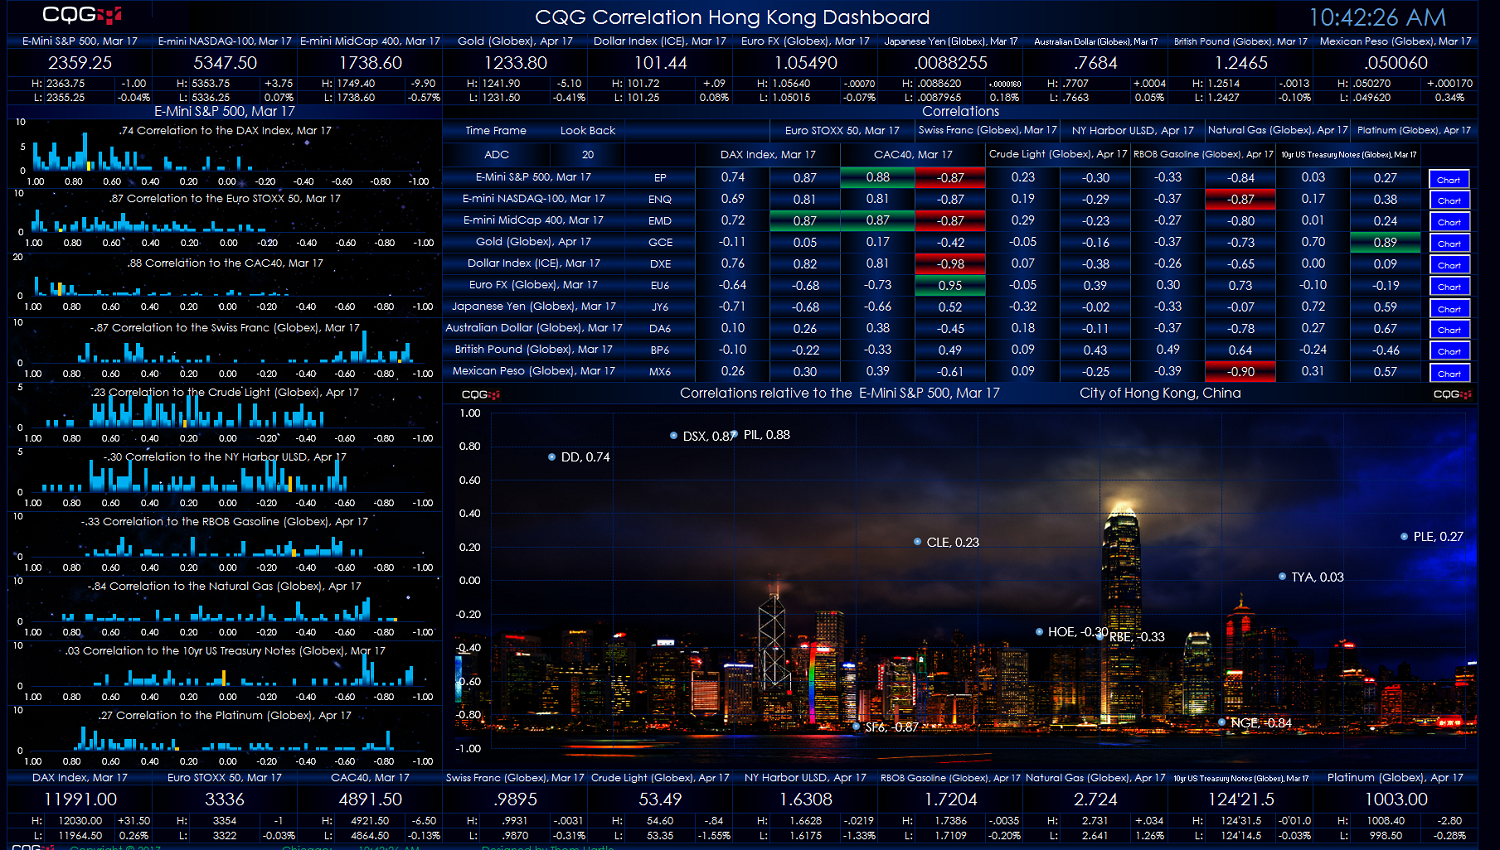
This macro-enabled Microsoft Excel® spreadsheet presents a ten-by-ten correlation matrix, a scattergram chart of the correlations by row, and frequency distribution charts of the correlations. In… more
Thom Hartle
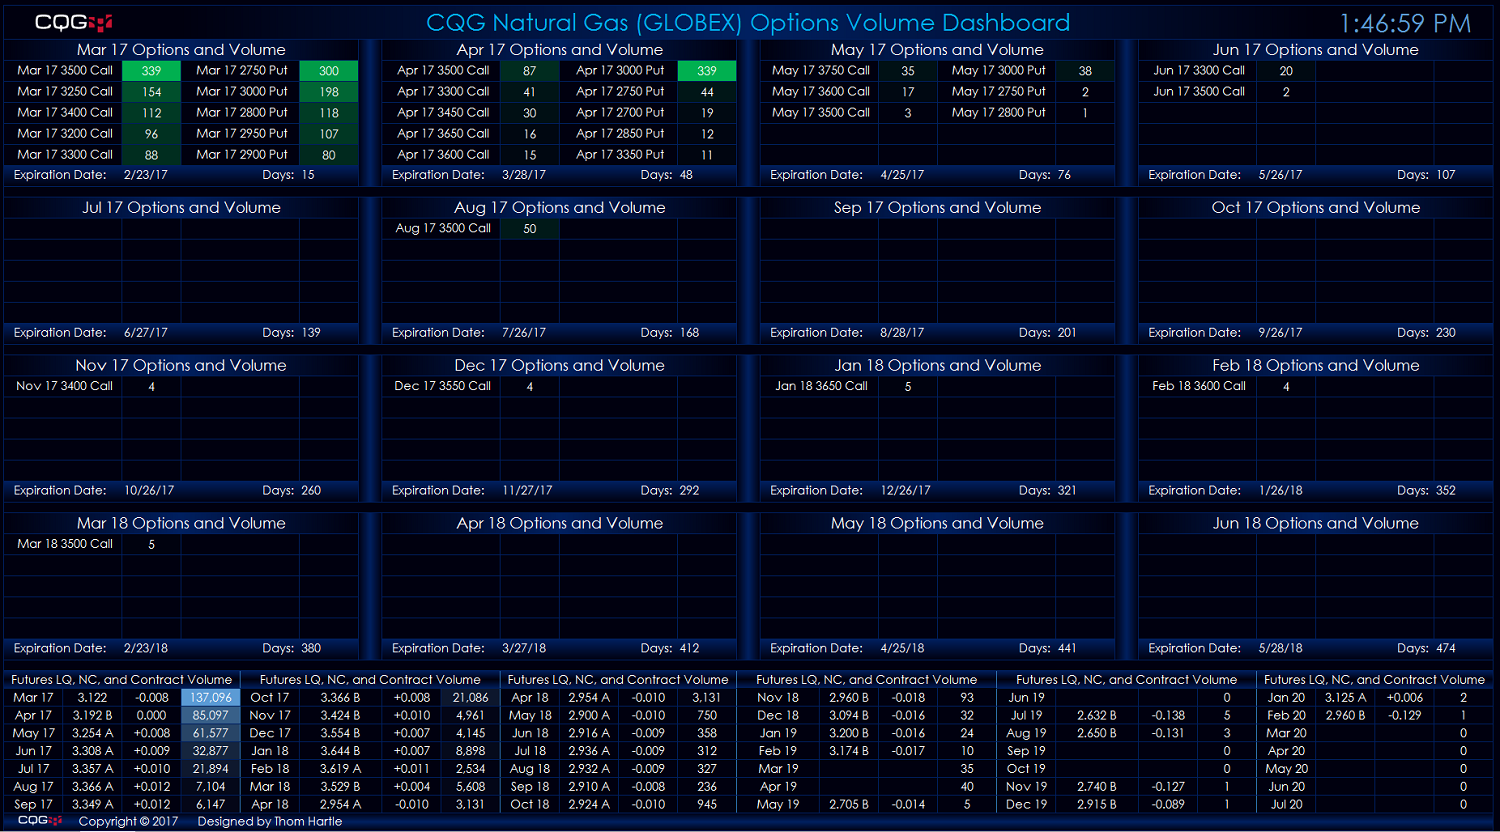
This Microsoft Excel® dashboard scans the options on the natural gas (Globex) futures market for volume and ranks the volume traded for each expiry out sixteen months. The scan covers options… more
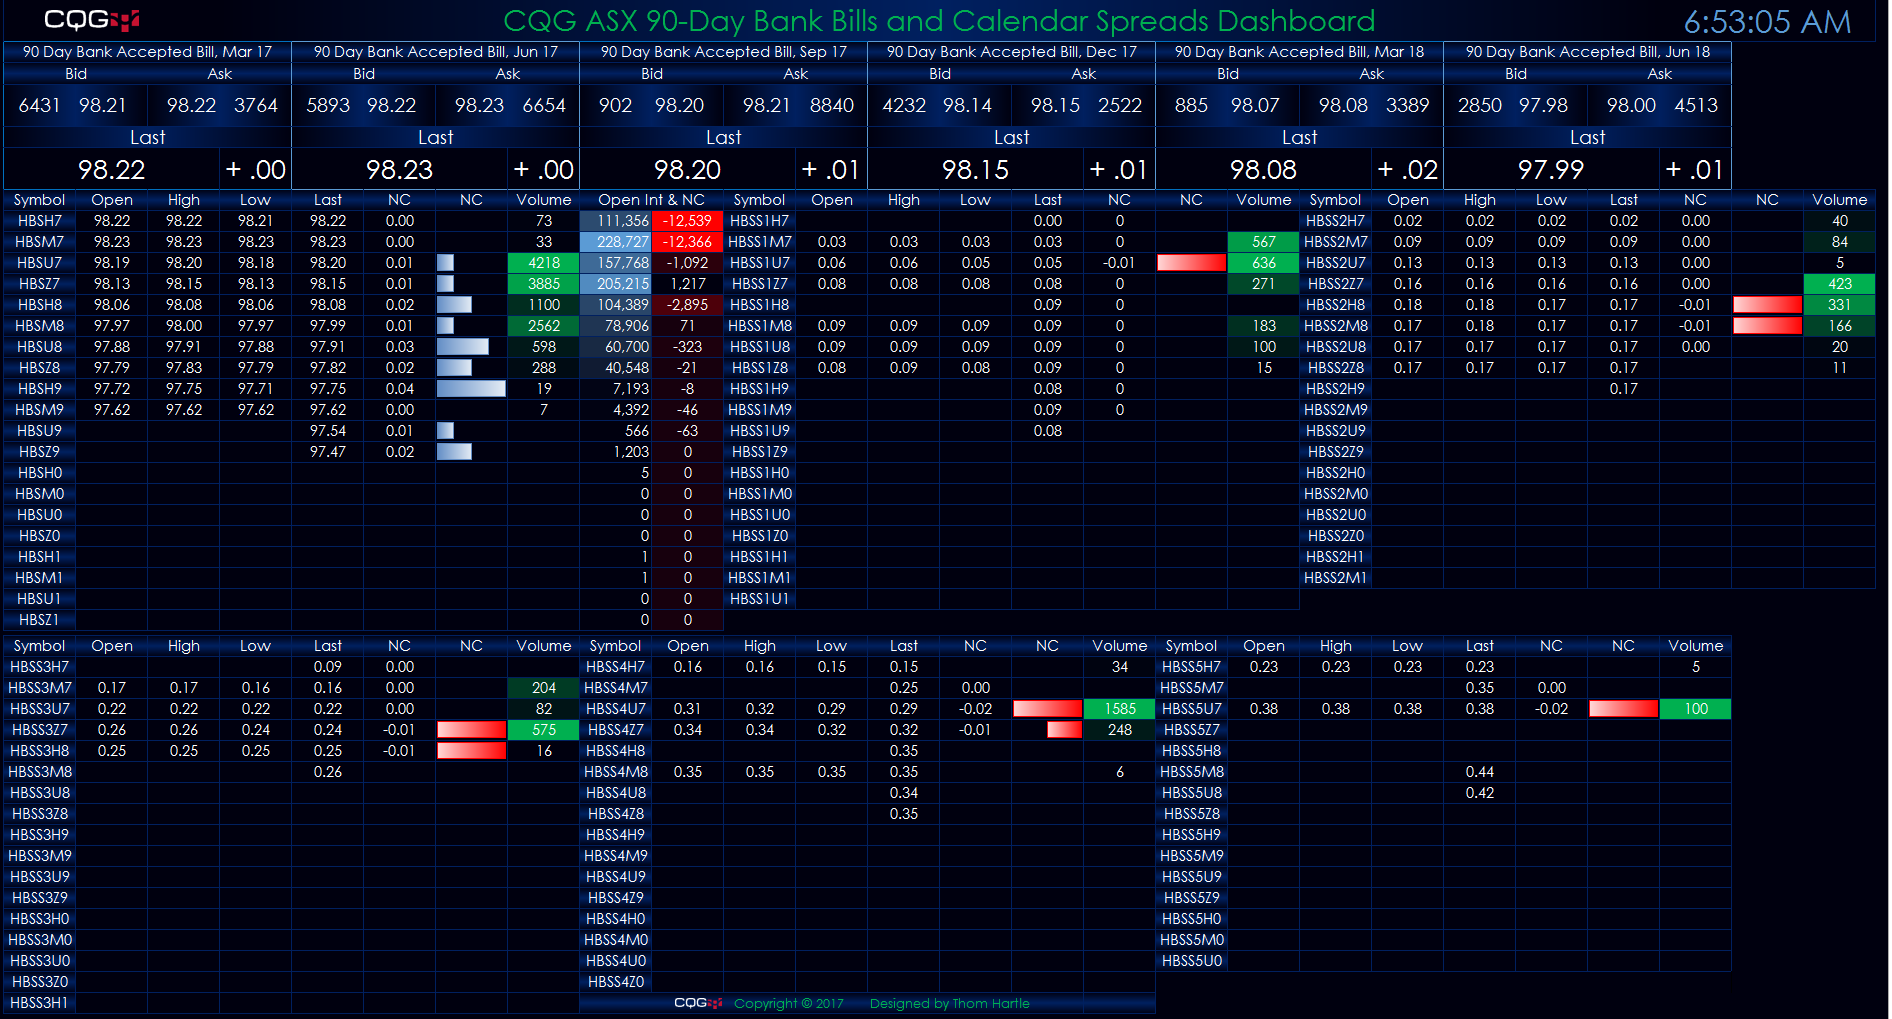
This Microsoft Excel® dashboard displays 90-day bank bills and exchange-traded spreads traded on ASX. The inside market for the front six contracts is detailed along the top. The open, high, low,… more
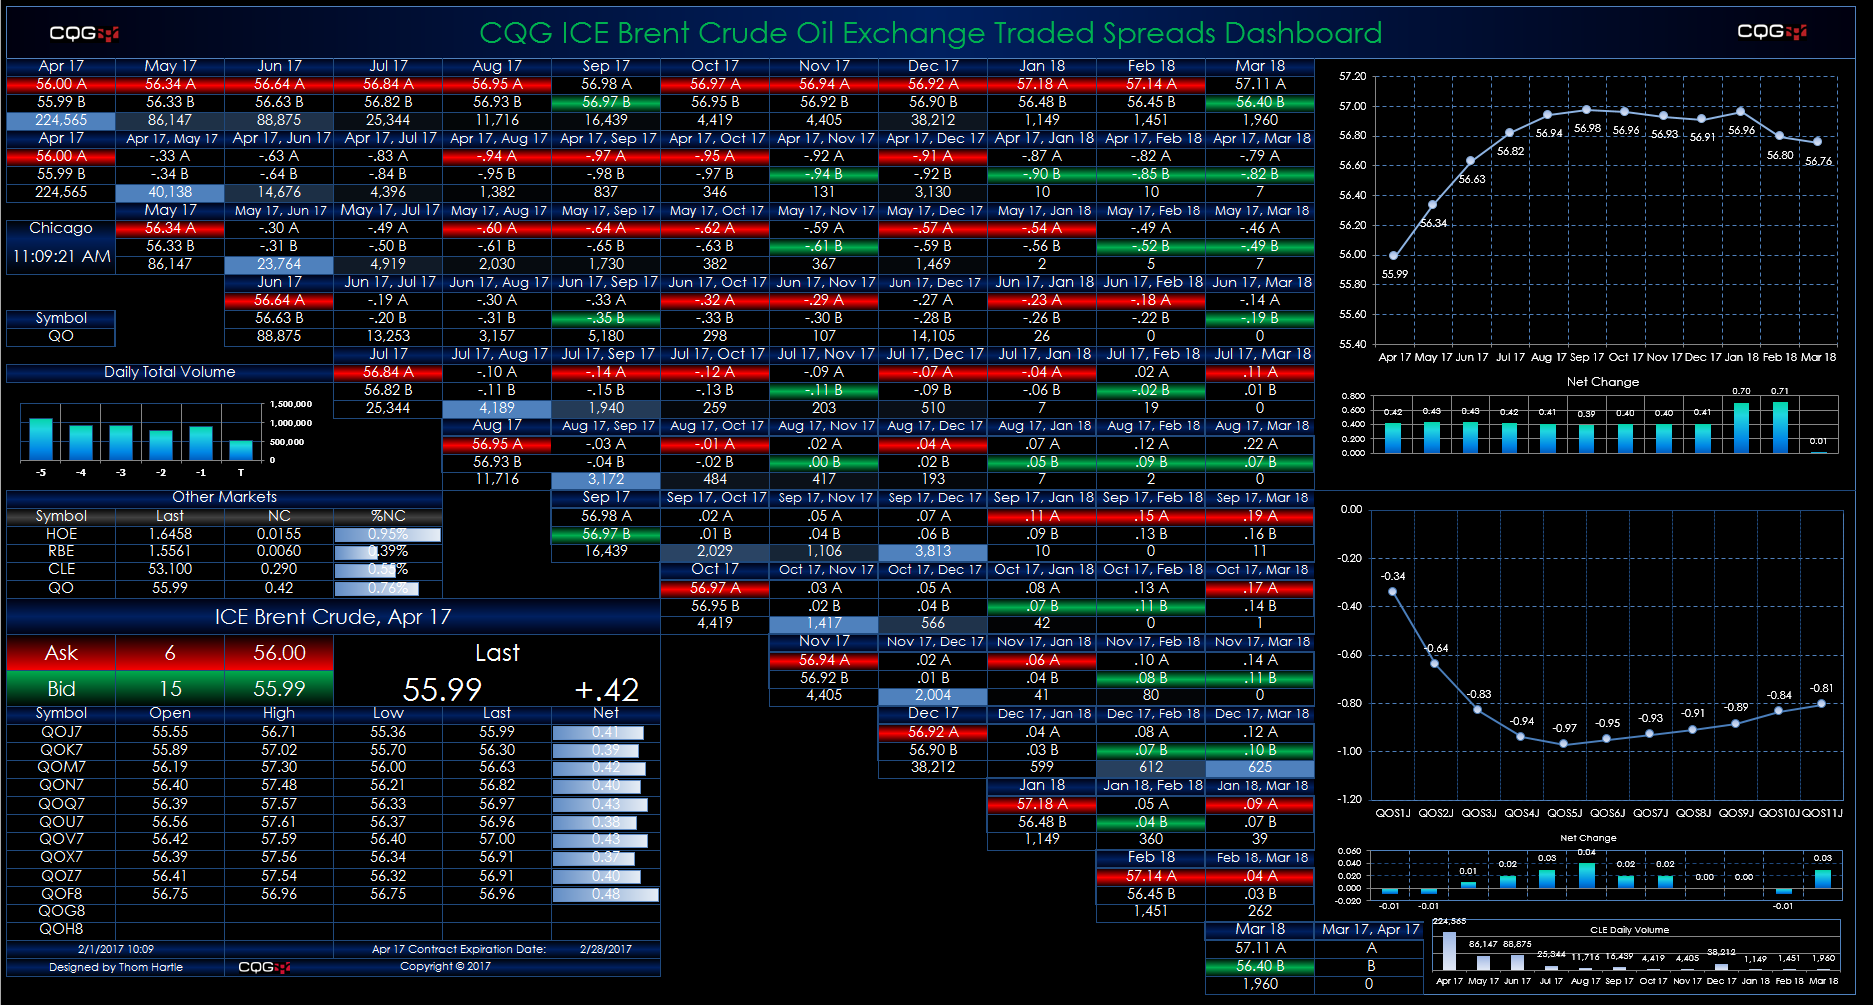
This Microsoft Excel® dashboard displays market data for crude oil spreads traded on the ICE platform using a matrix-style format. The outrights are along the top row and the start of each… more
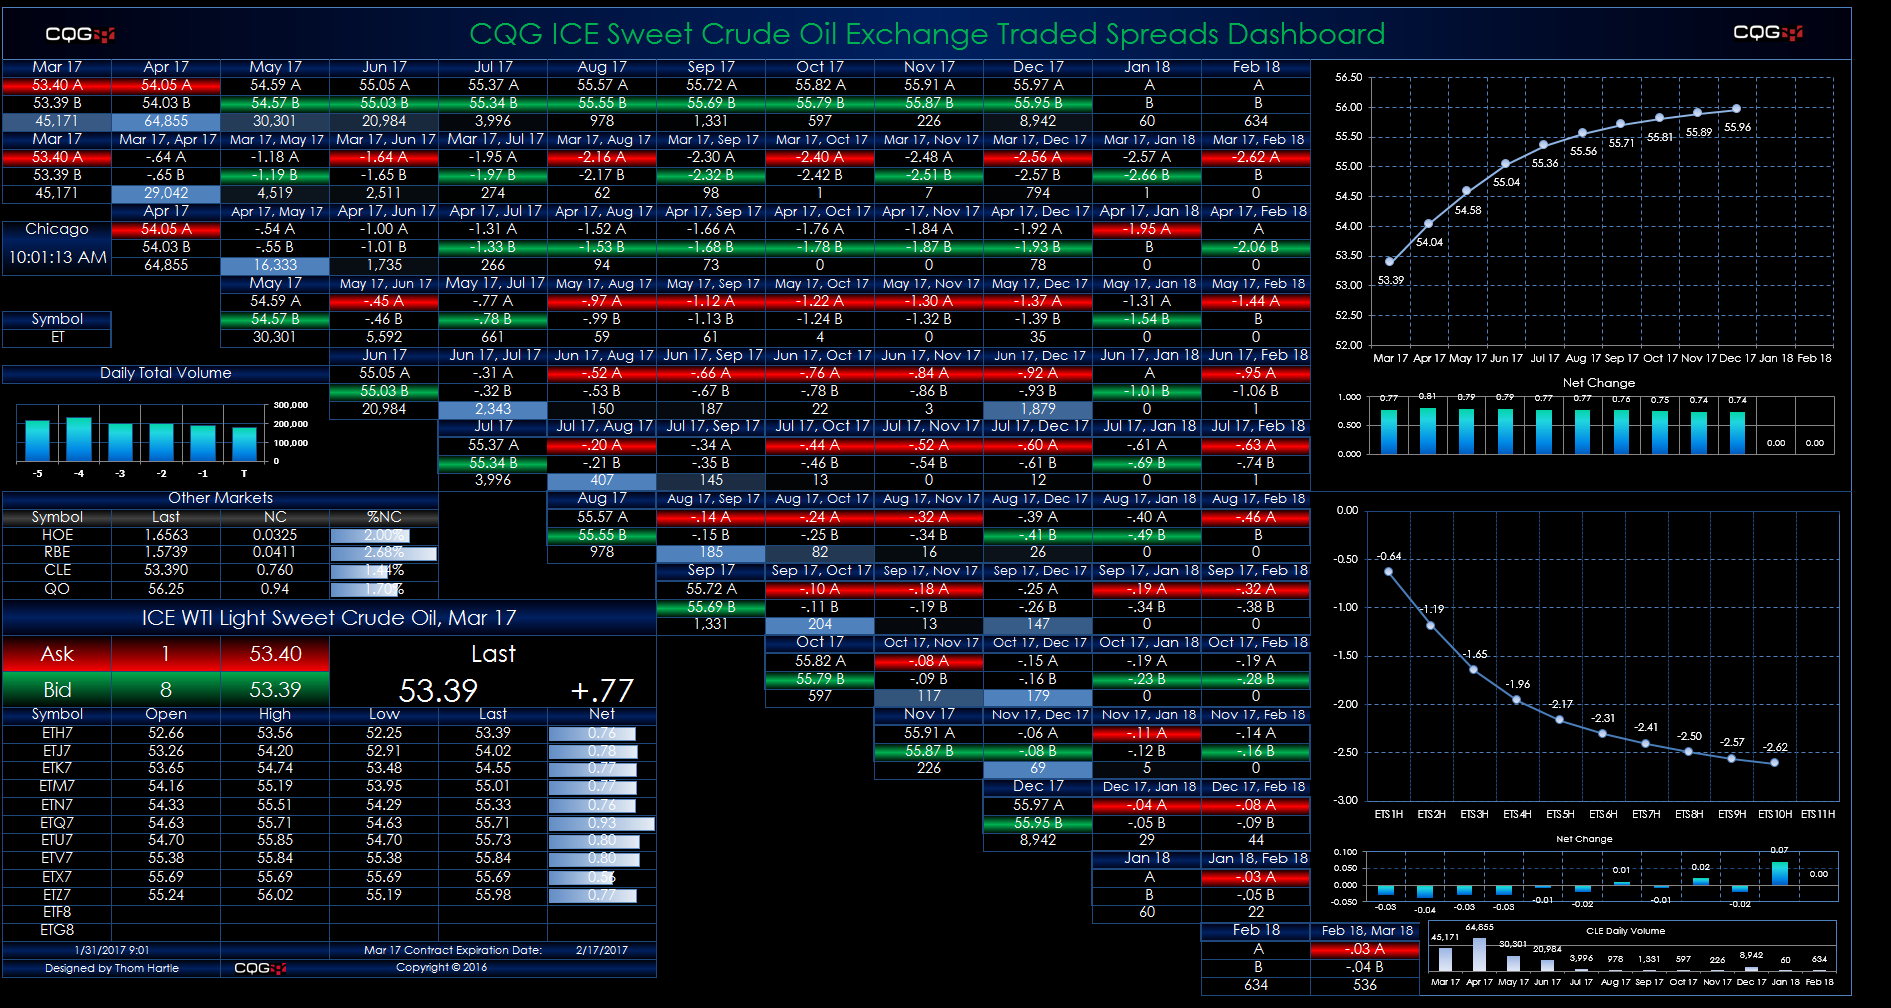
This Microsoft Excel® dashboard displays market data for crude oil spreads traded on the ICE platform using a matrix-style format. The outrights are along the top row and the start of each… more
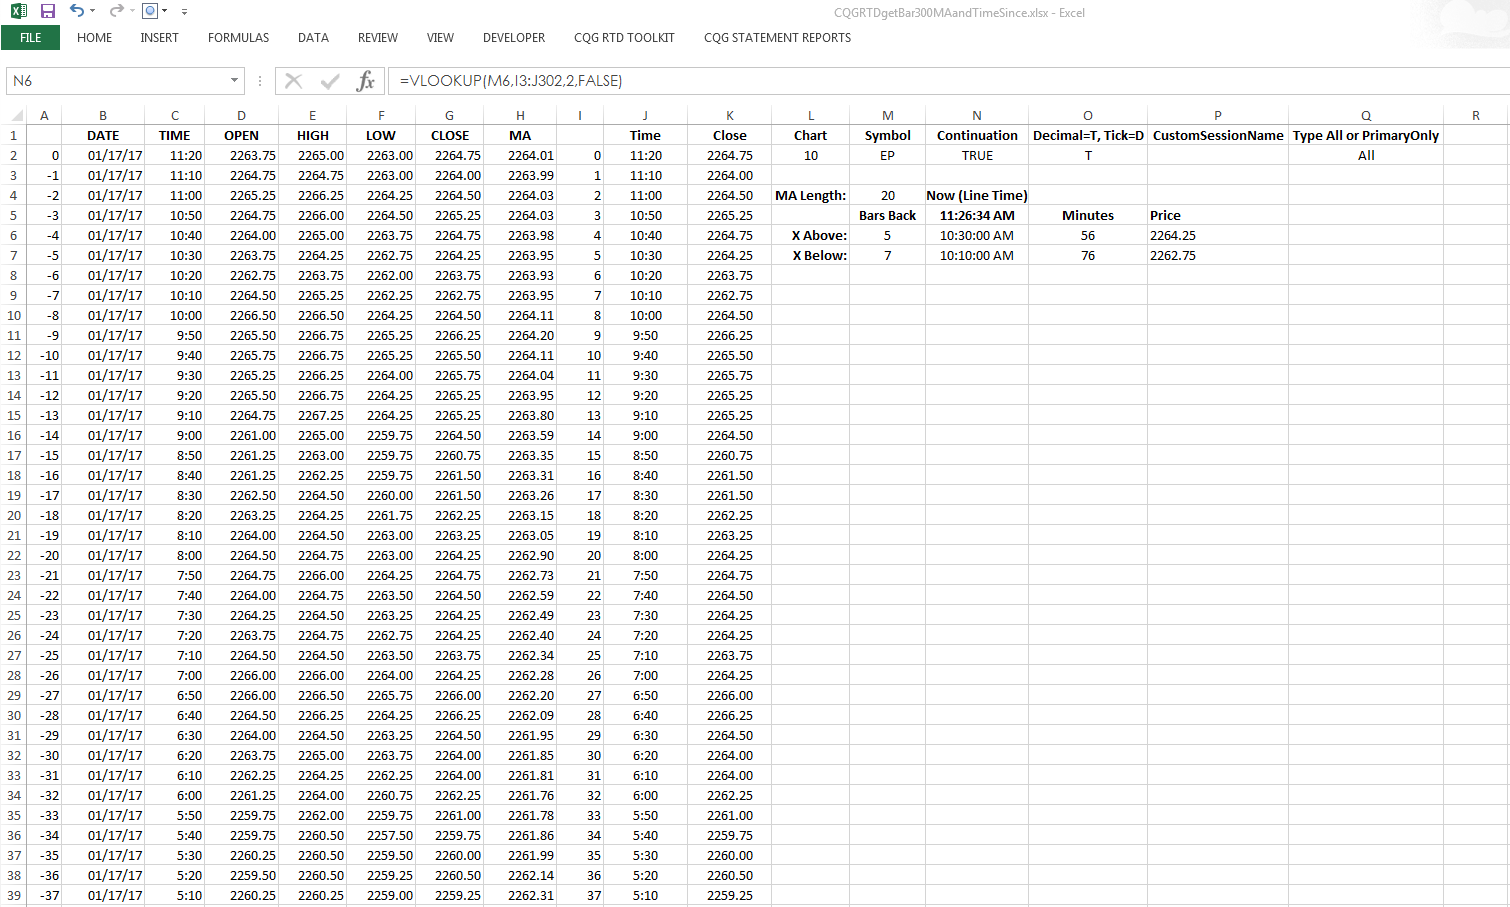
CQG formulas include a crossover feature, and CQG can determine the number of completed bars back since a signal occurred. For example, using “Barssince(EP xabove Ma(EP,Sim,20),1,300)” as the… more
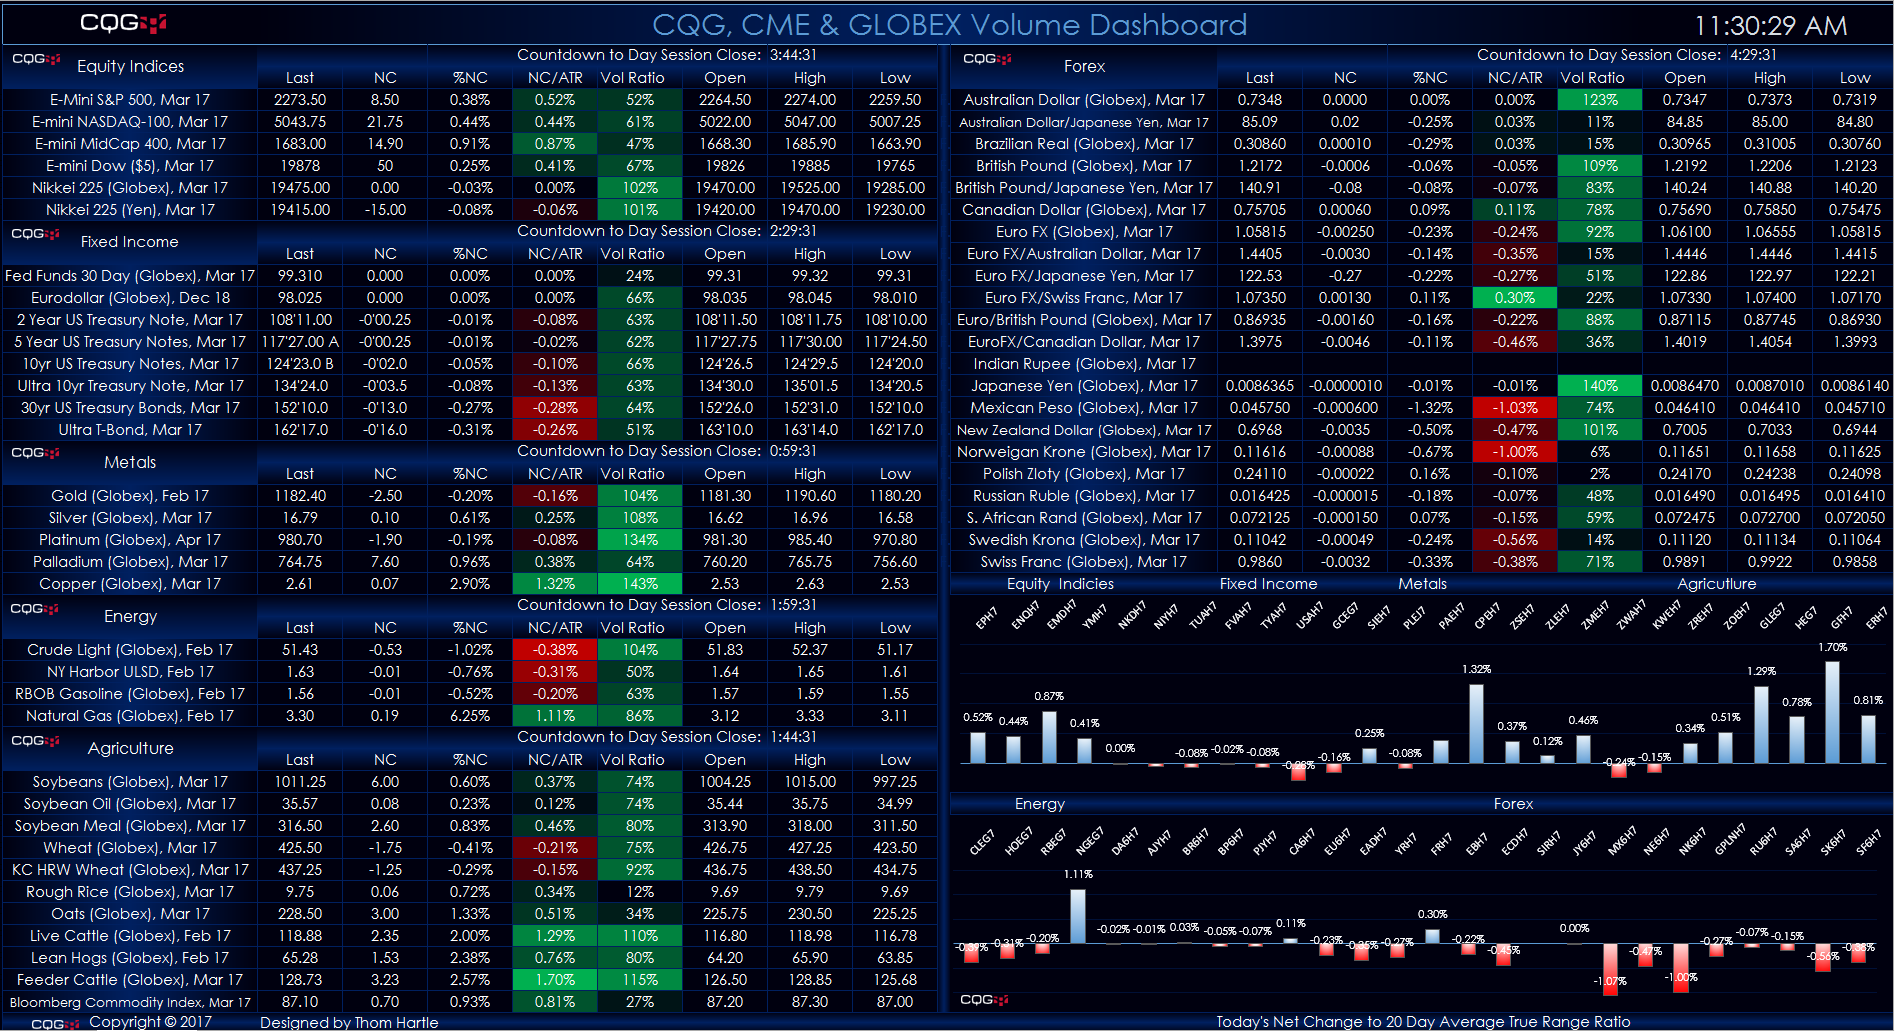
This Microsoft Excel® dashboard displays key market information for contracts traded on the CME Exchange and the Globex platform. The markets are grouped by these products:
Equity Indices… more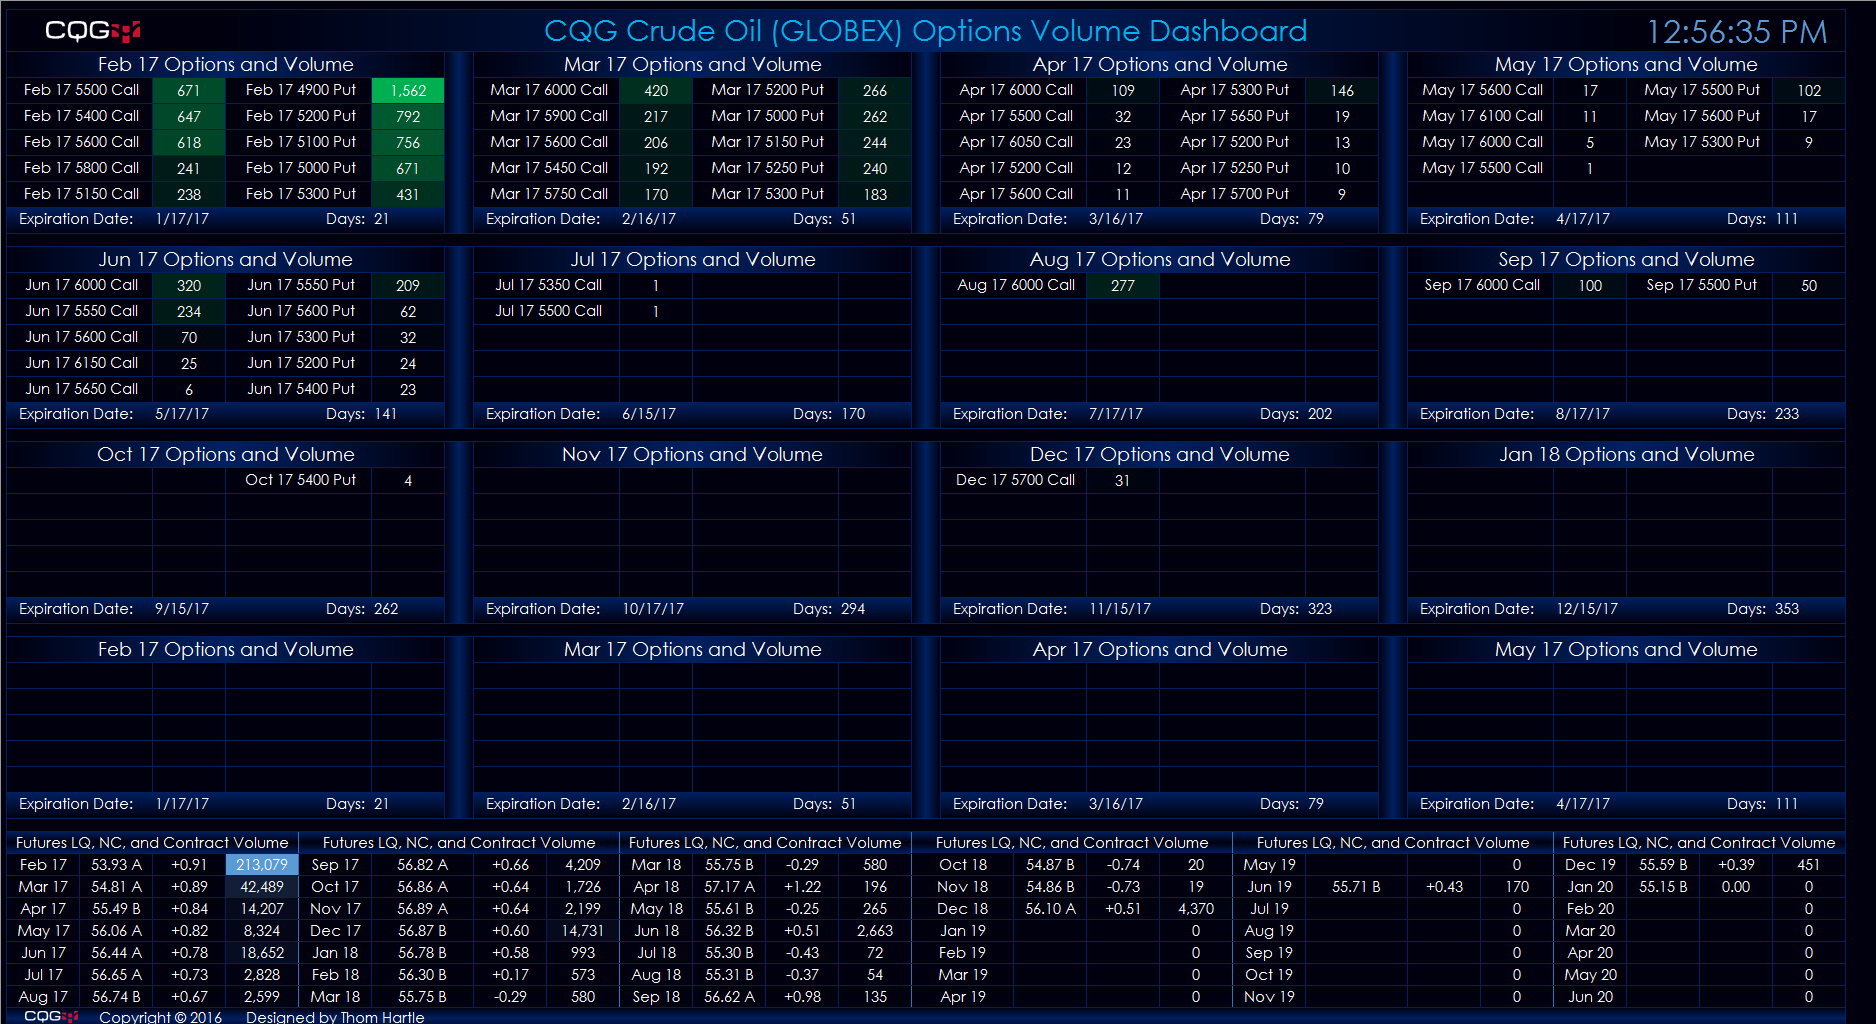
This Microsoft Excel® dashboard scans the crude oil (GLOBEX) futures market options for volume and ranks the traded volume for each expiry out to sixteen months. The scan covers options… more
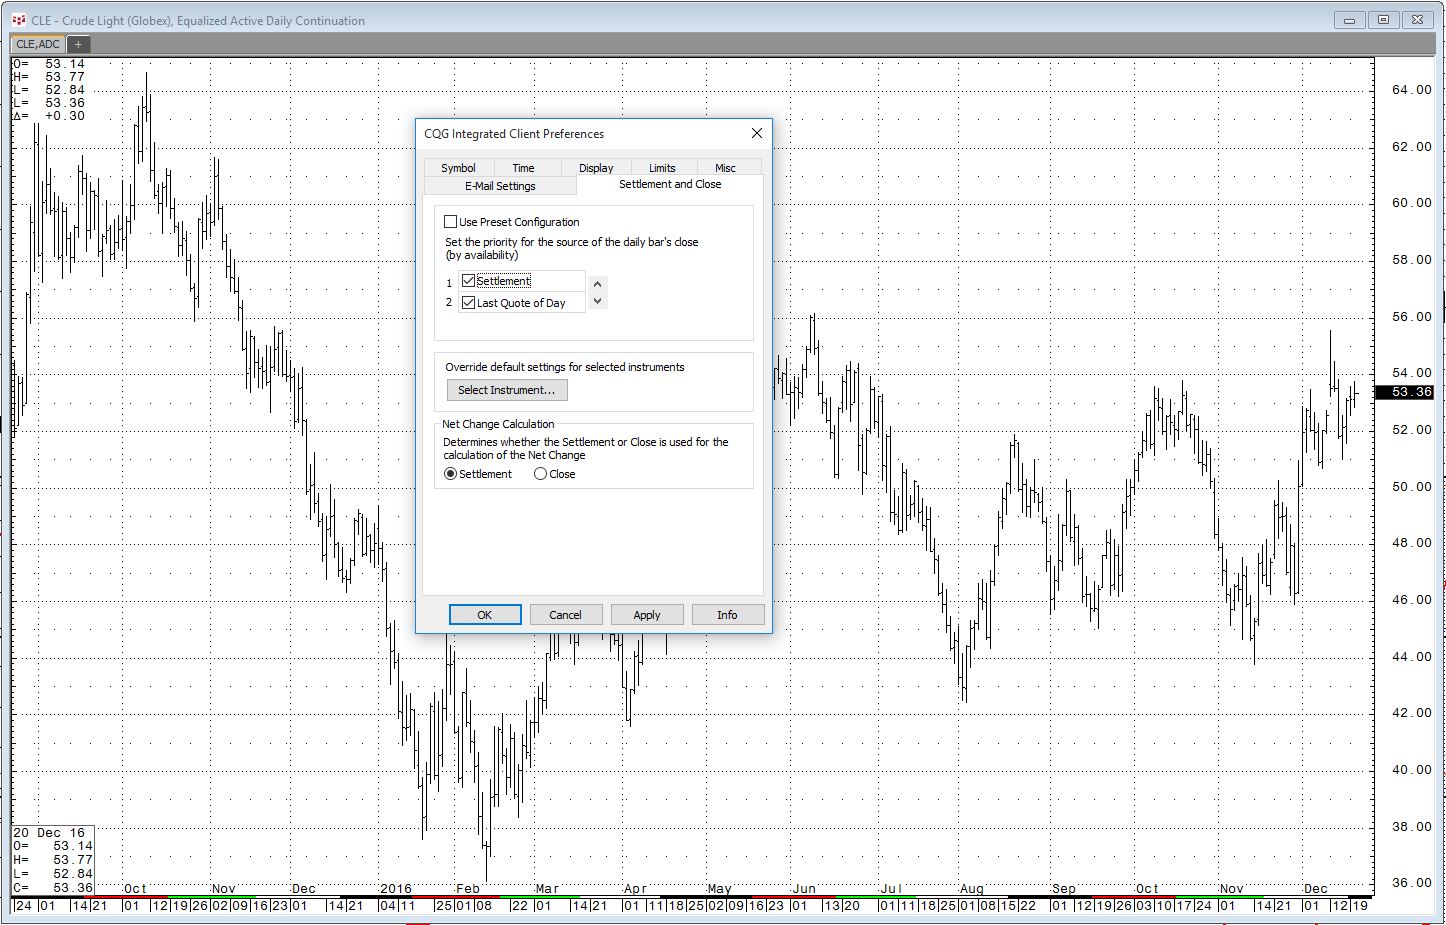
A common request is an RTD formula to pull historical settlement prices for a particular market. There is a “Contract Data” RTD formula for settlement:
=RTD("CQG.RTD", ,"ContractData", "CLE… more
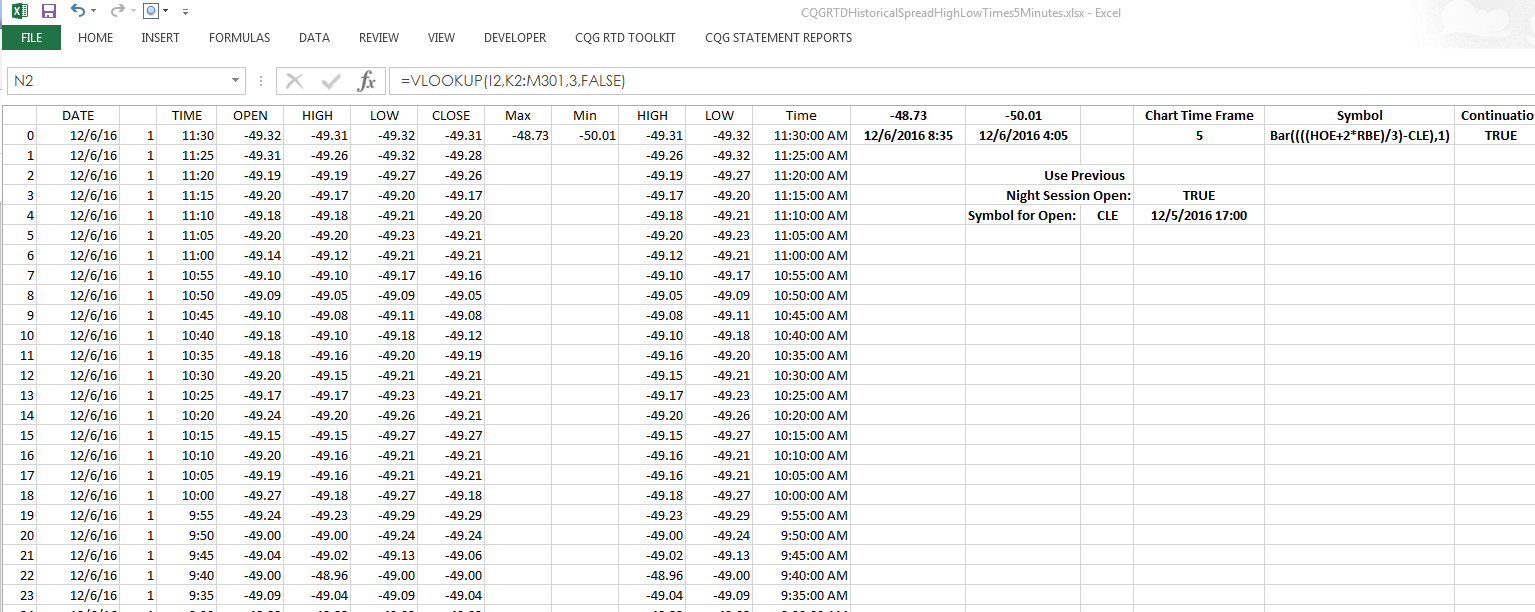
CQG Integrated Client and CQG QTrader customers can pull the time the high and low occurred during today’s session into a Microsoft Excel® spreadsheet using these RTD formulas:… more