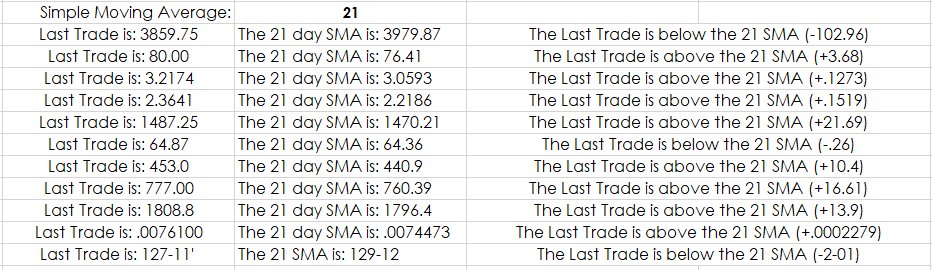
Microsoft® Excel has a Text function which is useful for combining text with market data. For example, you may want to have your Excel dashboard display in the same cell the percent net change… more
Thom Hartle
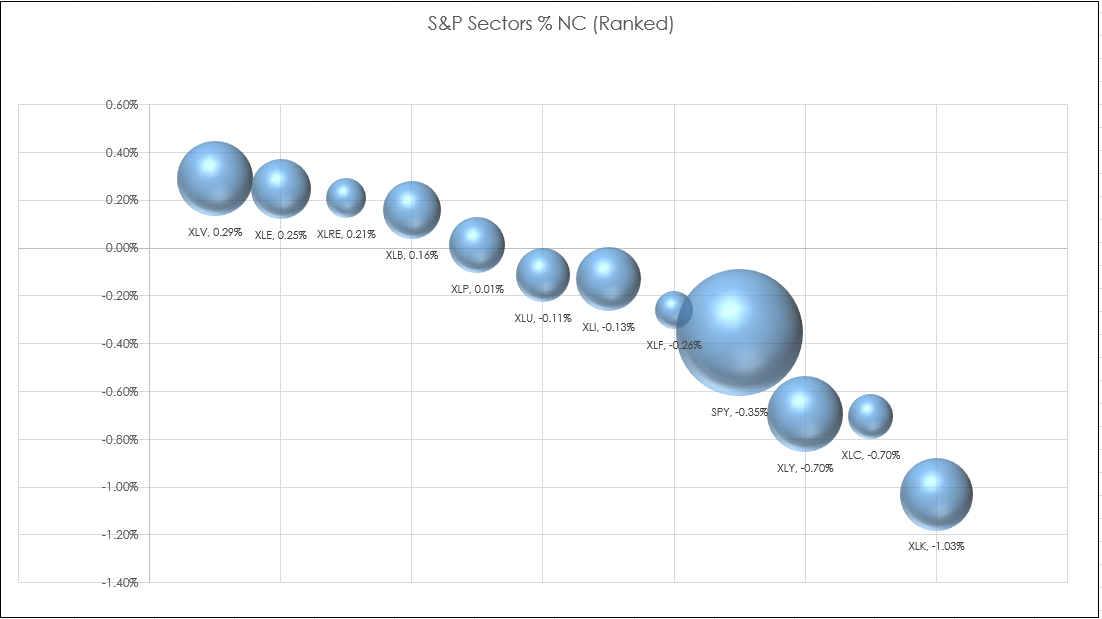
The Microsoft® Excel 3-D chart is different from the Excel Scatter Plot chart. The Scatter chart uses a fixed size for the chart data points. The 3-D chart accesses an additional column to set the… more
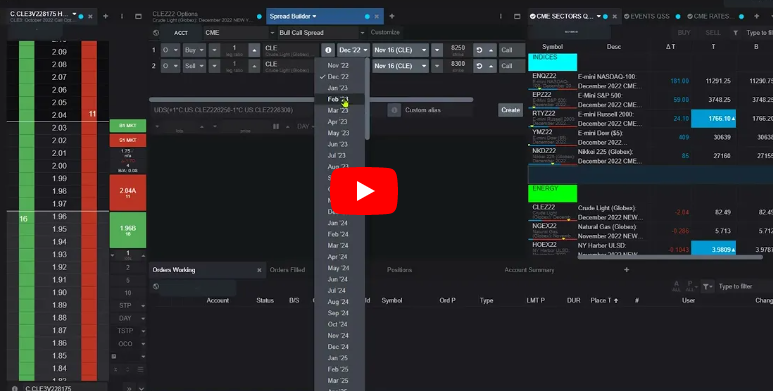
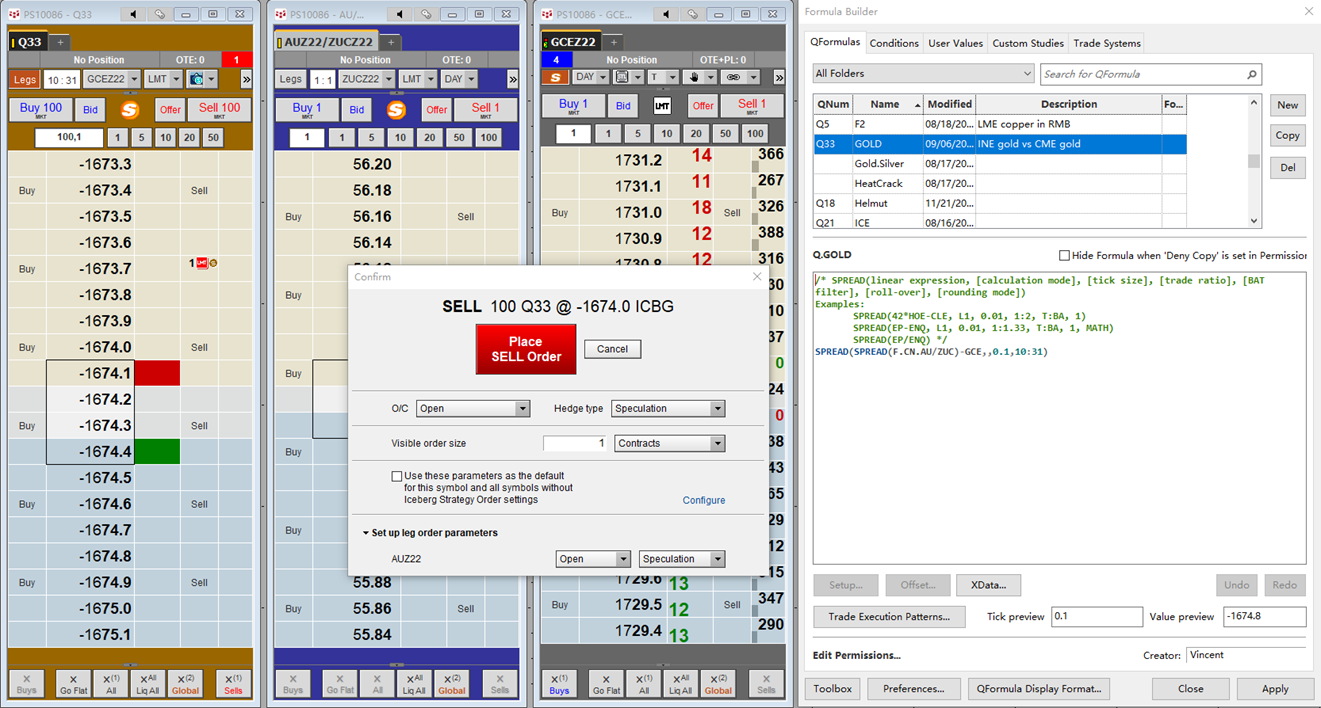
CQG One, the next generation flagship trading and data visualization product for the financial markets now offers the Spread Builder and User Defined Strategies (UDS).
Watch this video to… more
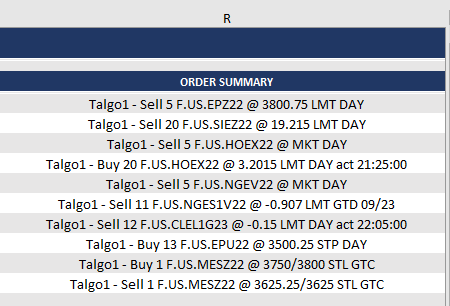
Here, we introduce placing Batch Orders using the CQG XL Toolkit. At the bottom of the post is a downloadable Excel sample. For more details there are two links to the CQG IC/QTrader Help files… more
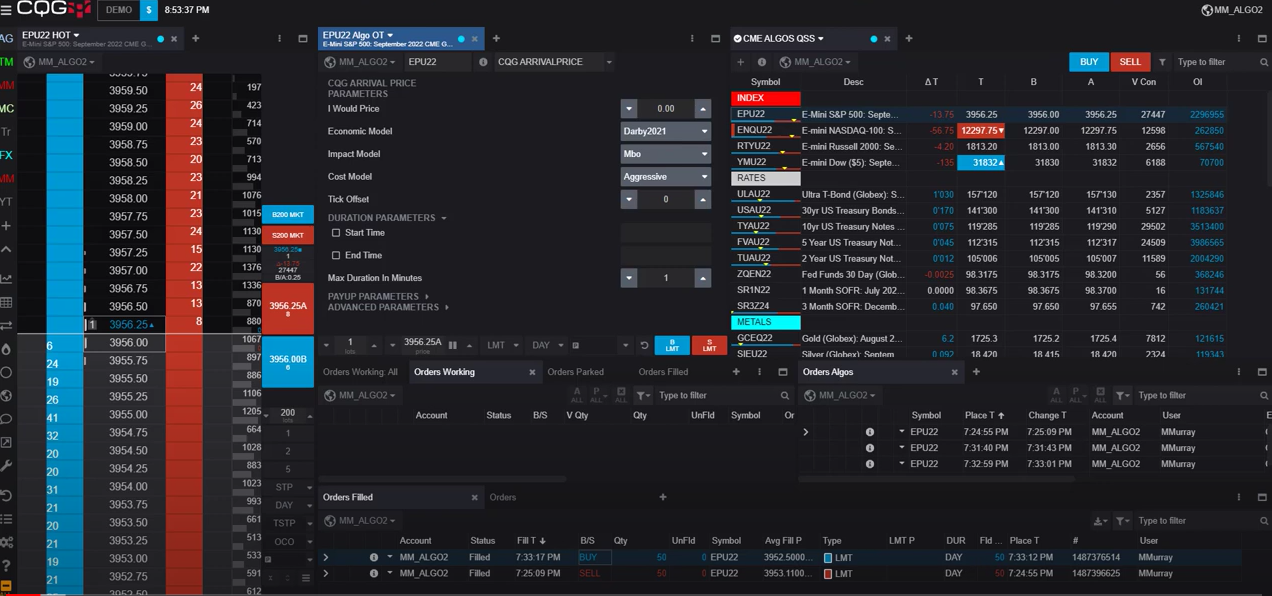
CQG One, the next generation flagship trading and data visualization product for the financial markets now offers access to CQG Algos.
Watch this video to learn about using CQG Algos to… more
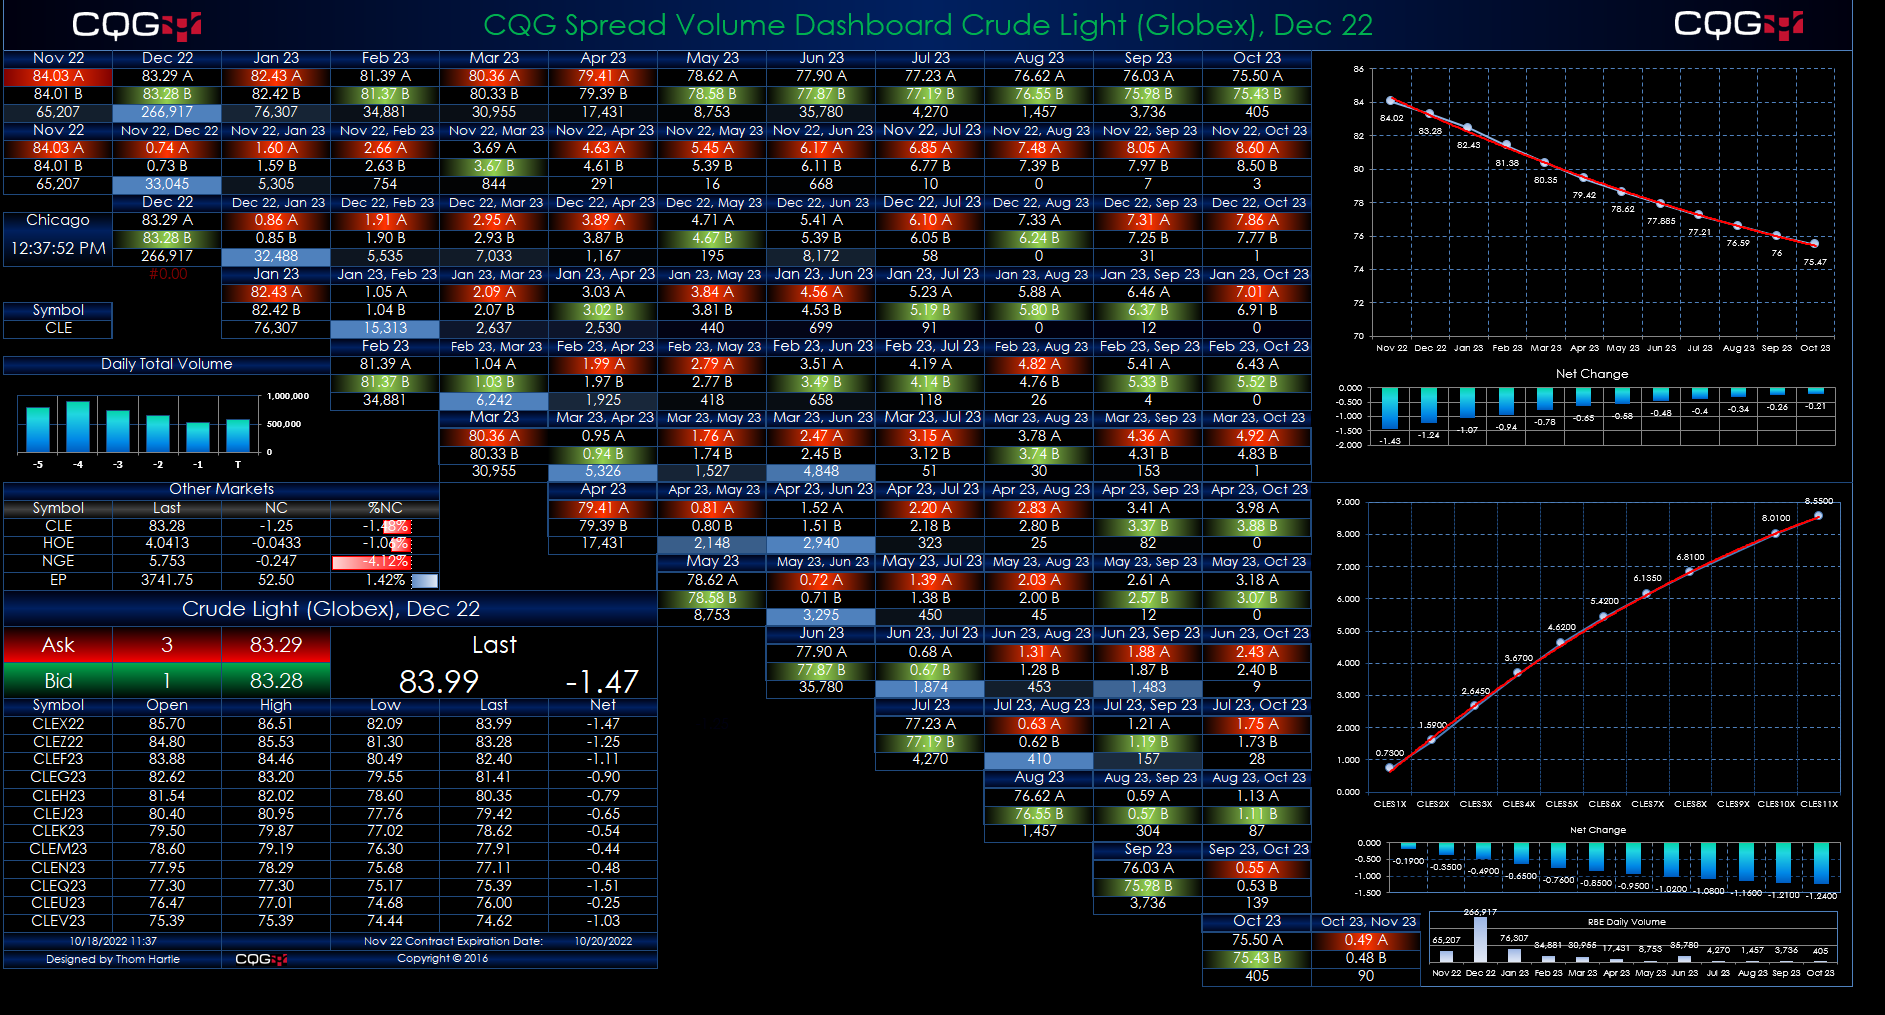
This Microsoft Excel® dashboard displays exchange traded spread market data for a user input symbol. The Excel dashboard uses the CQG RTD Toolkit Add-in, which is installed with CQG IC or CQG… more
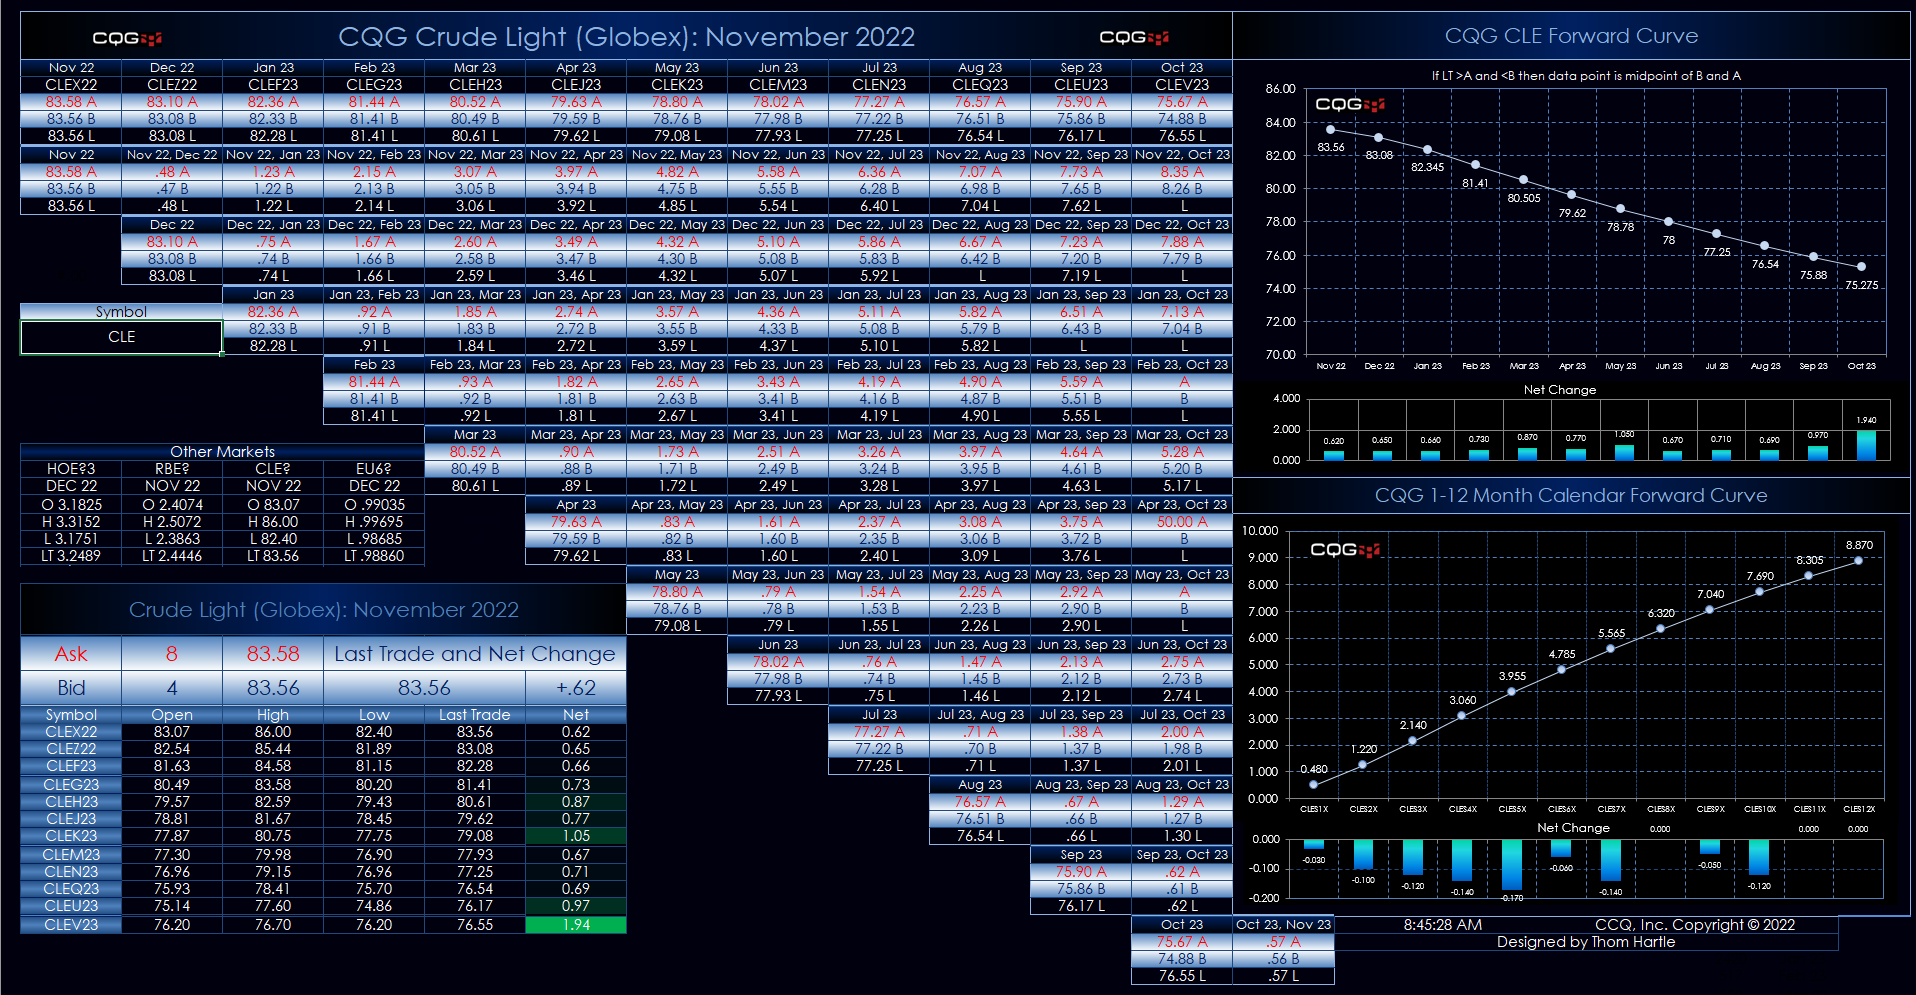
This Microsoft Excel® spreadsheet uses the CQG XL Toolkit to pull in market data based on the symbol entered by the user. The XL Toolkit requires the customer’s FCM enable it. The data is pulled… more
Shanghai Futures Exchange (SHFE) has announced approval for participation of Qualified Foreign Institutional Investors (QFII) and RMB Qualified Foreign Institutional Investors (RQFII) in commodity… more
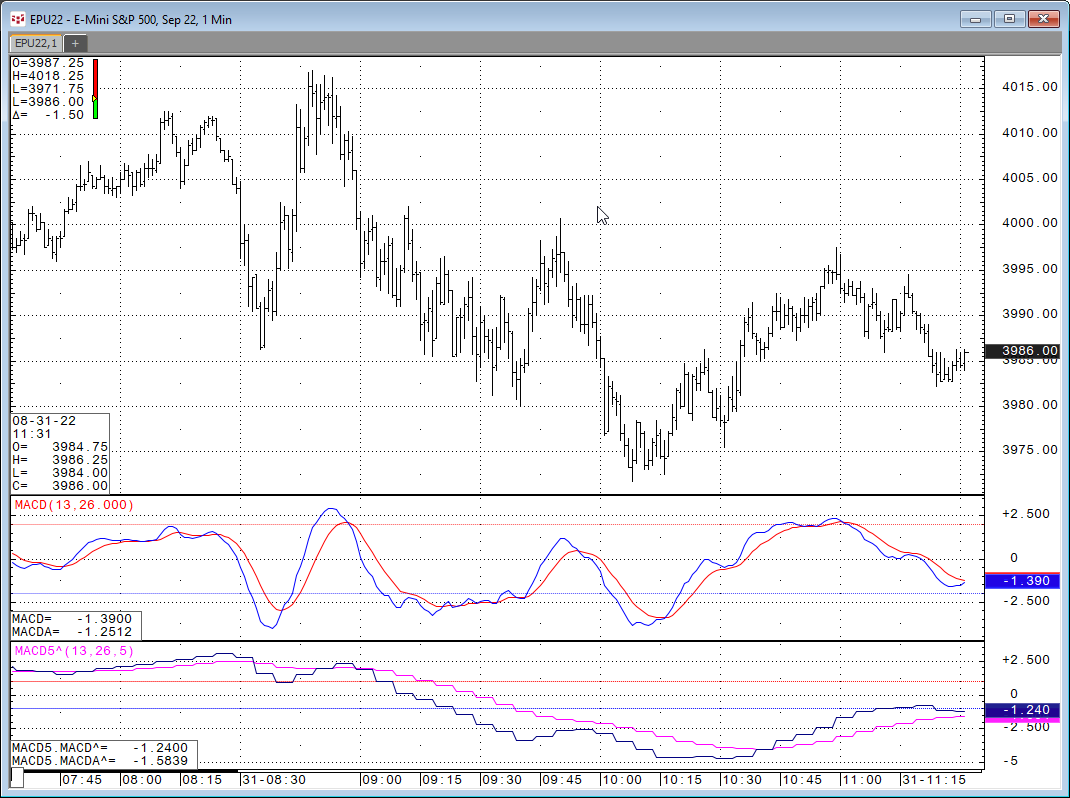
Let's say you want to look at a study on a chart but you want the study to use a different time frame than the time frame for the bars. For example, the MACD Study on a 1-minute chart using 5-… more
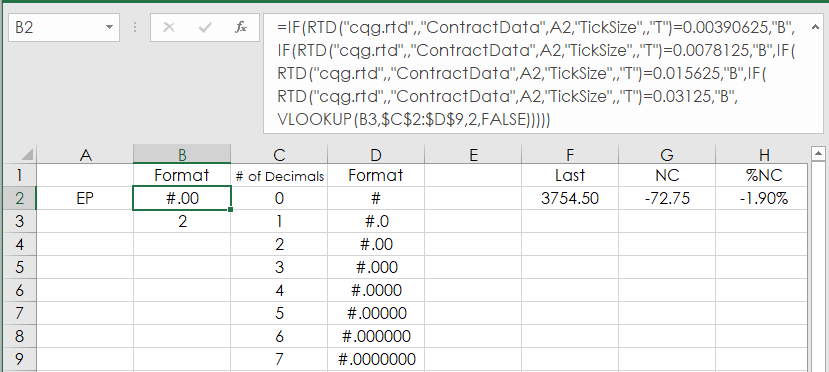
When using RTD functions in Excel to pull in market prices you have to manually format the prices. Excel does not know that the E-mini S&P 500 price has two decimals places (i.e. 3909.25) and… more