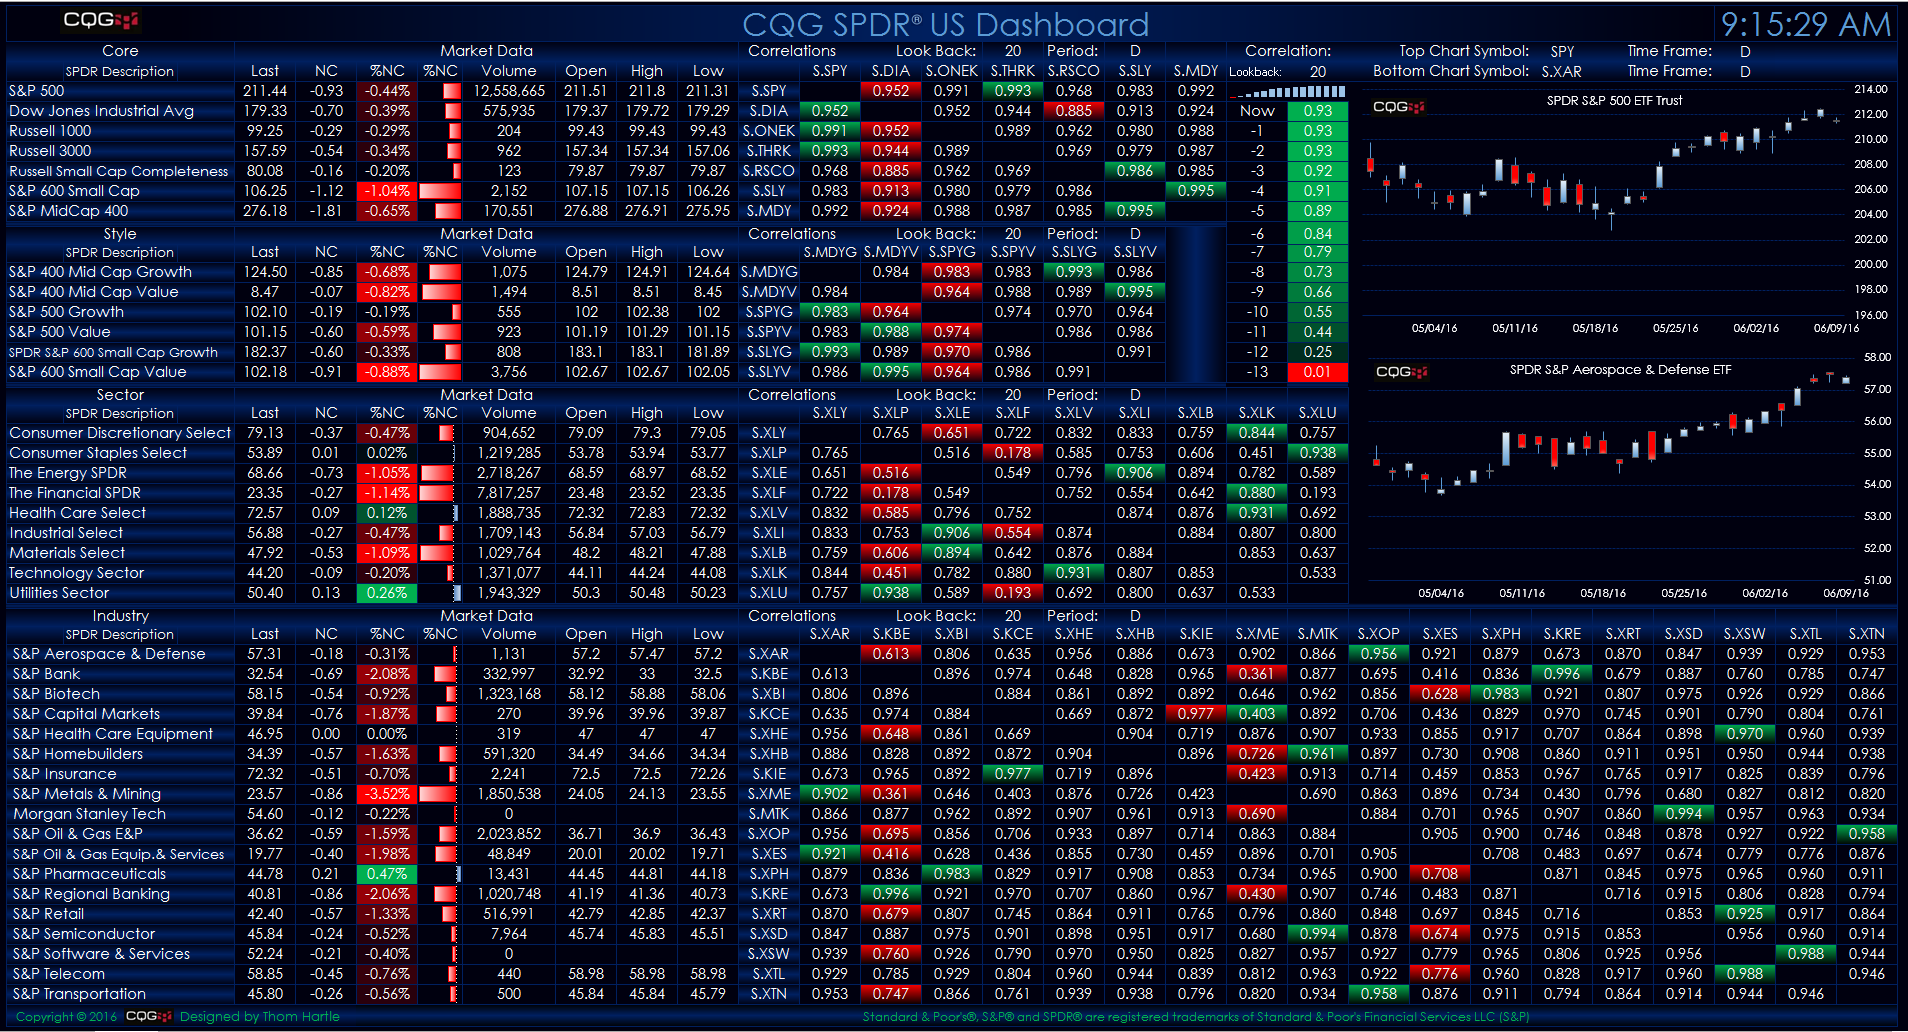
This Microsoft Excel® dashboard displays market data and correlations of US equity SPDR® (Standard & Poor's Depositary Receipts) ETF products. The ETFs are grouped by Core, Style, Sector, and Industry.
You can enter a time frame and a lookback period for the correlation analysis. Some ETFs do not actively trade throughout the day; therefore, some correlations will be blank if you use a low time frame such as five minutes. The single top and bottom correlated ETFs are highlighted in green and red by row.
You can visually track two markets with charts, and the recent correlation values are displayed next to the charts.
Standard & Poor's®, S&P® and SPDR® are registered trademarks of Standard & Poor's Financial Services LLC (S&P).