CQG Product Specialist Stan Yabroff designed a CQG page for customers to track and analyze a market’s implied volatility and historical volatility. This post details the features and functionality of the CQG page.
The benefit of this CQG page is you can quickly identify across a large portfolio of markets opportunities based on high and low implied and historical volatilities.
First, let’s define historical volatility and implied volatility. Historical Volatility measures the market’s past volatility. It is defined as the standard deviation of a series of price changes measured at regular intervals. CQG has the Historical Volatility study (HVol).
Implied Volatility is the amount of volatility assumed by the market. Rather than using a simple Standard Deviation-based formula, like Historical Volatility, Implied Volatility plugs several variables, such as actual option price, underlying price, strike price, and expiration date, into the selected model and solves for the volatility. Thus, this value represents the volatility implied by the other variables.
CQG’s Implied Volatility Study (ImpVol) uses the volatilities implied by the Cox-Ross Rubenstein model, which calculates implied volatilities by taking weighted averages of some of the possible underlying expiration prices.
The downloadable CQG Page (PAC) utilizes these two studies throughout and are the basis for numerous conditions.
The CQG Page consists of two Portfolio Monitors (PM) and for CQG IC two charts and for QTrader just one chart.
The 250 Days Lookback PM
The monitor displays the symbol, the last price and the last price net change. Then, the monitor is divided into two sections: Historical Volatility and Implied Volatility. Each section is divided into three columns. The Historical Volatility section displays:
- The first column displays the highest historical volatility in the last 250 sessions.
- The second column displays the current historical volatility.
- The third column displays the lowest historical volatility in the last 250 sessions.
Similarly, the Implied Volatility section displays:
- The first column displays the highest implied volatility in the last 250 sessions.
- The second column displays the current implied volatility.
- The third column displays the lowest implied volatility in the last 250 sessions.
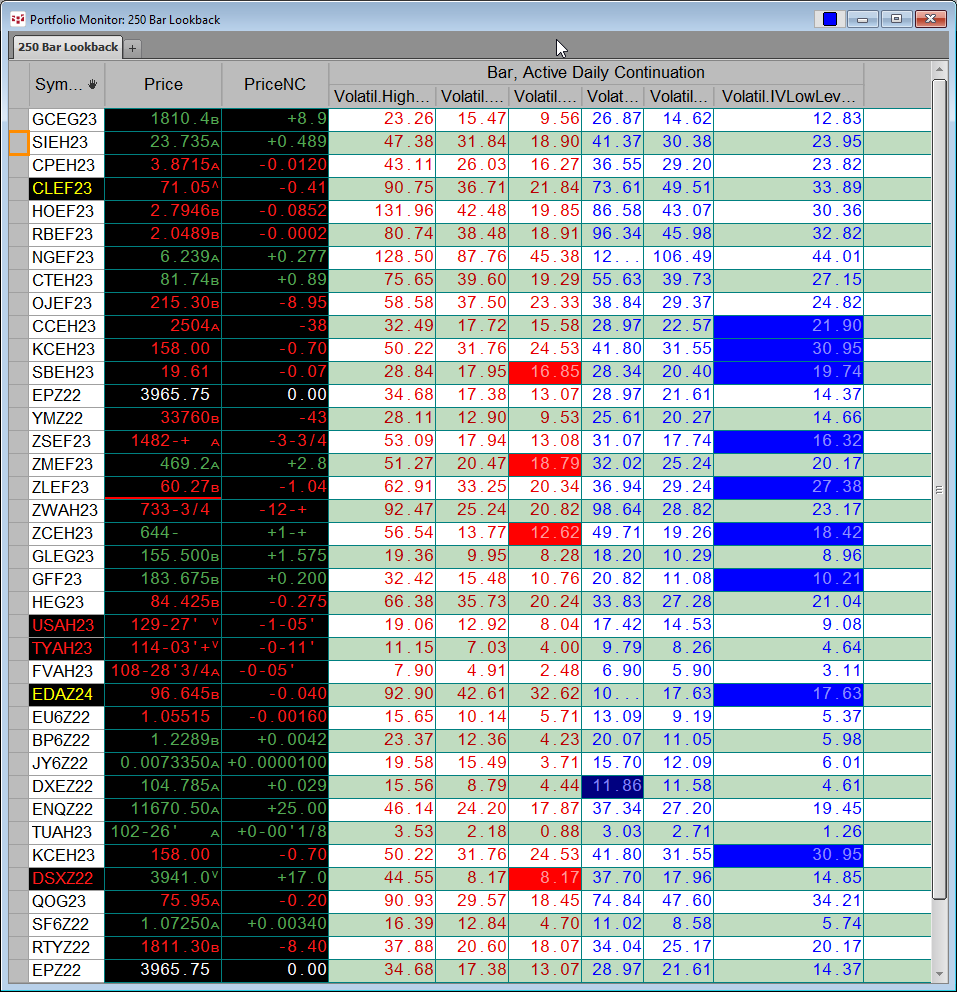
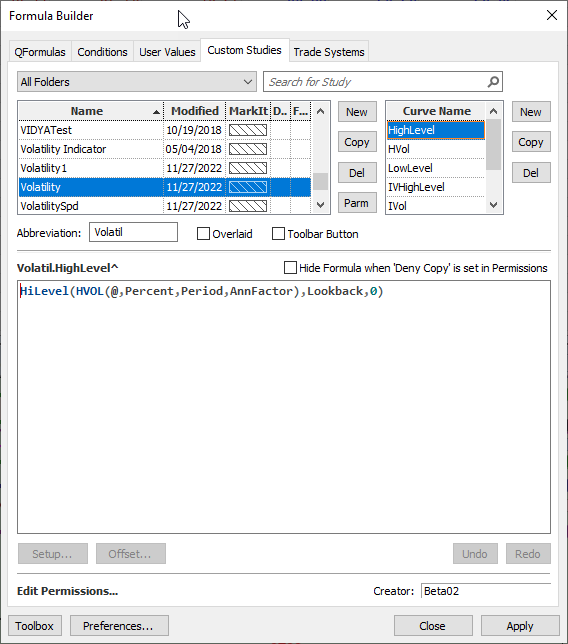
The Portfolio Monitor displays study values for each symbol from the Volatility custom study group. More details are available by selecting the group and then the curve name in the CQG Formula Builder.
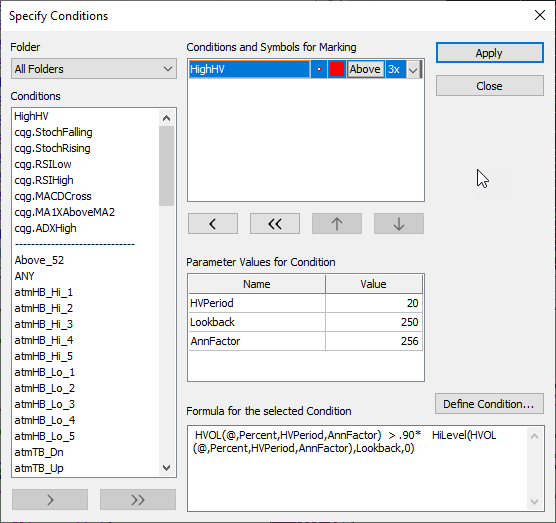
The Portfolio Monitor also has a set of conditions that highlight a cell with a color if the condition is met.
The following conditions are used in the Portfolio Monitor: HighHV, LowHV, and HighIV and LowIV.
The first two use the HVol study and the second two use MIVClose from the ImpVol study referenced above. The conditions are highlighting high and low historical volatility and high and low implied volatility readings.
The second portfolio monitor is the same except the lookback periods are 1,000 daily bars instead of 250 daily bars.
The 250 Days Lookback Chart
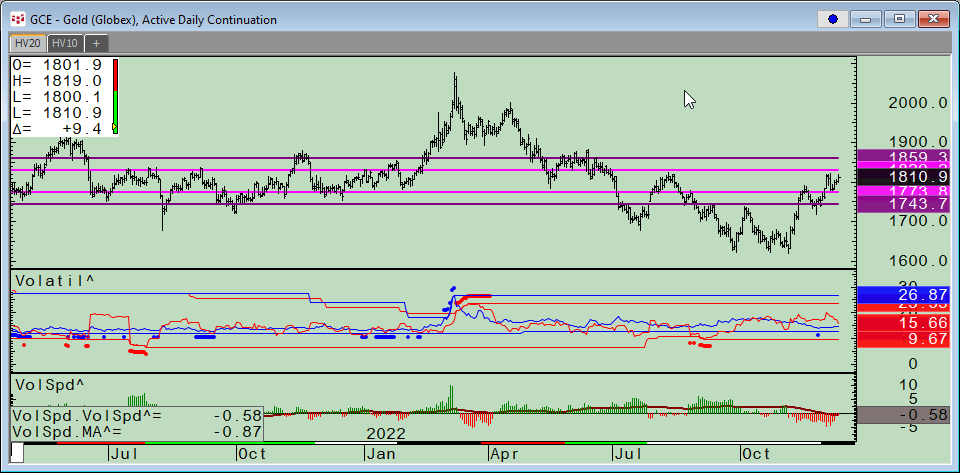
The price chart pane has three custom studies that are horizontal lines using the Signal Value Propagator function.
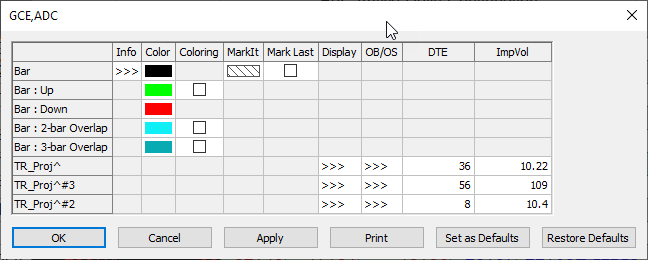
The RanProj curve is from the IV_TRangeProjection custom study. The TR_Proj#2 and the TR_Proj are two versions of the IV_TRange custom study. The three studies use the MIVClose study to generate price levels based on the current implied volatility of the market. The three custom studies display the output as fixed lines on the chart.
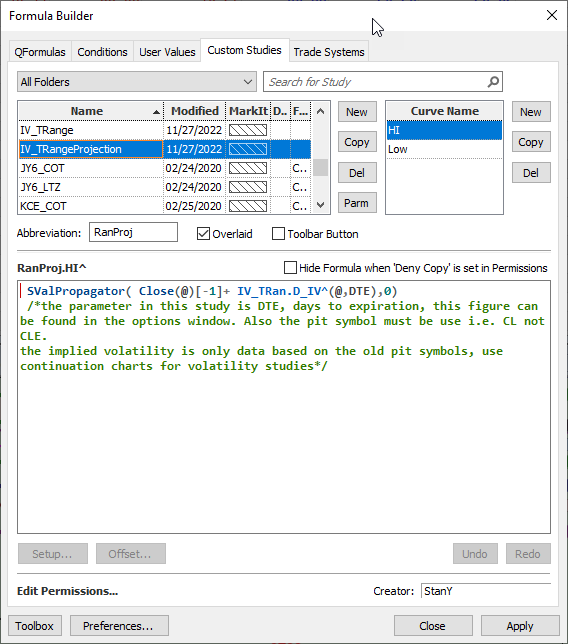
Below details parameters used in the custom study.
The middle pane in the chart displays the current and past six values of the custom studies from the portfolio monitor for both the historical volatility and the implied volatility. In addition, the same conditions used in the portfolio monitor are applied to the chart.
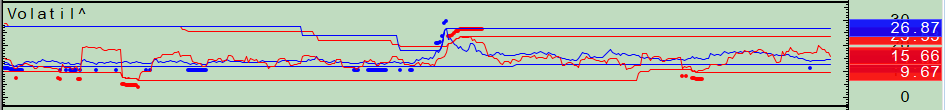
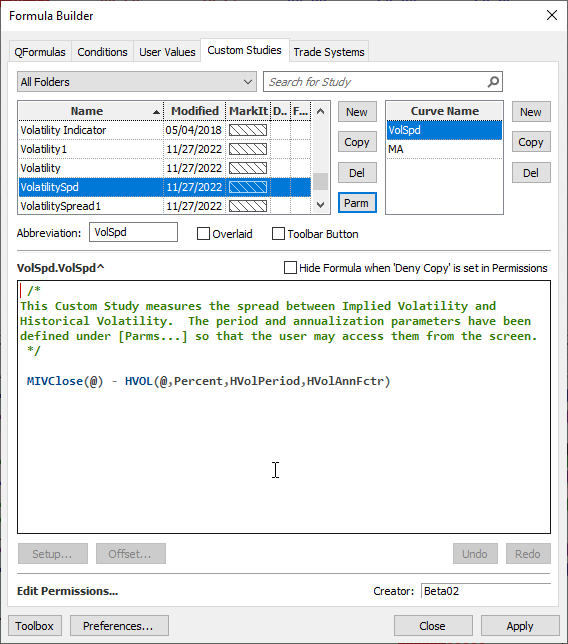
The bottom pane is the Volatility Spread custom study. This study displays as histograms the difference between the implied volatility and the historical volatility along with a moving average of the spread.

The second chart available to CQG IC users is the same as the 250 days chart except it uses 1,000 days lookbacks.
Utilizing this page can alert the trader to relative high or low readings in historical volatility and implied volatility and then an appropriate option strategy can be employed.
The downloadable PACs are not password protected allowing you to fully learn the details about the customs studies and conditions.