The Spread Bar chart displays spread bar values based on a user set parameter for snap shots at certain intervals.
This is a superior method to simply plotting the spread prices. For example, the crack spread 42*HOE-CLE when entered as a symbol on a bar chart is converted into a line chart.
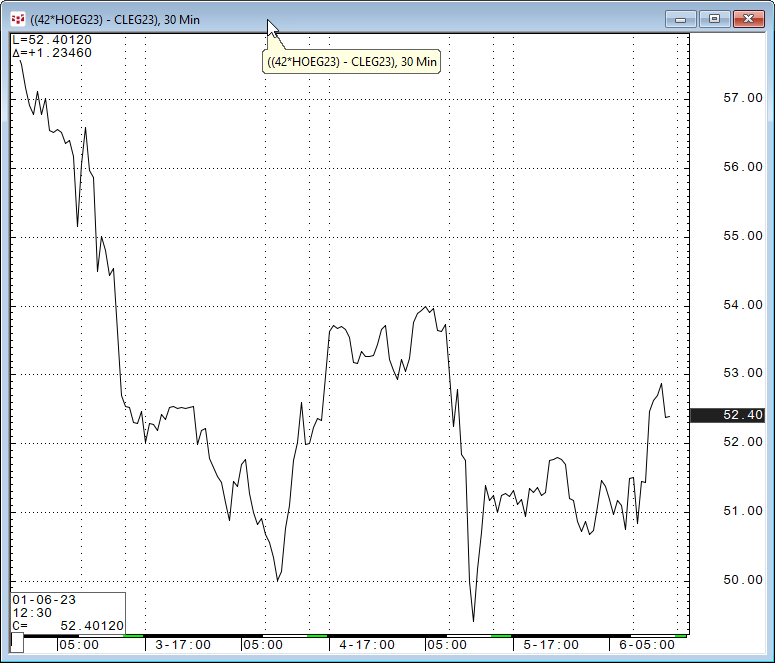
Also, if you were to simply use the two contacts high and low for the session there could be a problem if the two markets hit their respective highs and lows at different times during the session. The snap shop feature insures a more accurate view of the price action of the spread.
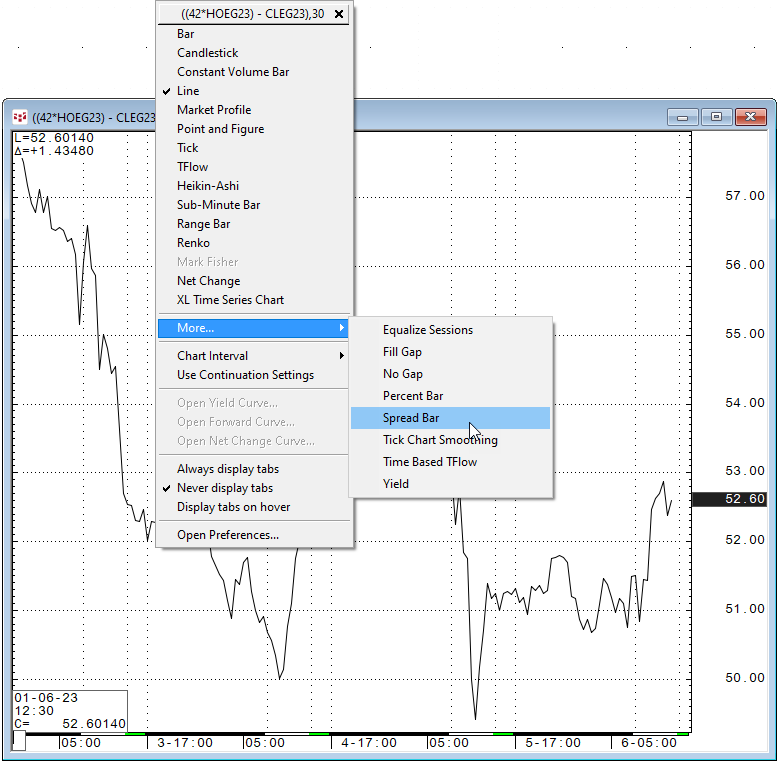
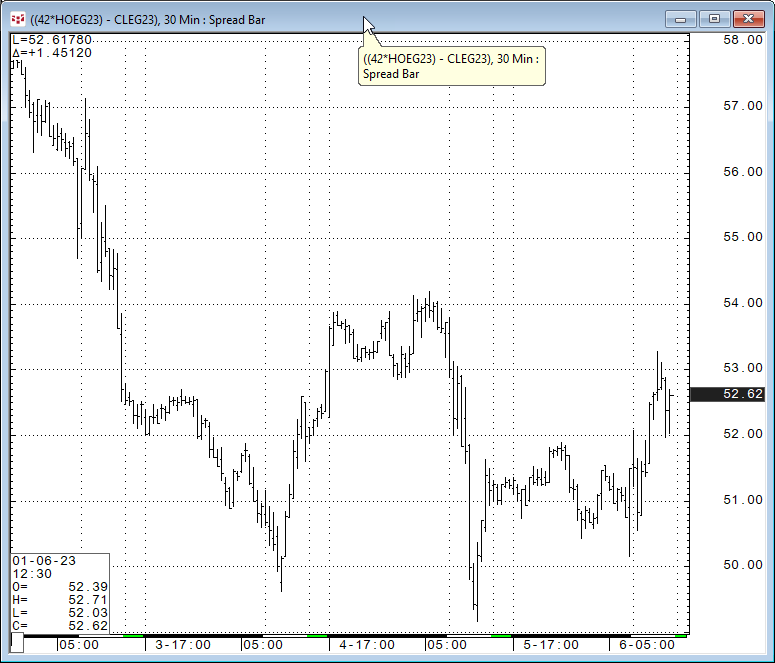
By converting the chart type to a Spread Bar then the Spread Bar open, high, low and close chart is displayed.
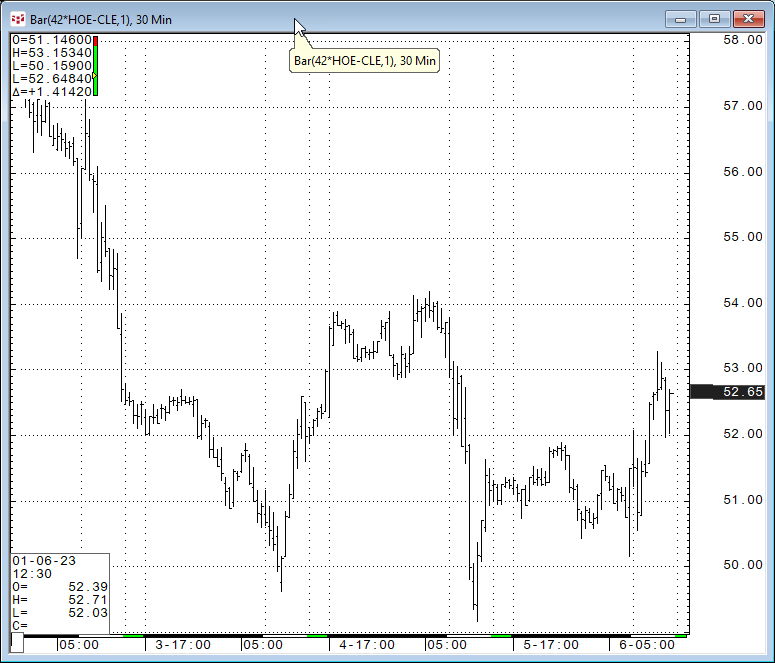
Below the chart is a 30-minute Spread Bar chart of the spread.
The Spread Bar chart creates a bar by taking the value at the user set intervals smaller than the chart interval and creating a range. A spread bar chart allows you to set the interval, allowing for more granularity.
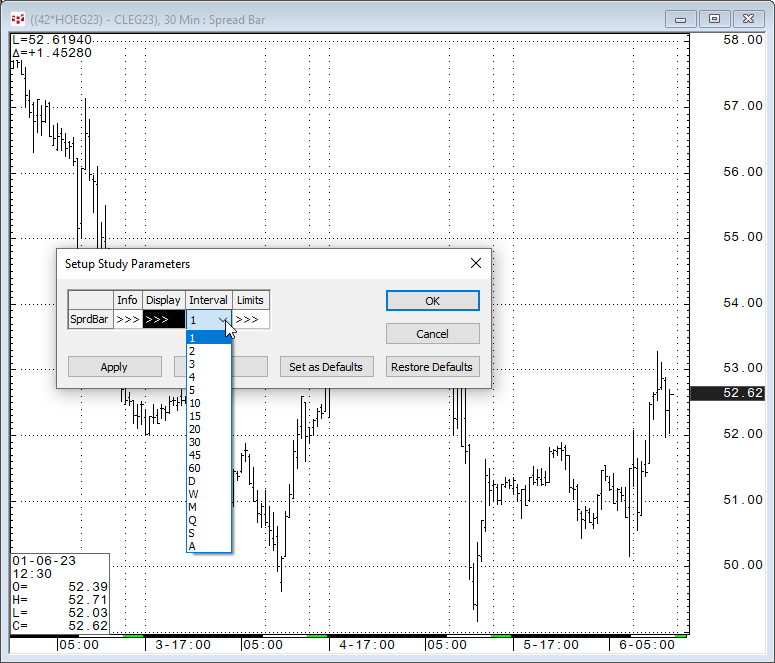
Interval choices Minutes: 1, 2, 3, 4, 5, 10, 15, 20, 30, 45, 60
And: Daily, Weekly, Monthly, Quarterly, Semi-Annual, Annual.
There is an additional way to pull up a bar chart that has the same interval parameter feature by passing the interval parameter as part of the symbol.
For example: Bar(42*HOE-CLE,1) when entered for a 30-minute bar chart returns a bar chart which would represent the crack spread every 1-minute summed up over a 30-minute period. The interval included in the symbol from the same list of values from above.
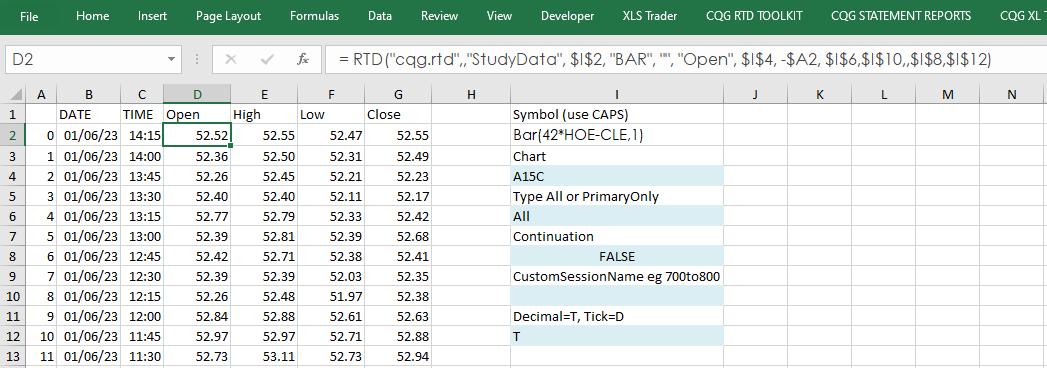
In addition, the symbol “Bar(42*HOE-CLE,1)” can be used in Excel for pulling Spread Bar data using RTD formulas and is discussed in this post.
Finally, you can use your favorite price-based studies for further analysis, The downloadable sample CQG PAC has four Spread Bar Charts using different time intervals.