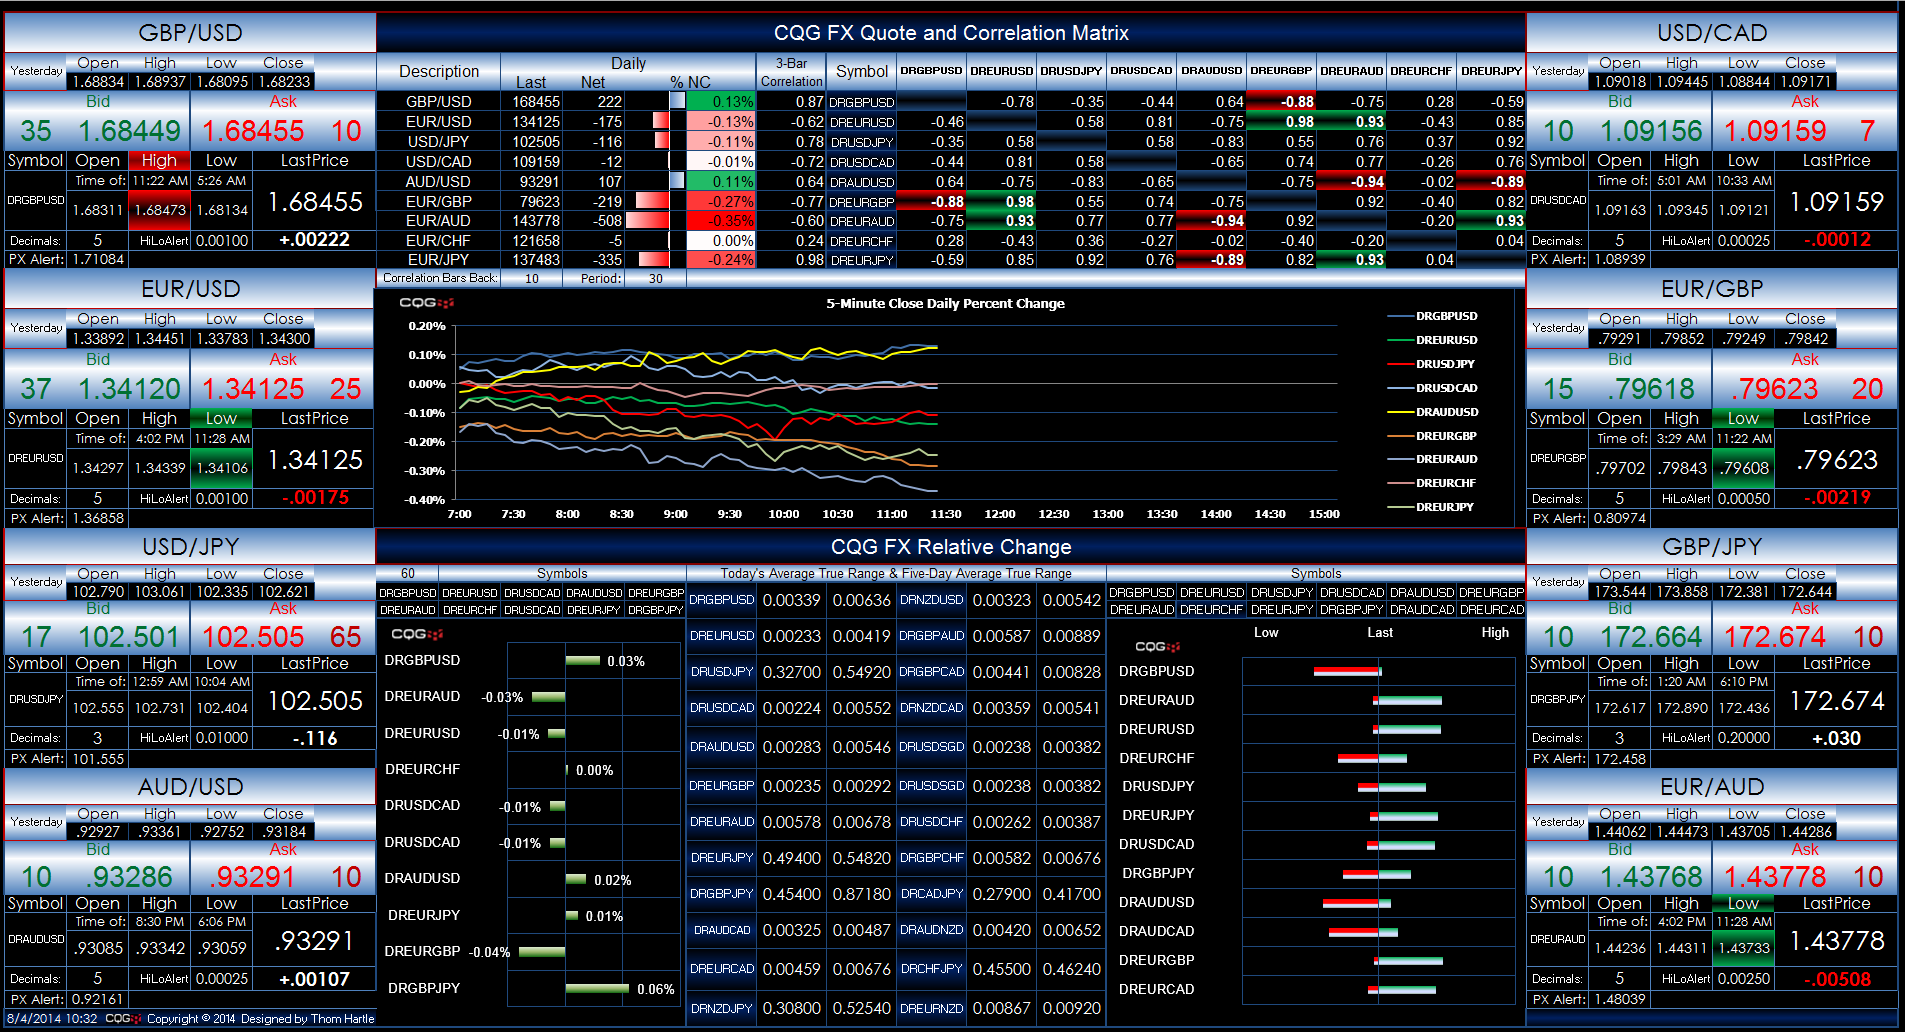
CQG FX supports the RealTimeData (RTD) function for delivering market information, study data, and other information to Microsoft Excel®. By partnering CQG FX with Excel, you can design dashboards to your specific requirements and make your workflow more efficient. Download this free dashboard designed to run with CQG FX. Features include:
- Depth-of-market data
- Heat-mapped correlation matrix
- Five-minute percentage net change chart
- Average true range comparisons
Make sure to lower your Excel RTD throttle to 0 to 50 milliseconds. Learn how to do that here.
Requirements: CQG FX, data enablements for all symbols displayed in this spreadsheet, and Excel 2010 or more recent.