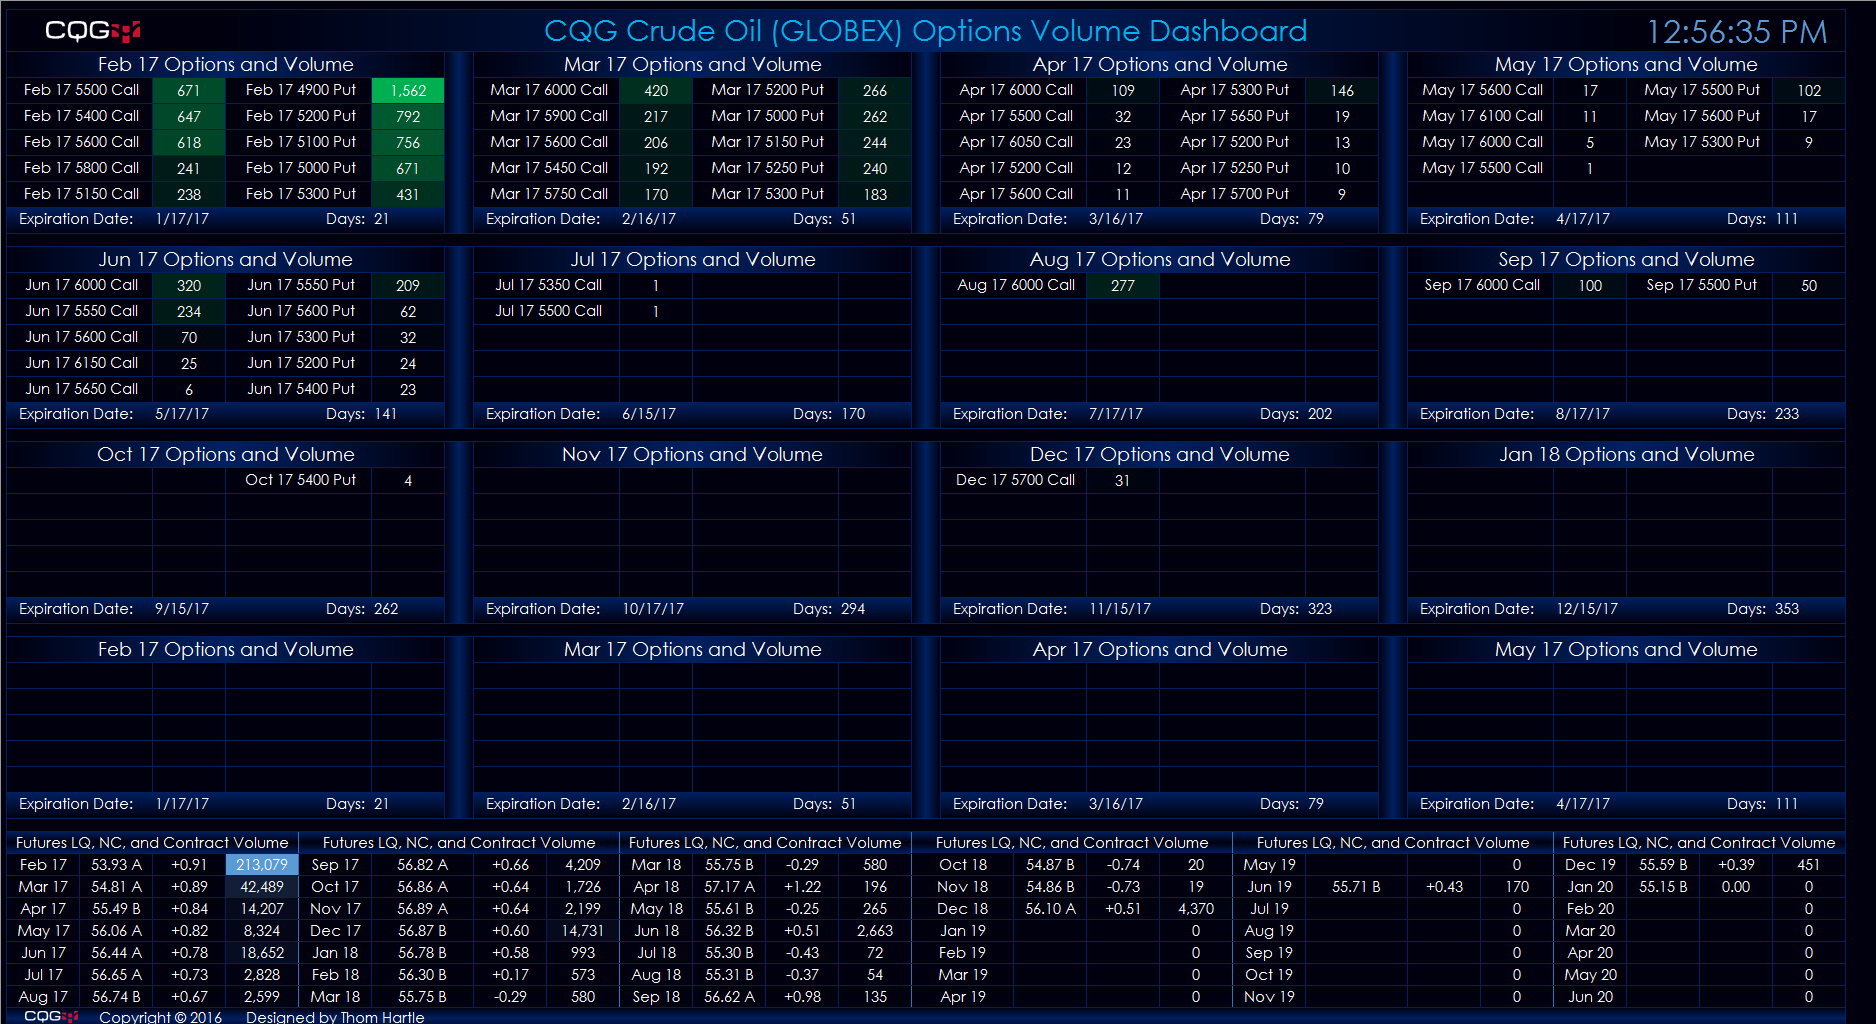
This Microsoft Excel® dashboard scans the crude oil (GLOBEX) futures market options for volume and ranks the traded volume for each expiry out to sixteen months. The scan covers options… more
Workspaces
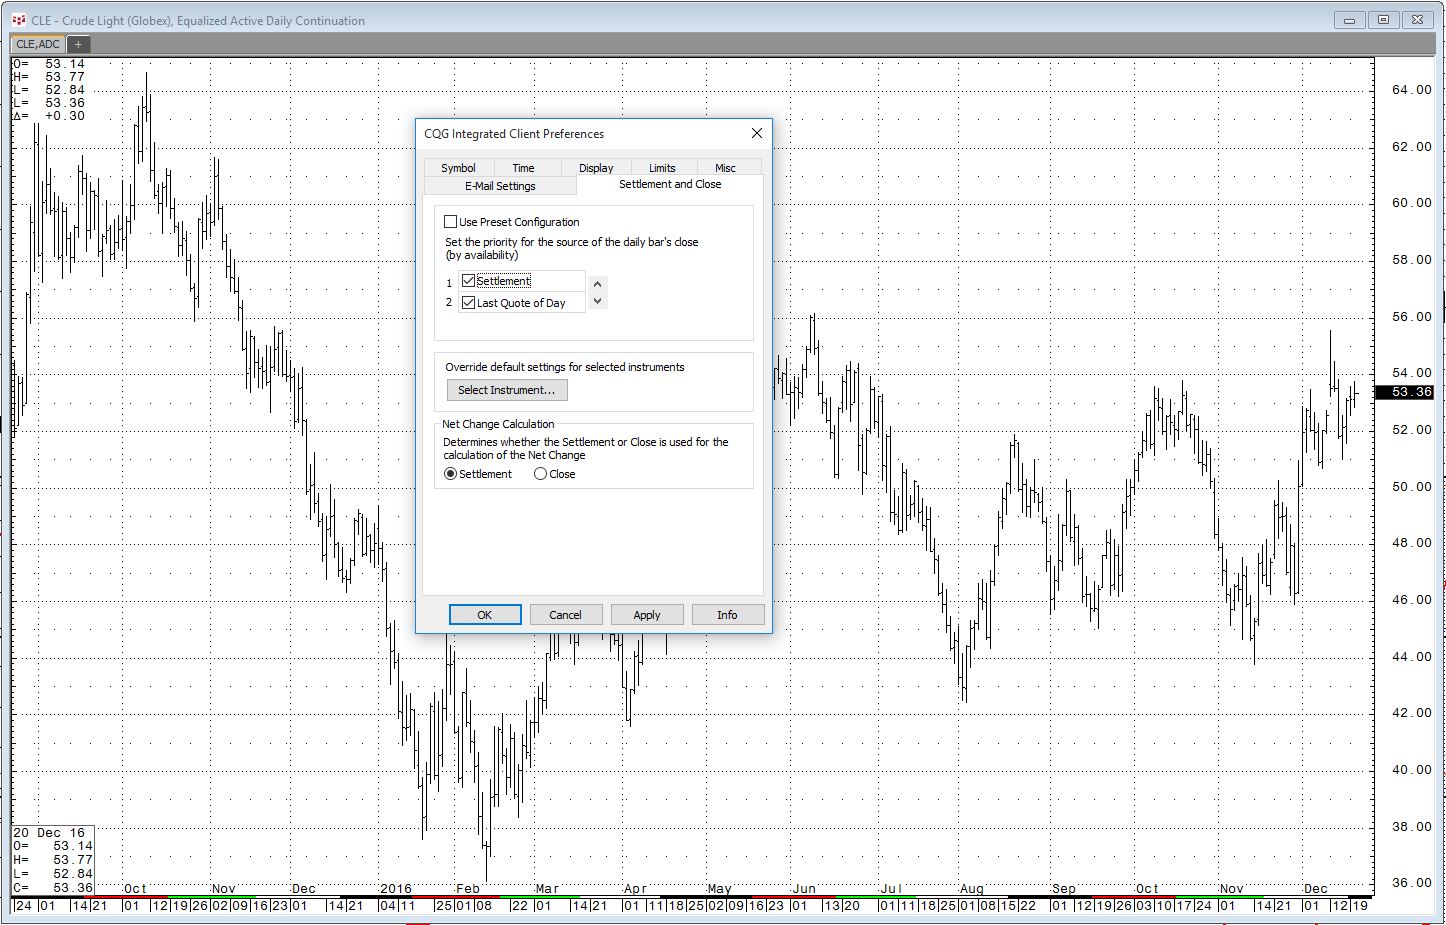
A common request is an RTD formula to pull historical settlement prices for a particular market. There is a “Contract Data” RTD formula for settlement:
=RTD("CQG.RTD", ,"ContractData", "CLE… more
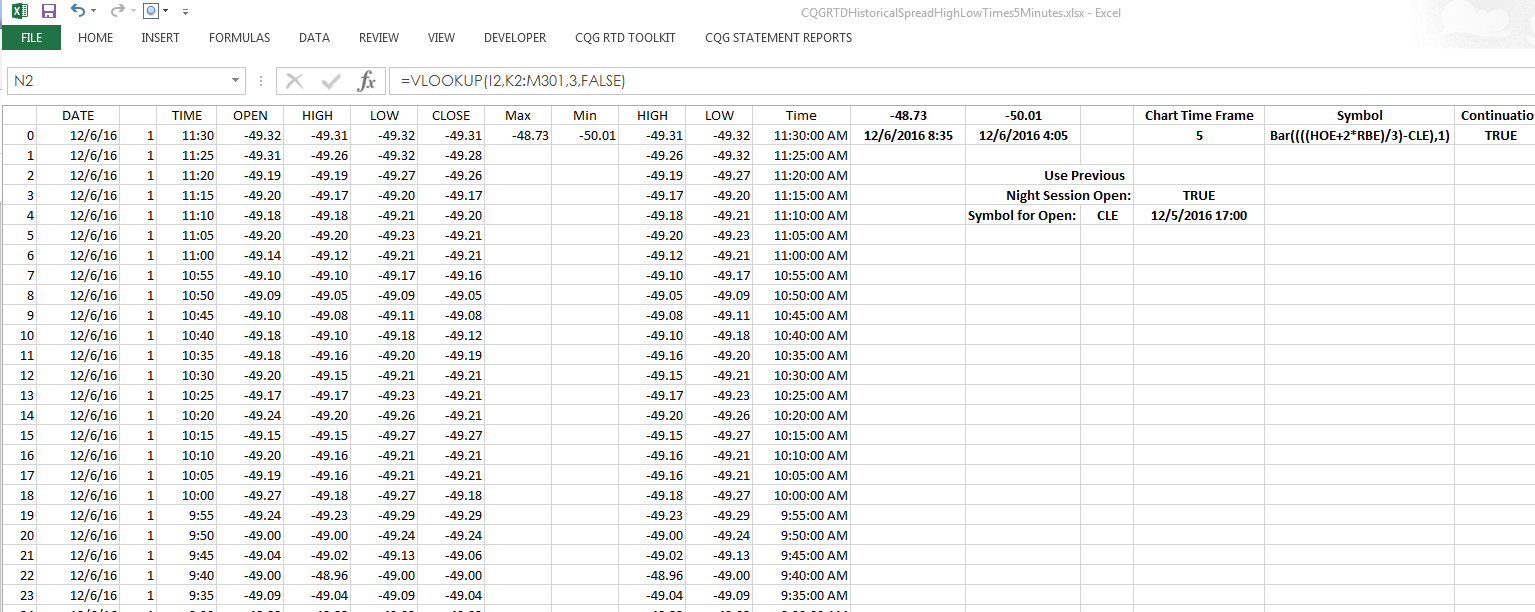
CQG Integrated Client and CQG QTrader customers can pull the time the high and low occurred during today’s session into a Microsoft Excel® spreadsheet using these RTD formulas:… more
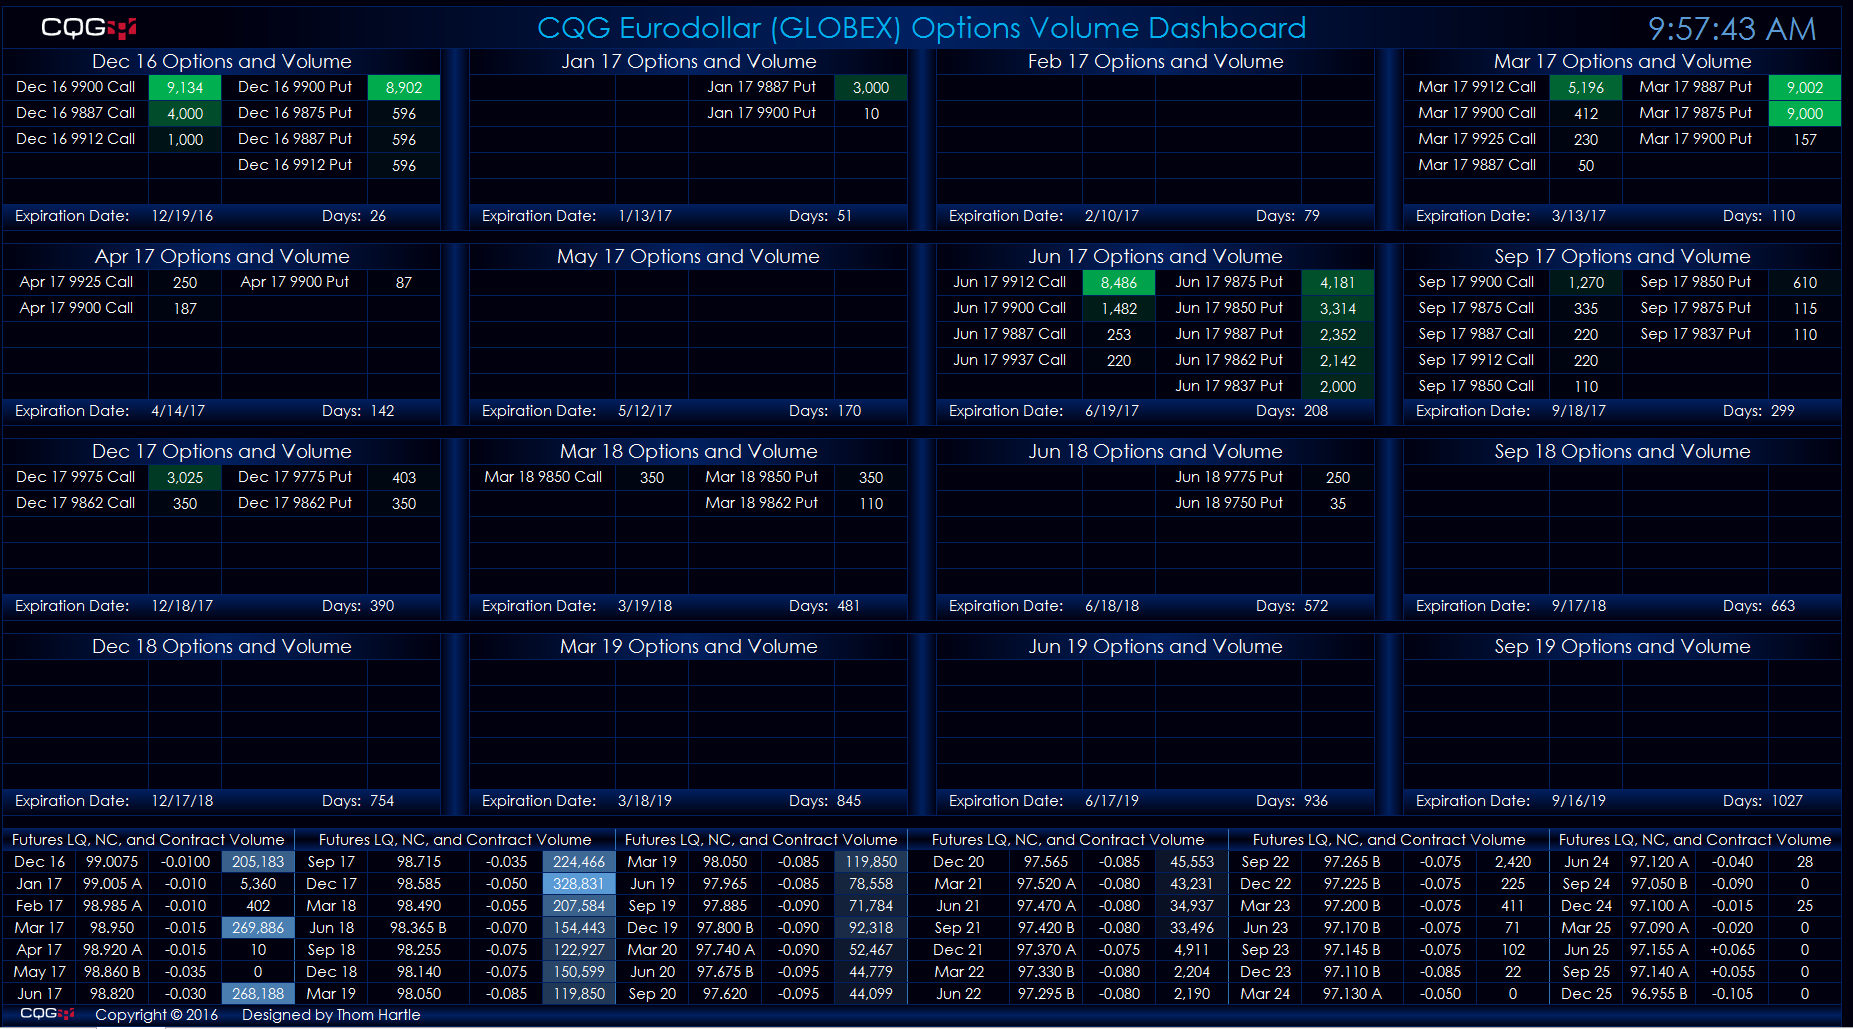
This Microsoft Excel® dashboard scans the options on the Eurodollar futures market for volume and ranks the traded volume for each expiry out to three years. The scan covers options traded ten… more
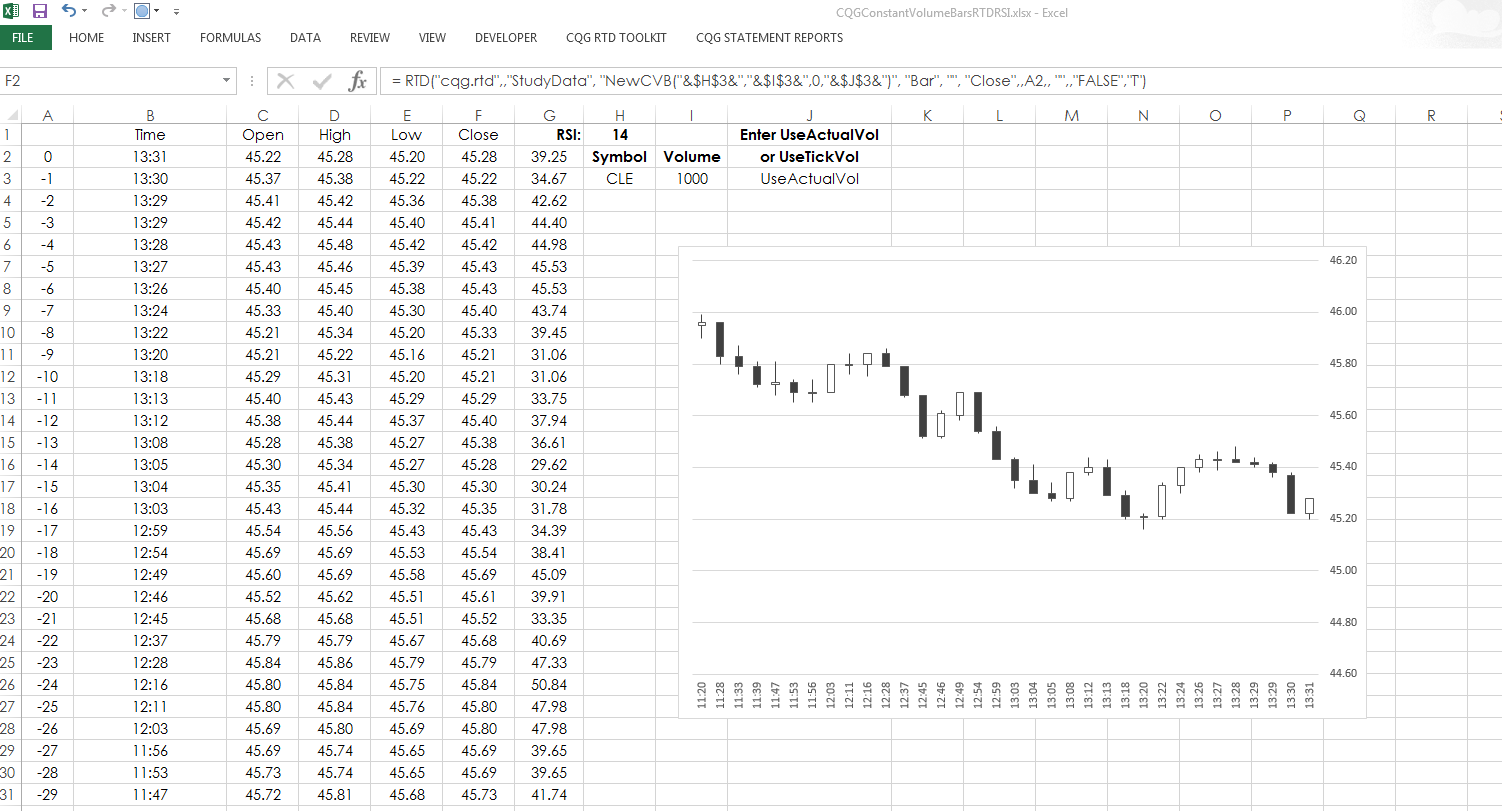
Pull historical CVB data into Microsoft Excel® using RTD formulas with this sample spreadsheet. It not only pulls open, high, low, and close values into Excel, but also a study, the Relative… more
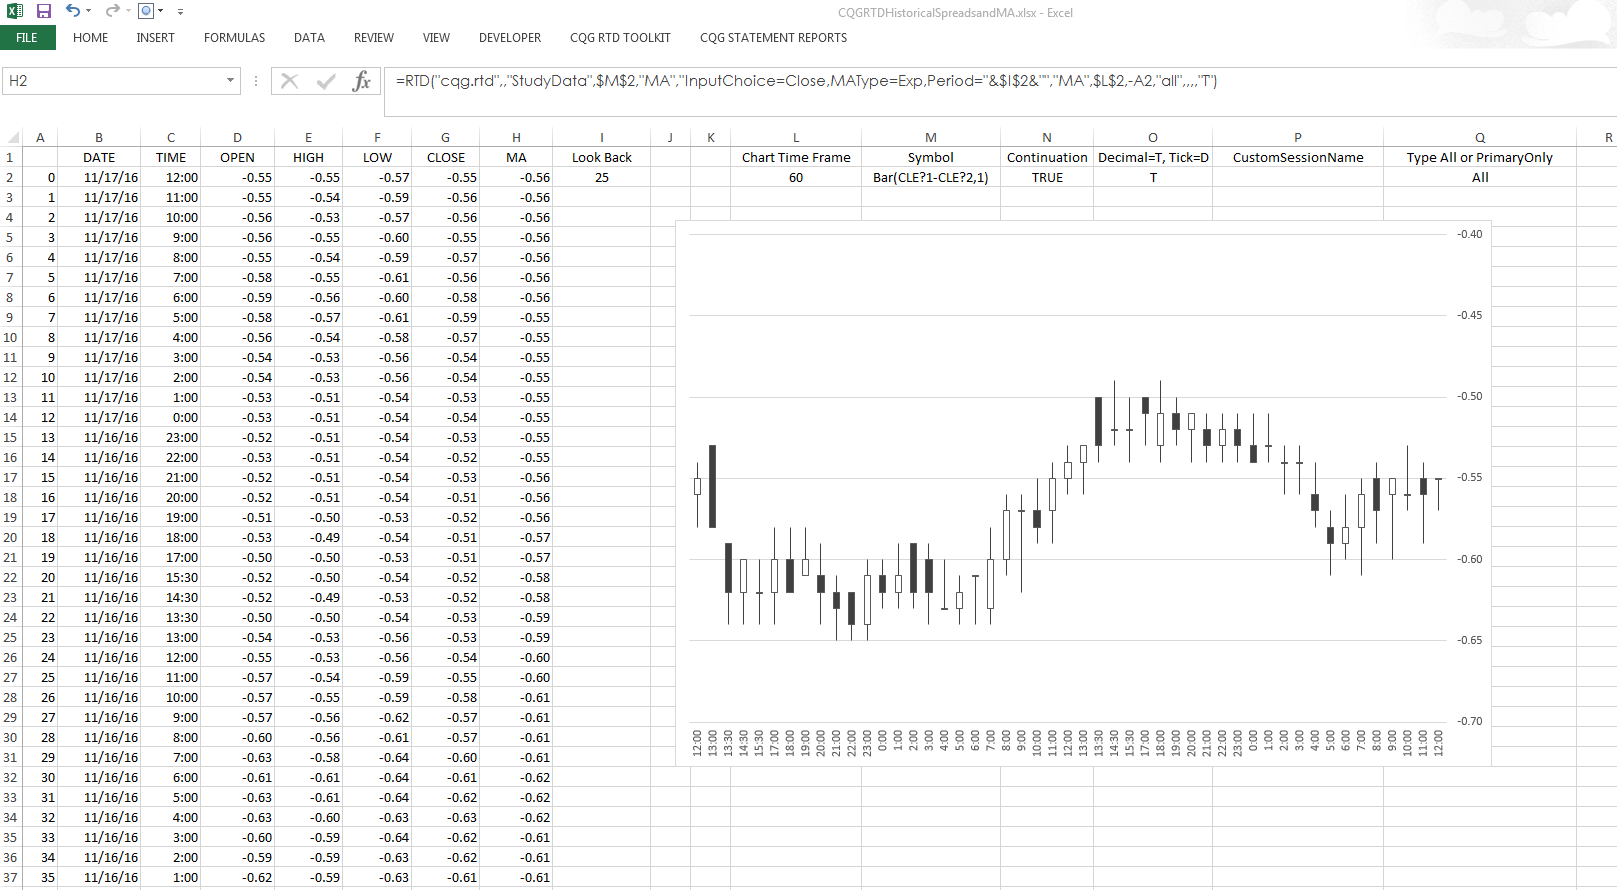
Pull historical spread data into Microsoft Excel® using RTD formulas with this sample spreadsheet. It not only pulls open, high, low, and close values into Excel, but also a study, the… more
The component pac at the end of this article contains holdings or components of eleven SPDR ETF portfolios. You can use a portfolio to create a quote page… more
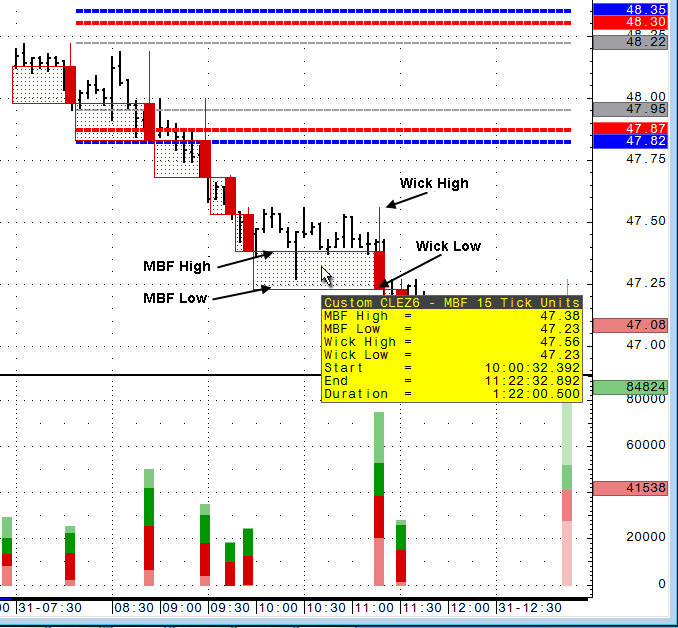
Mark B. Fisher, founder and CEO of MBF Clearing Corp, discussed his chart and study during a joint webinar with CQG. This article further explains the study and chart type,… more

This Microsoft Excel® dashboard offers four charts displaying seventy-five open, high, low, and close bars of a spread. The spread symbols are entered into Excel on the symbols tab and the … more
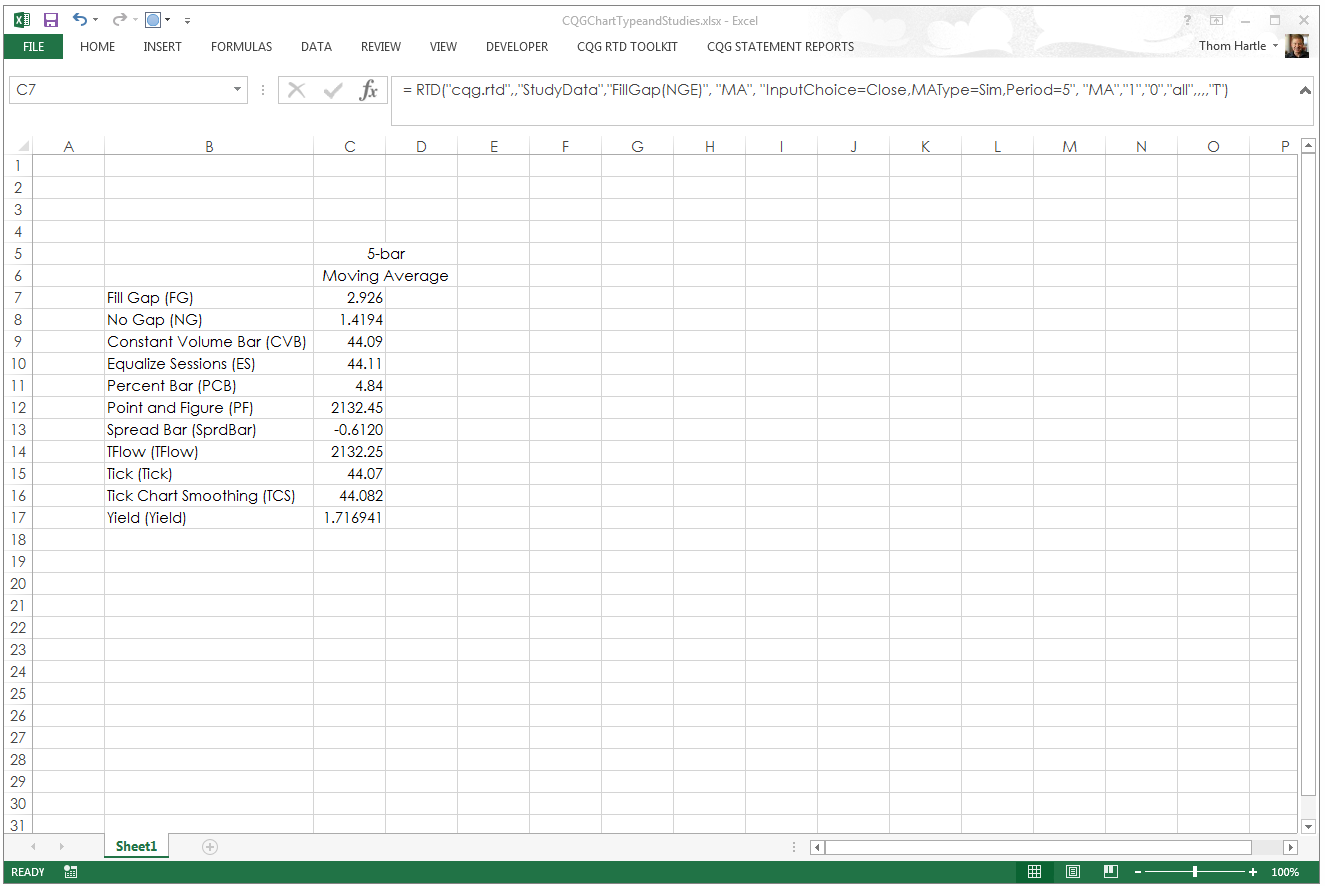
The Microsoft Excel® RTD Studies sample offers a collection of RTD CQG study formulas applied to the Bar chart type. If you want to use other chart types, such as no gap or constant volume… more