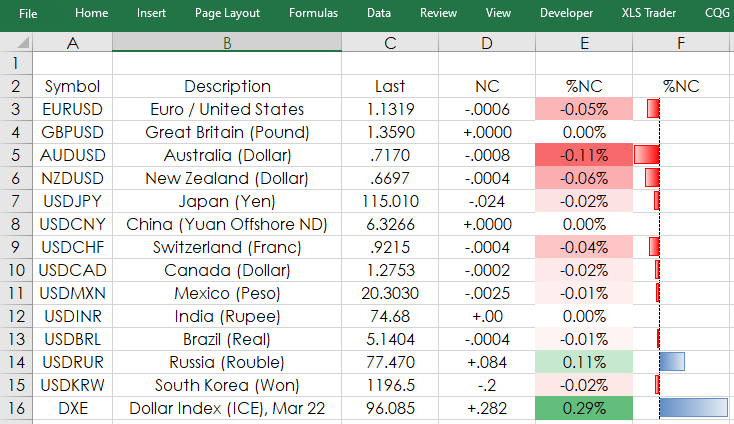
Microsoft Excel spreadsheets have functionality to format cells based on conditions. This feature is also referred to as data visualization. This post details two types of data visualizations… more
Workspaces
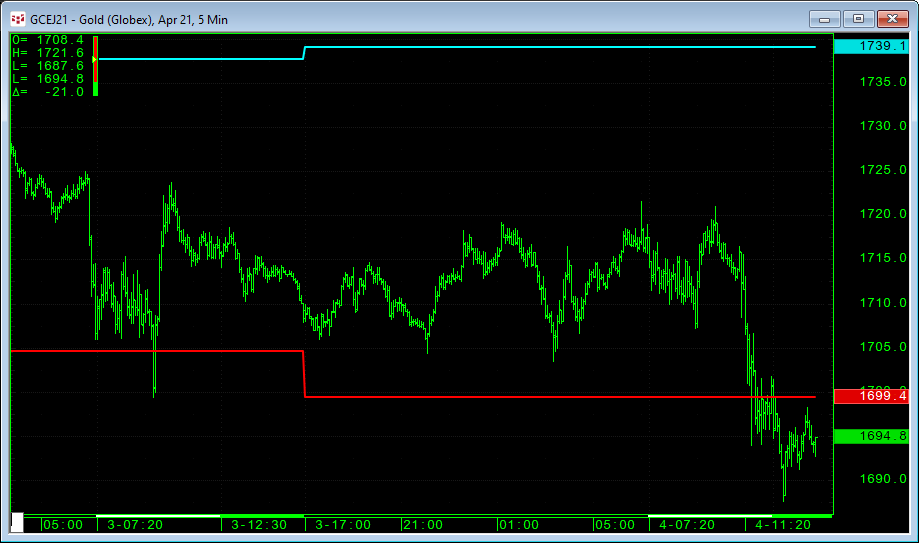
The BarInt function can be useful when creating Custom Studies or Conditions which can be applied to different timeframe but where a point of reference may be different whether you are looking at… more
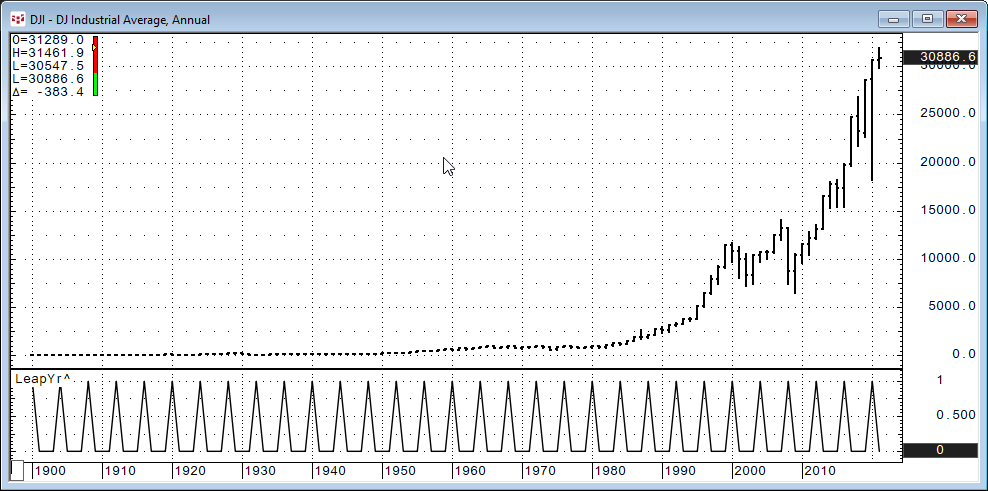
One of the simplest examples for this function is to find out whether a value is an even number.
Modulus (Close(@),2) = 0In other words, the result of the formula above would give us the… more
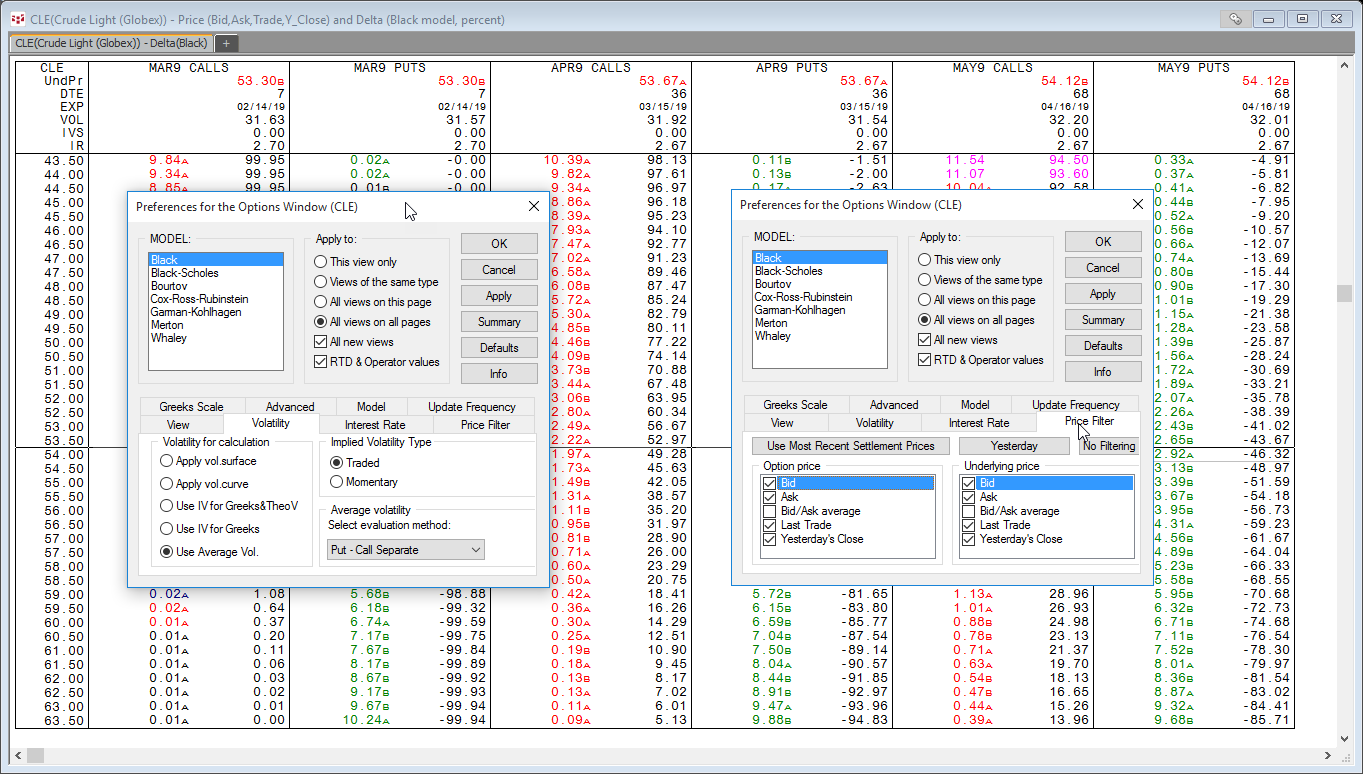
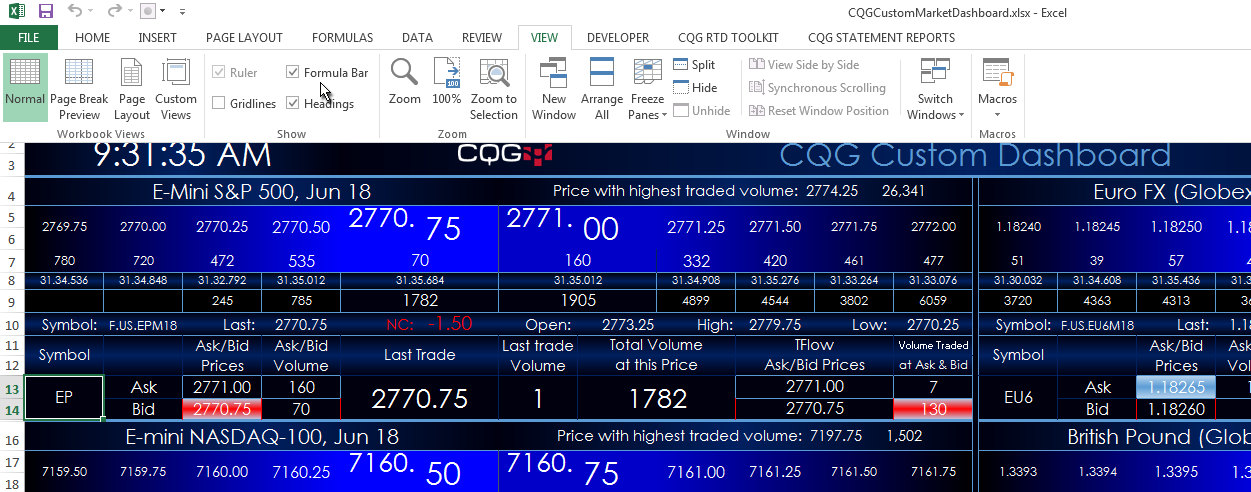
If you set up a Microsoft Excel® dashboard to monitor options prices and their respective deltas you may see the delta values disappear occasionally in the dashboard. In other words, the value for… more
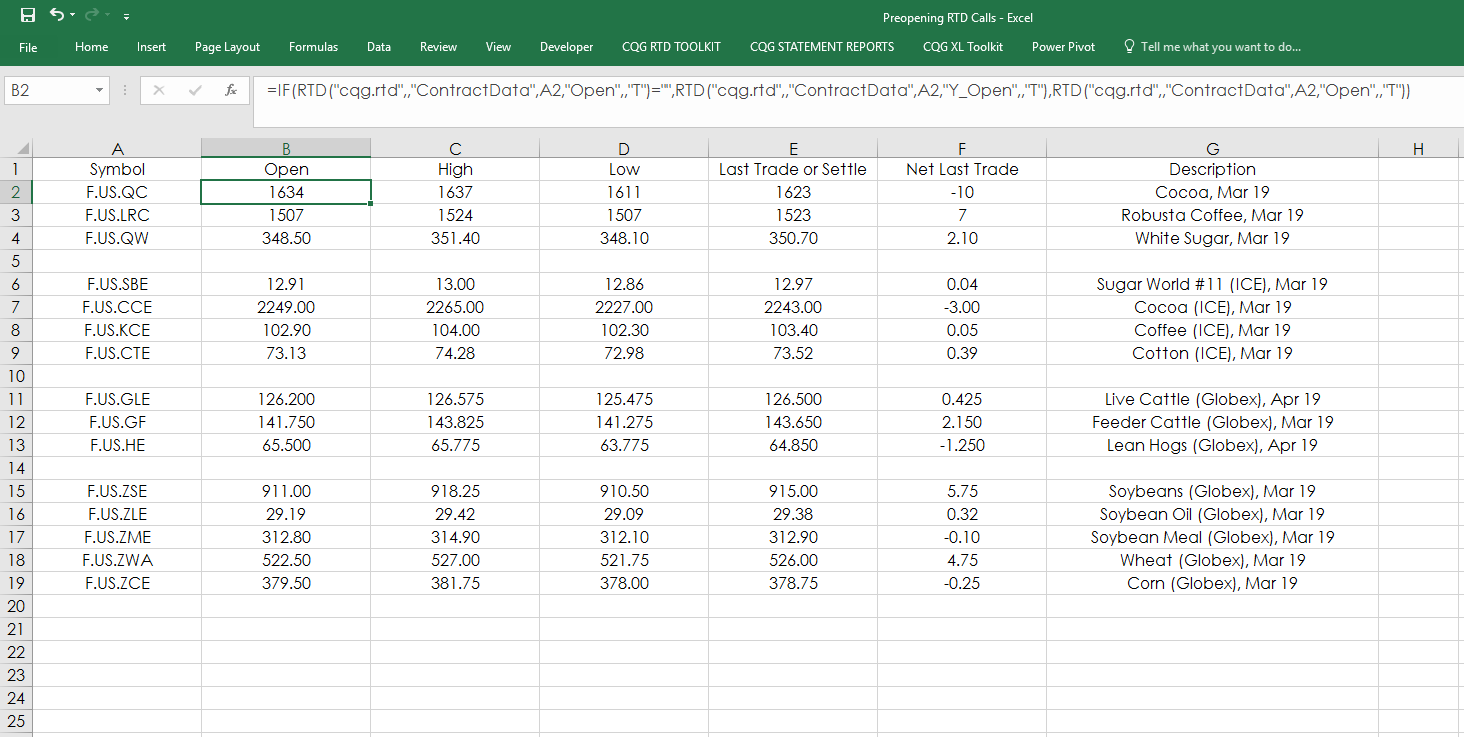
After the current trading session ends, many exchanges clear out today’s market data to set up for the preopening posting of orders to the exchange's order book. This includes today’s open, high,… more
Bring Updating Time-Series Data from Microsoft Excel® Into CQG
The XL Real-Time study is included in CQGIC subscriptions enabled for CQG Trading, or Spreader, as well as CQG Spreader systems. The… more
You can easily hide things unnecessary items in Microsoft Excel® to open up more screen real estate. All of my published CQG-powered Excel dashboards show you an image. You may have also noticed… more
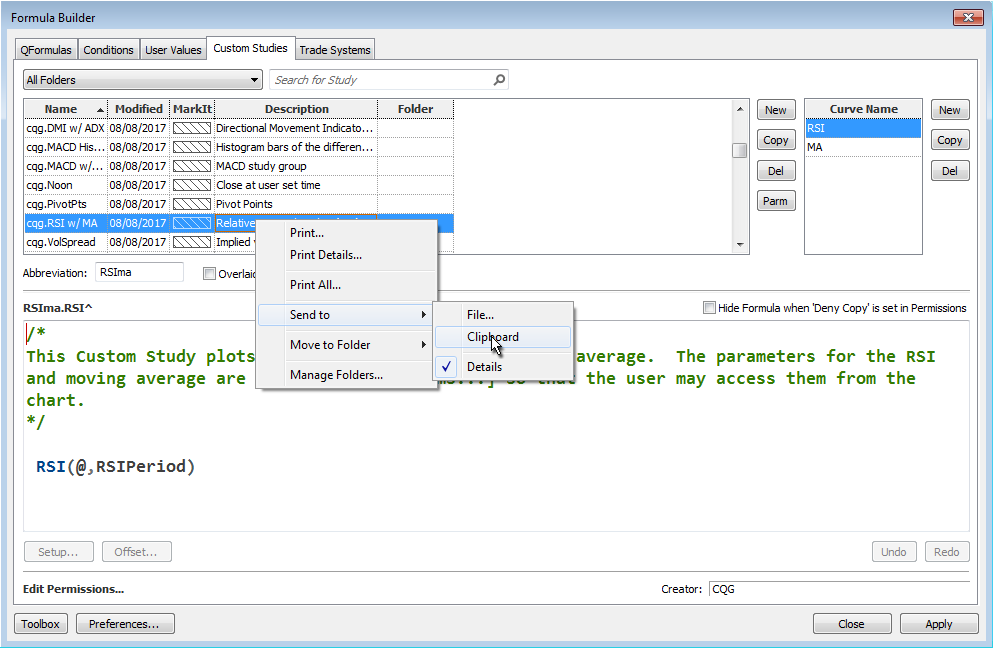
There are numerous Excel samples that walk you through bringing various market data into Excel using RTD formulas. However, there is a lot to look through. One solution is to use the CQG Formula… more
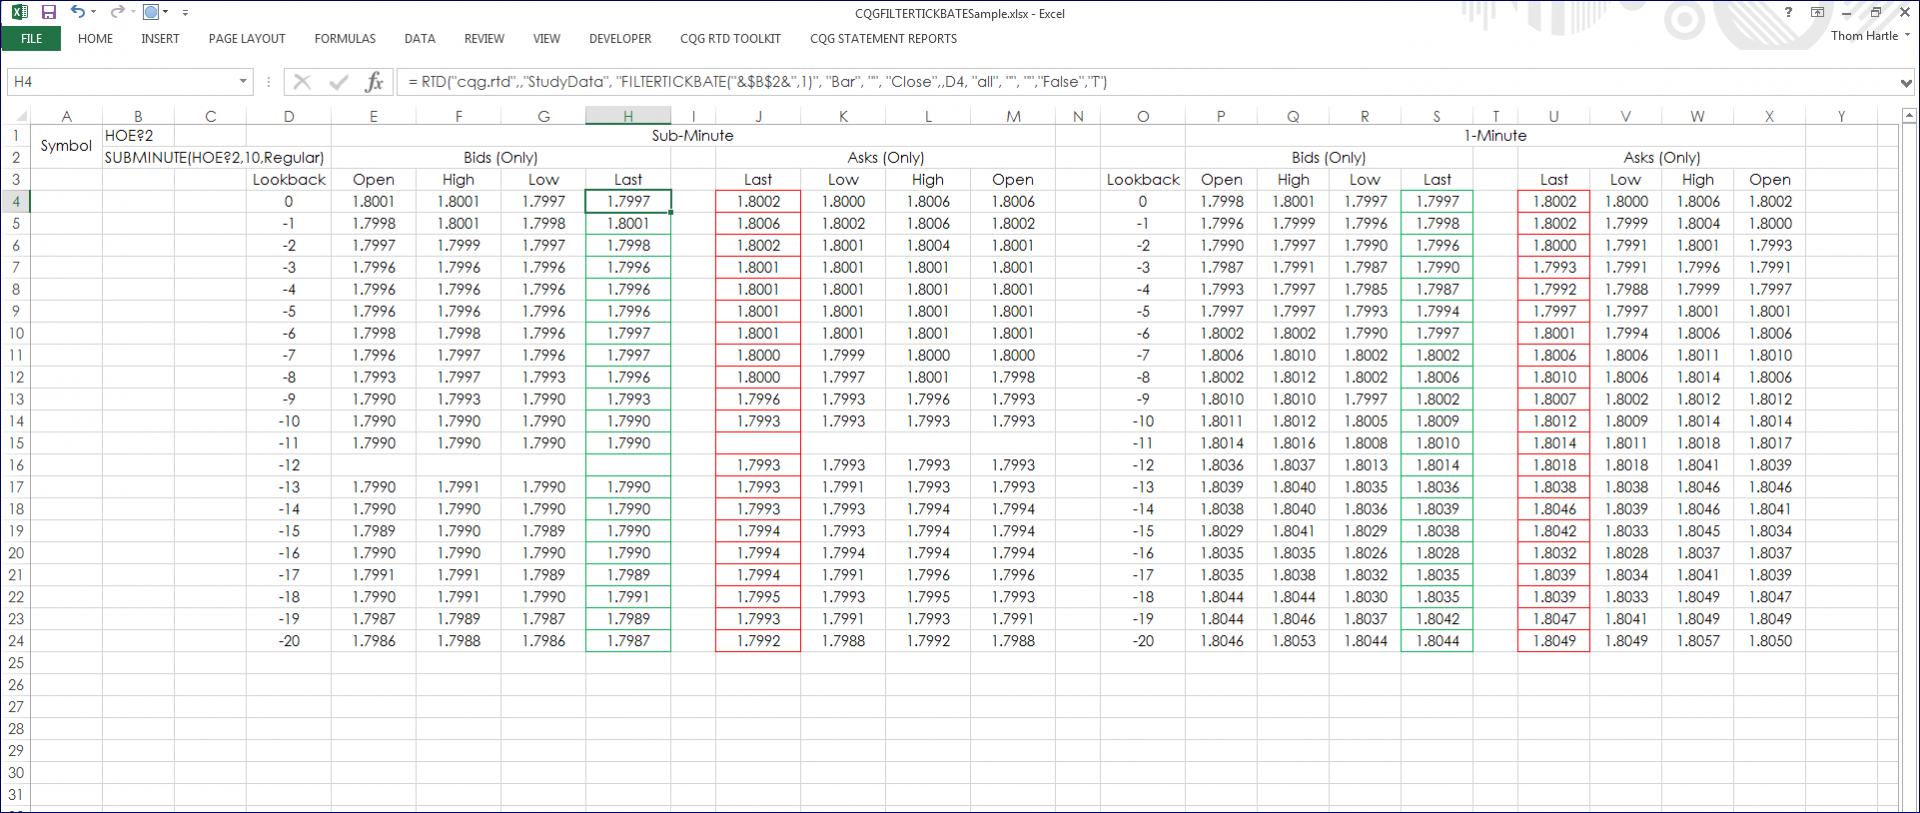
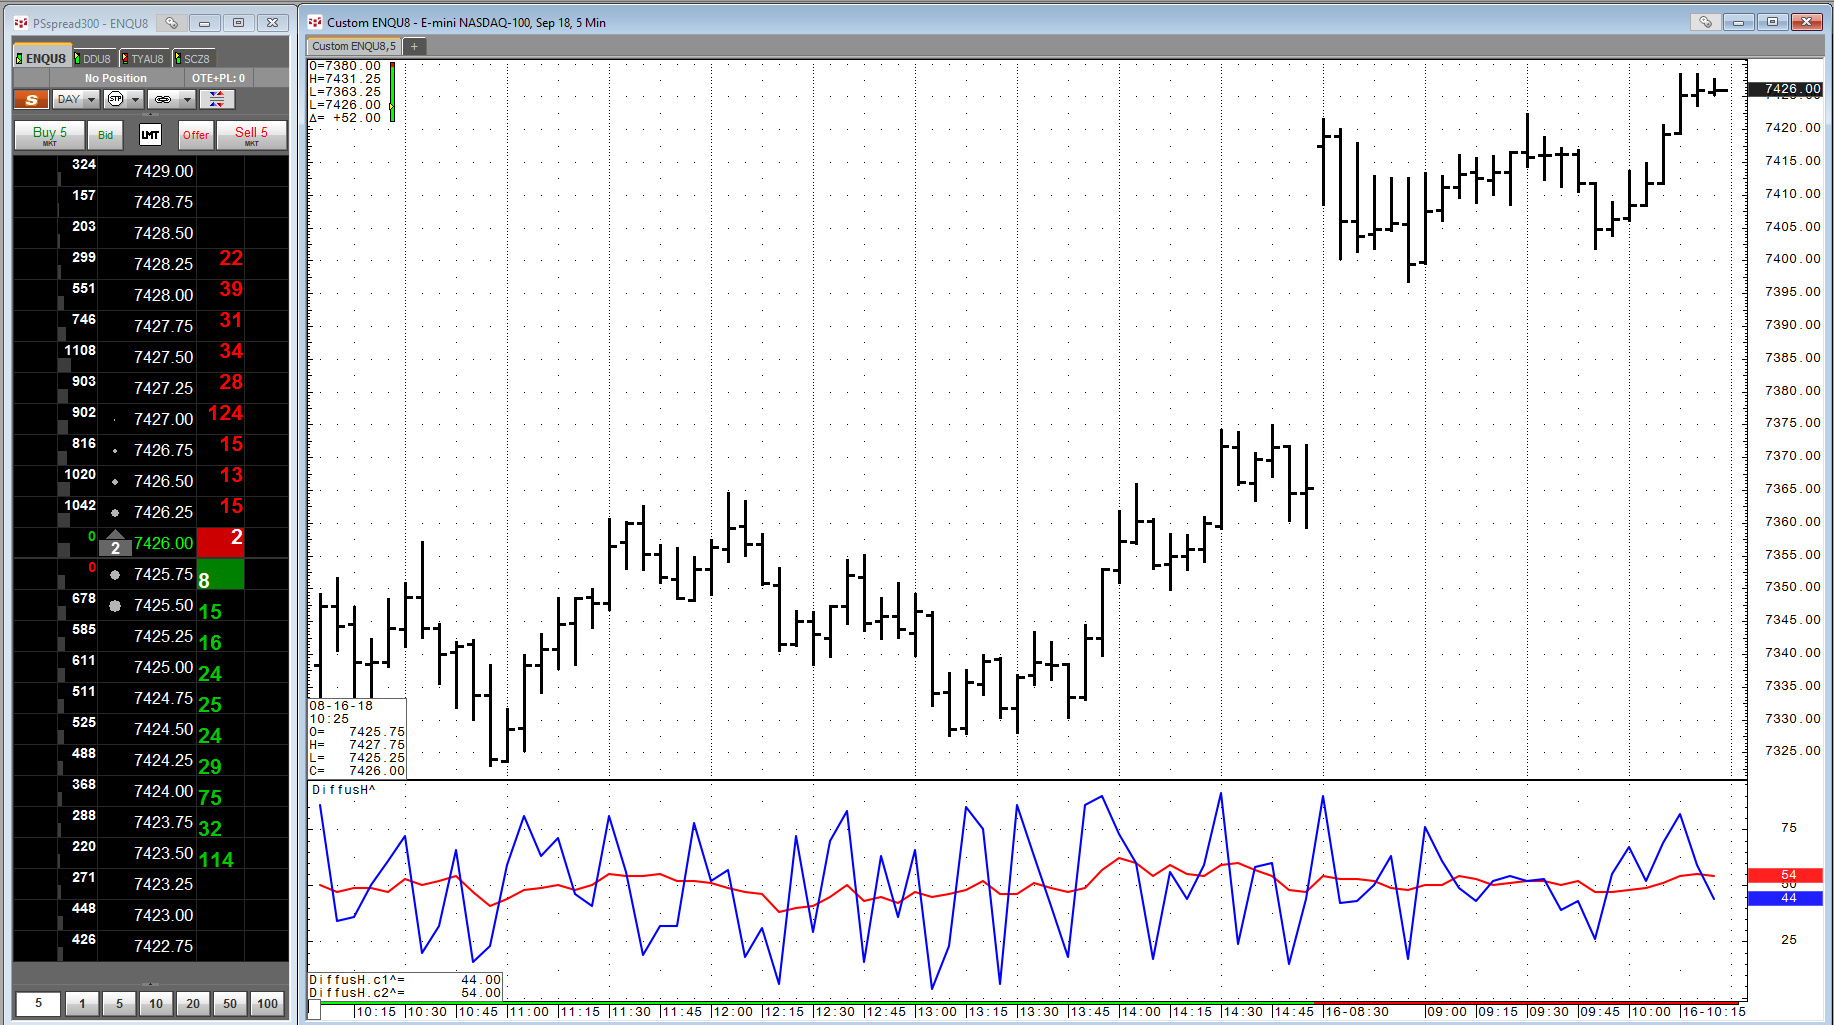
CQG charts have a setting called the BATS Charts Preferences. Here, you select what data to use to build the chart. You can use the default setting where the chart is built using trade and… more
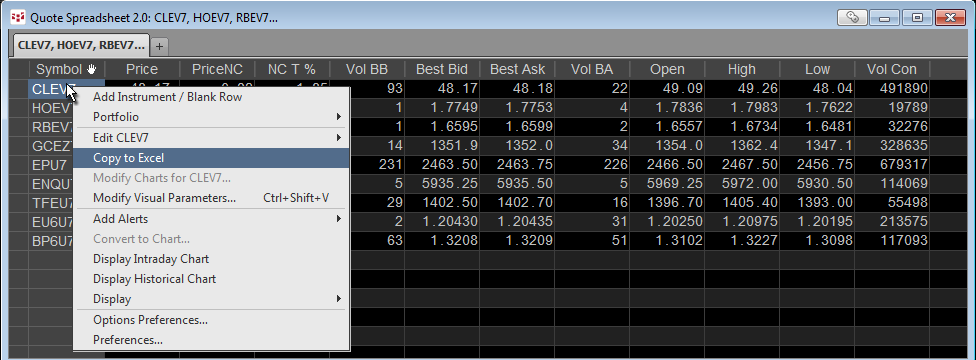
Customers who use Microsoft Excel® when following the markets can easily populate their Excel spreadsheet with RTD formulas using CQG's Quote SpreadSheet (QSS) 2.0.
To open QSS 2.0, click… more