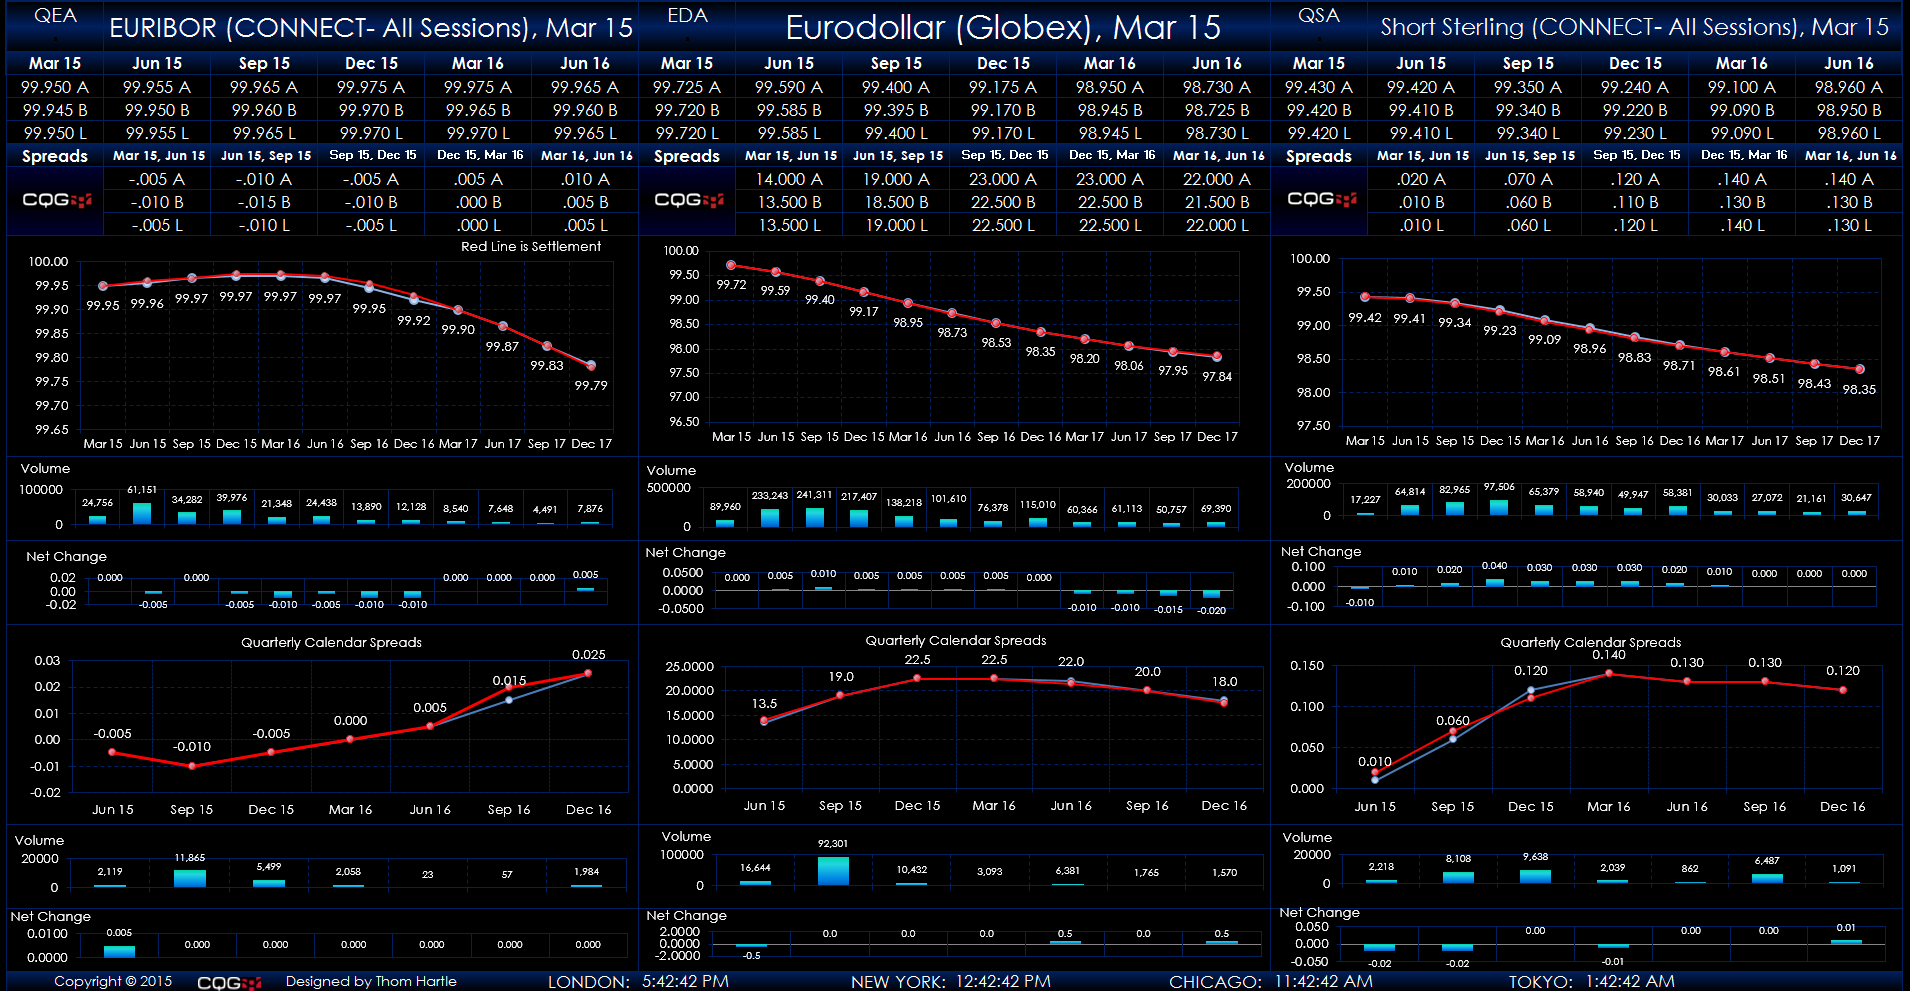
This Microsoft Excel® spreadsheet presents market data and forward curves of the Euribor, Eurodollar, and Short Sterling contracts. The data includes the outrights and exchange-traded quarterly… more
Workspaces

This Microsoft Excel® spreadsheet presents market data and forward curves of the Globex heating oil contracts. The data includes the outrights, exchange-traded calendar spreads, and synthetic… more
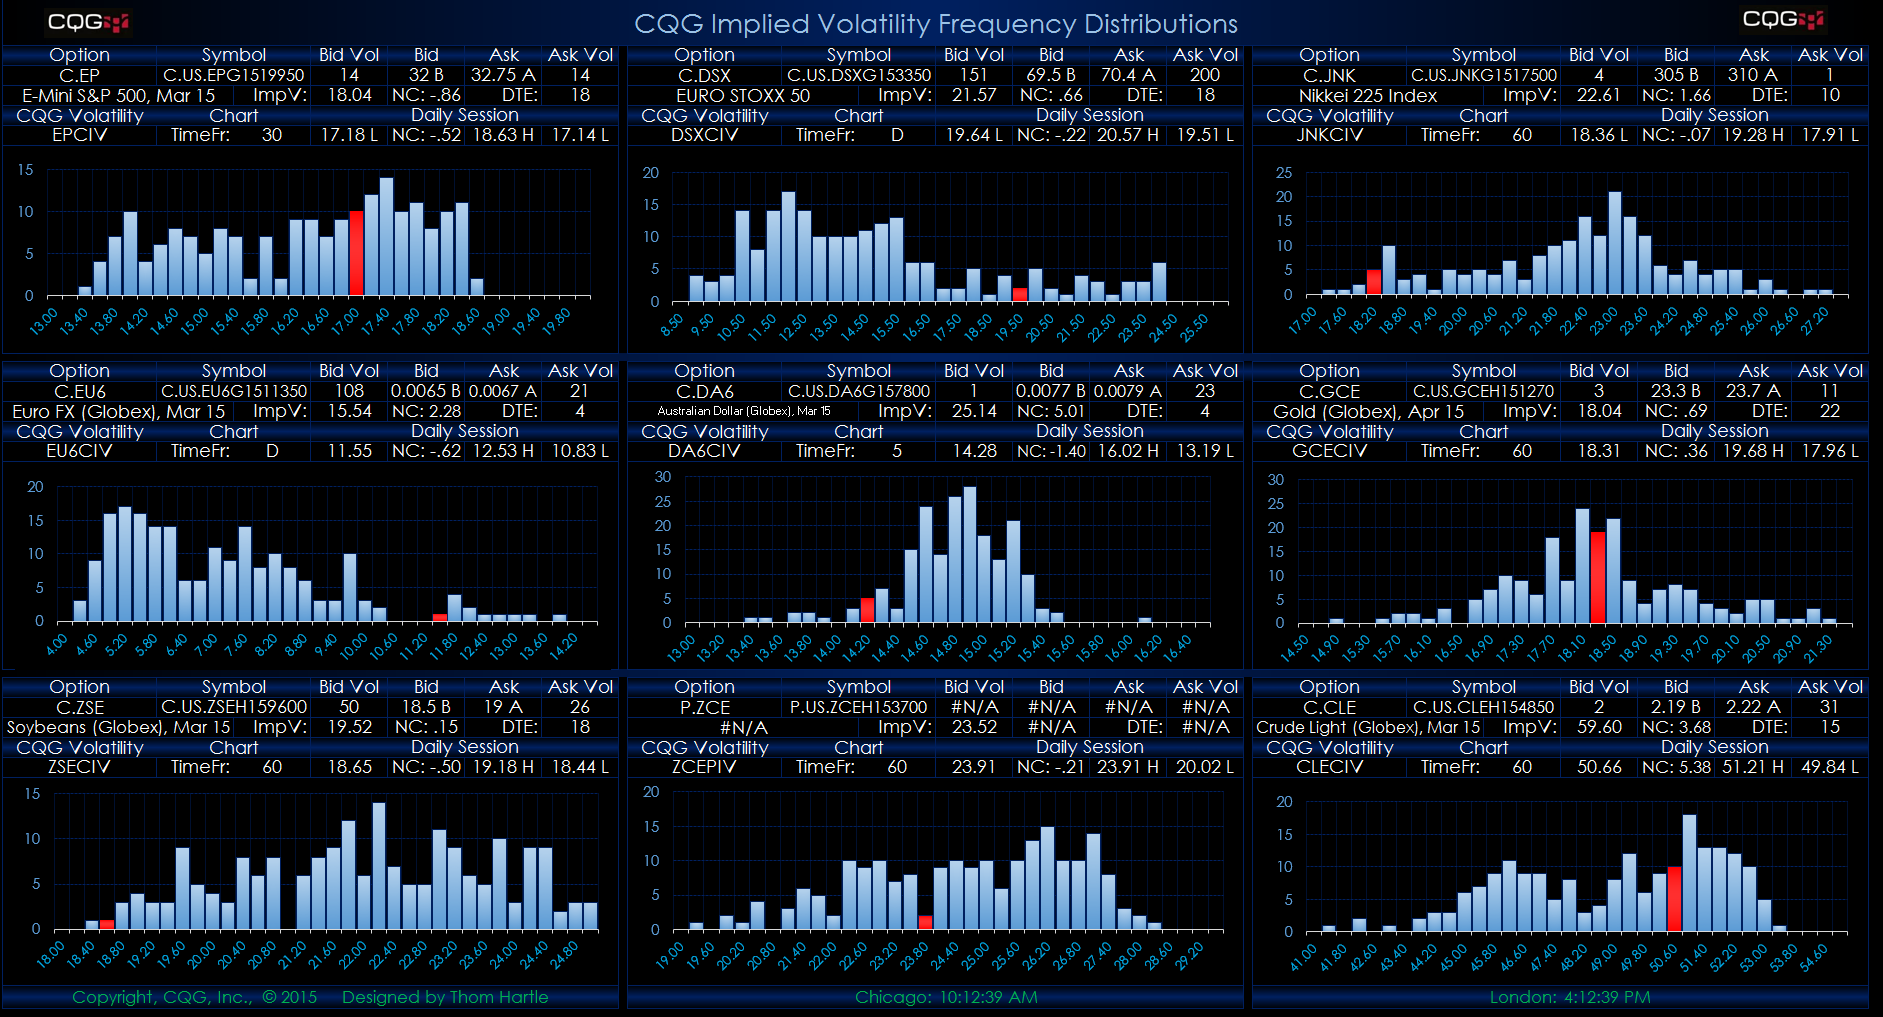
This Microsoft Excel® spreadsheet presents frequency distribution analysis of historical implied volatility (IV) data.
CQG offers its own historical options implied volatility index for… more
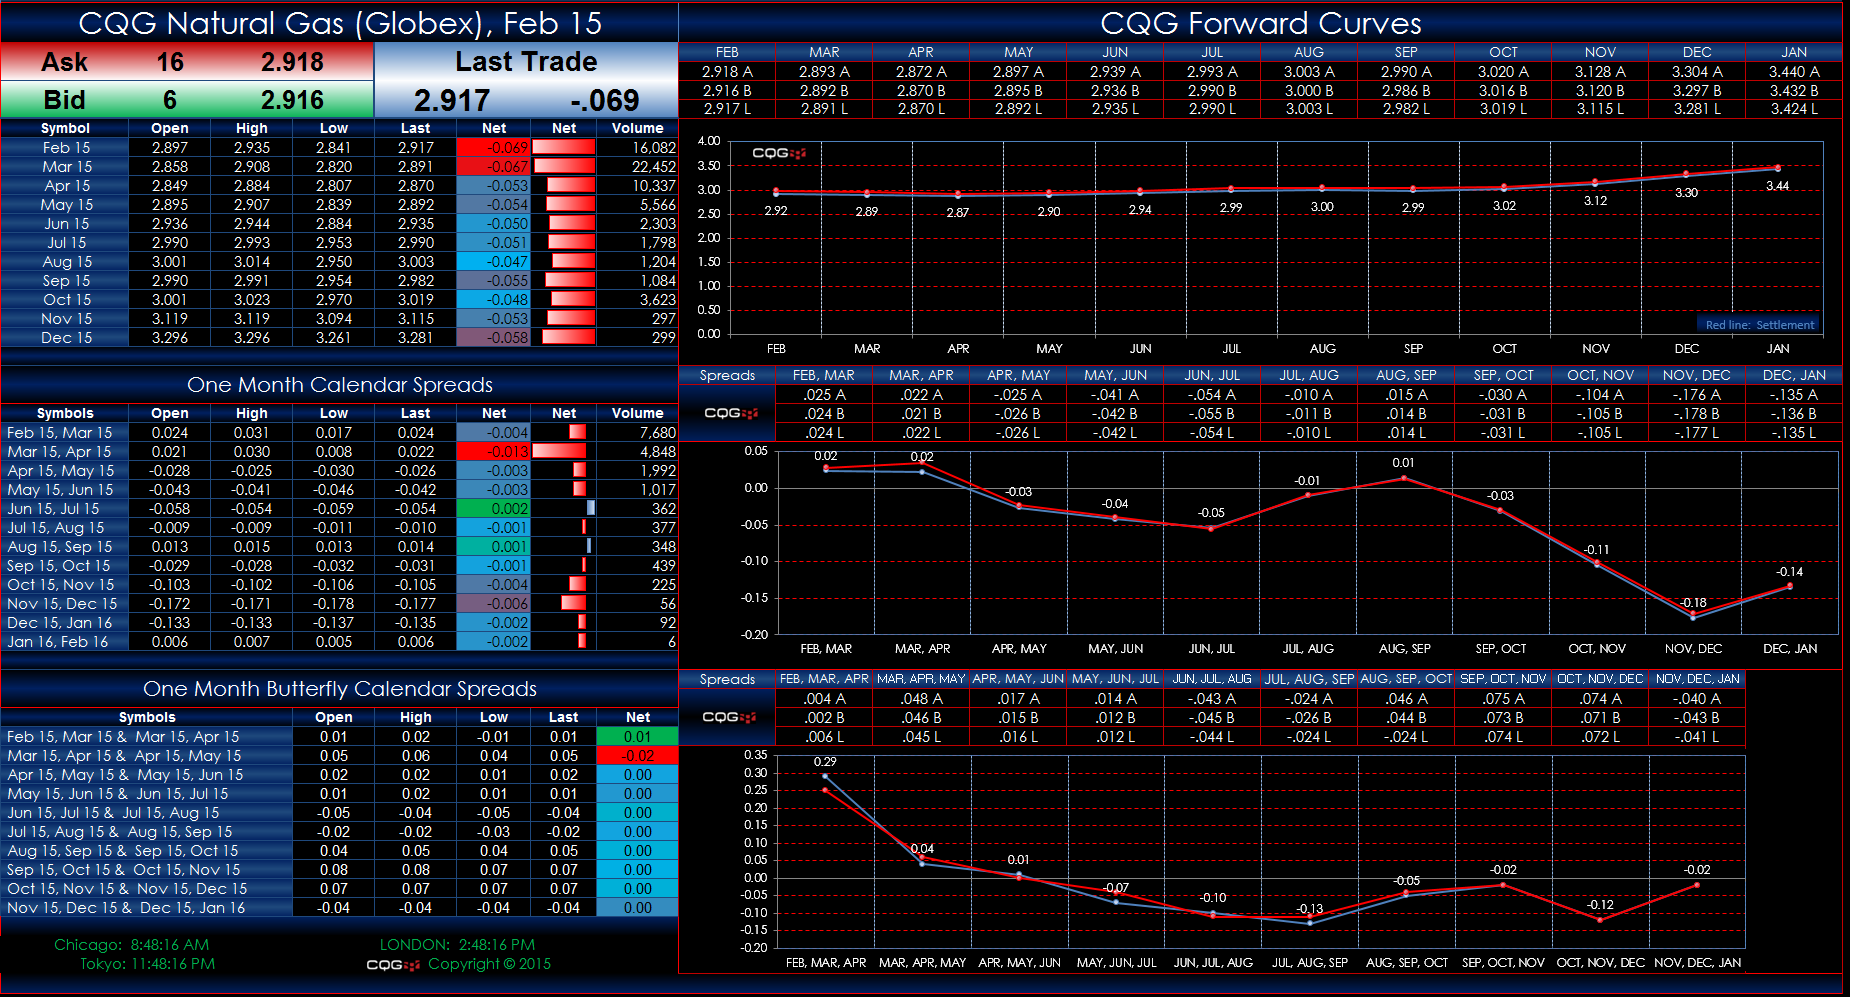
This Microsoft Excel® spreadsheet presents market data and forward curves of the Globex natural gas contracts. The data includes the outrights, exchange-traded calendar spreads, and synthetic… more
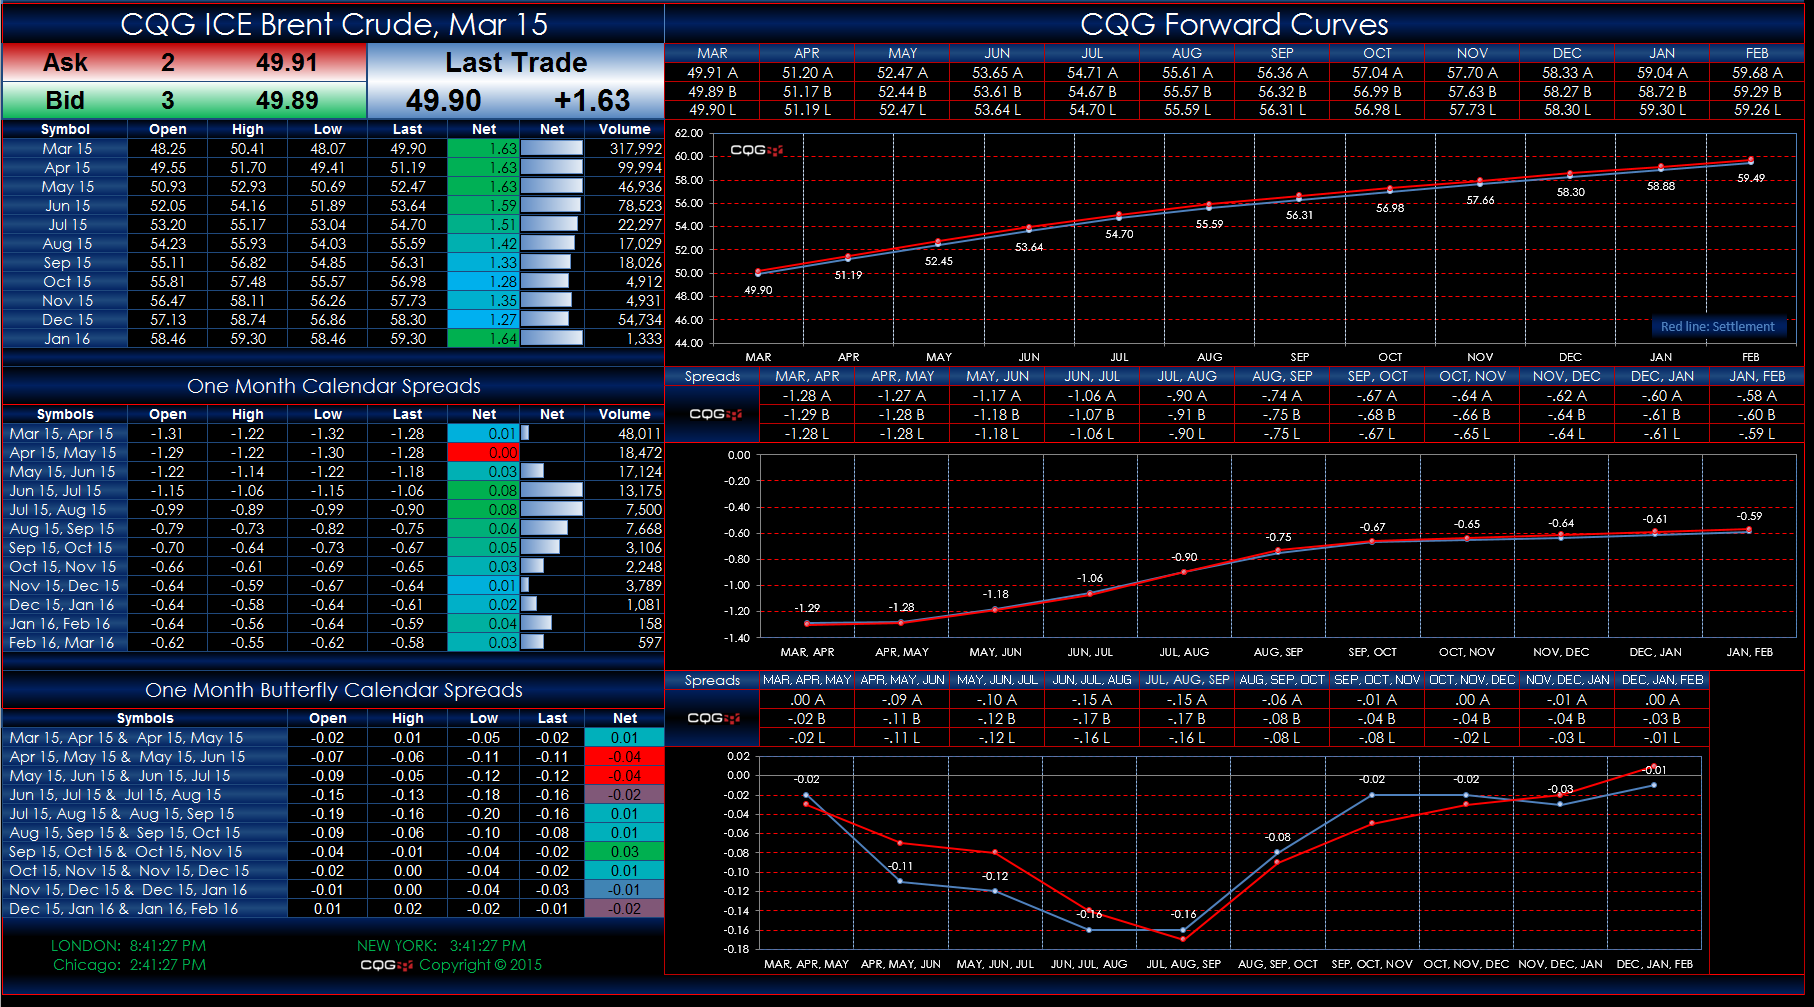
These two Microsoft Excel® spreadsheets present market data and forward curves of the Globex Crude Light Oil and ICE Brent Crude Oil contracts. The data includes the outrights, exchange-traded… more
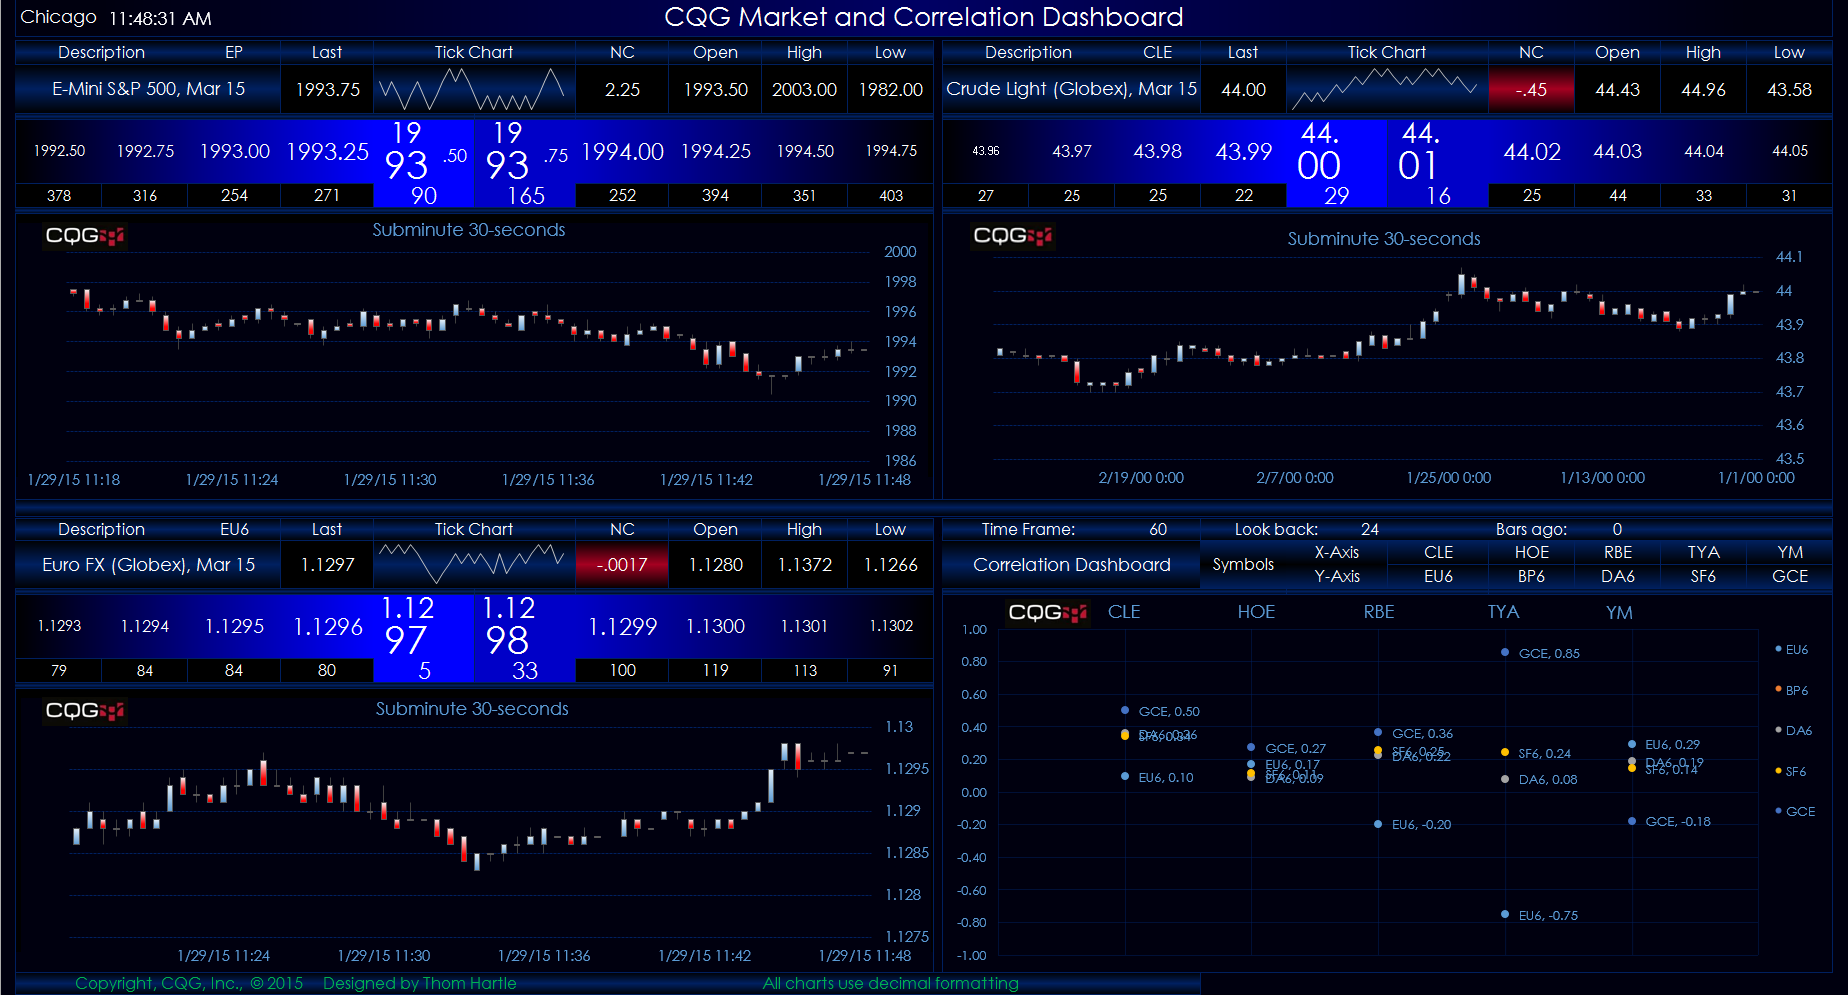
This Microsoft Excel® spreadsheet uses a horizontal DOM display with FX-style formatting of the best bid and best ask for three markets along with bar or sub-minute charts. The fourth display is a… more
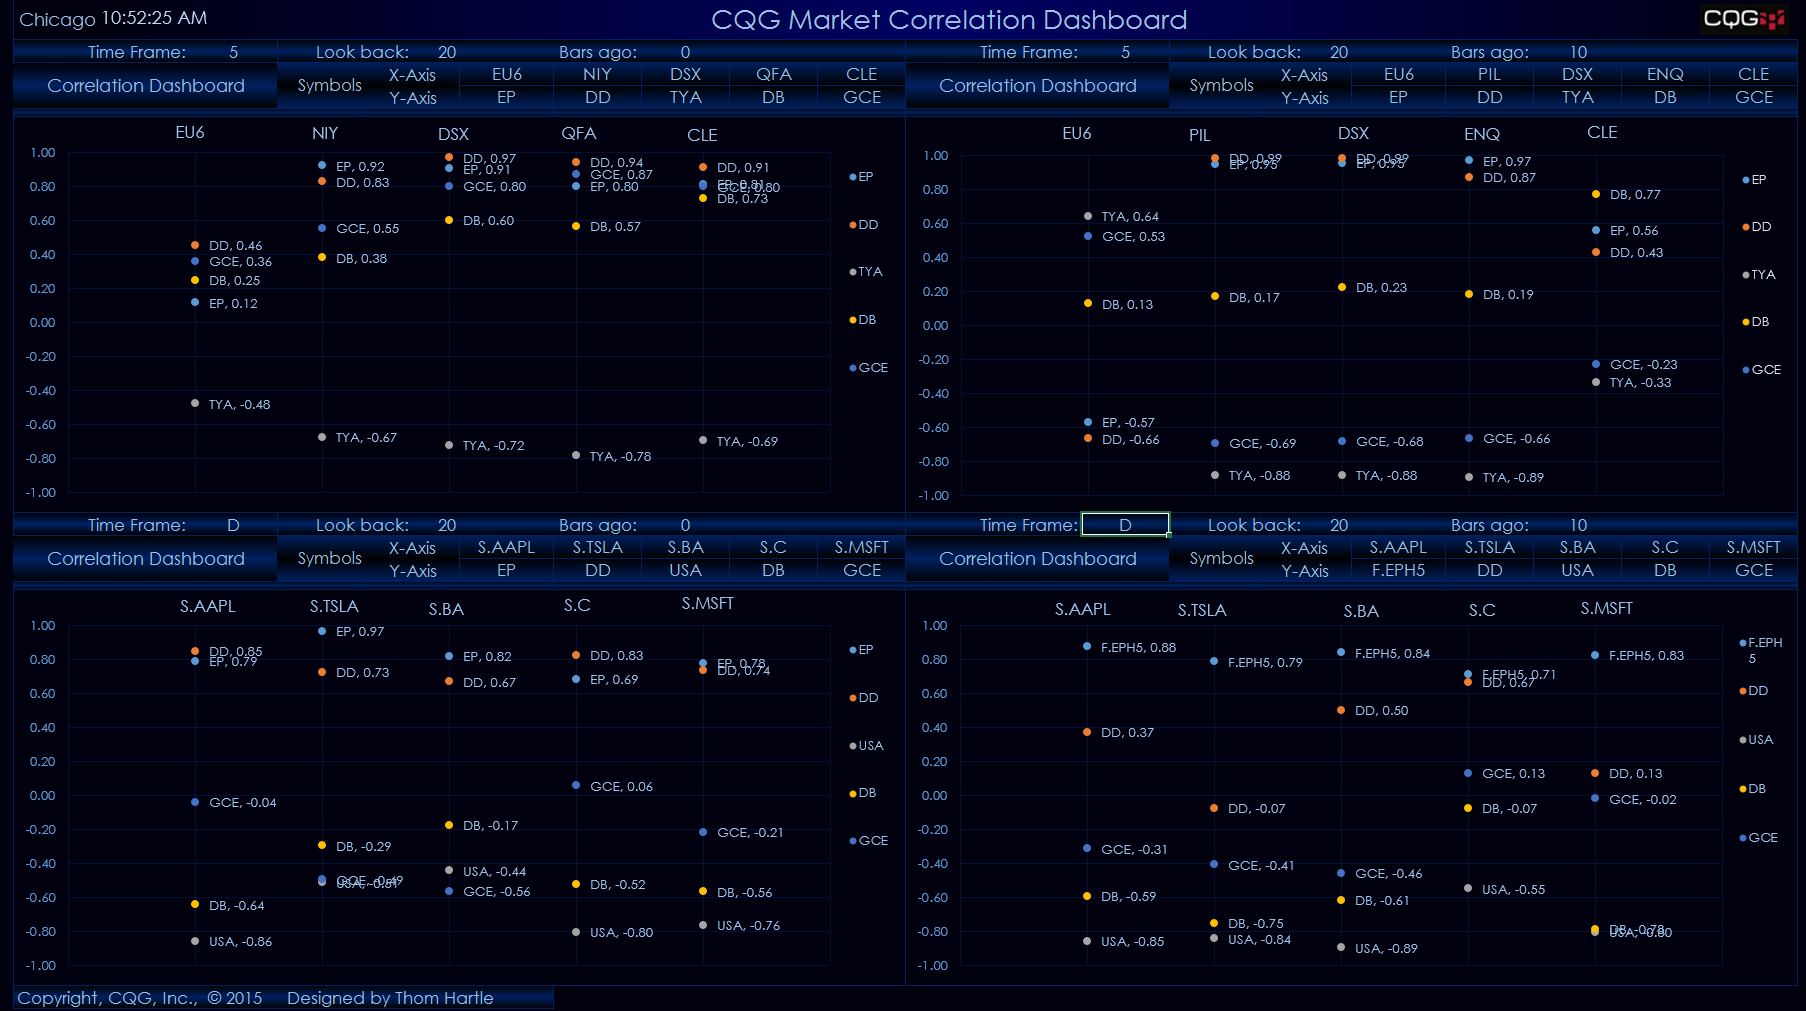
This Microsoft Excel® spreadsheet uses a quadrant format to display correlations. For each quadrant, you can enter five symbols for the horizontal axis and five symbols for the vertical axis. You… more
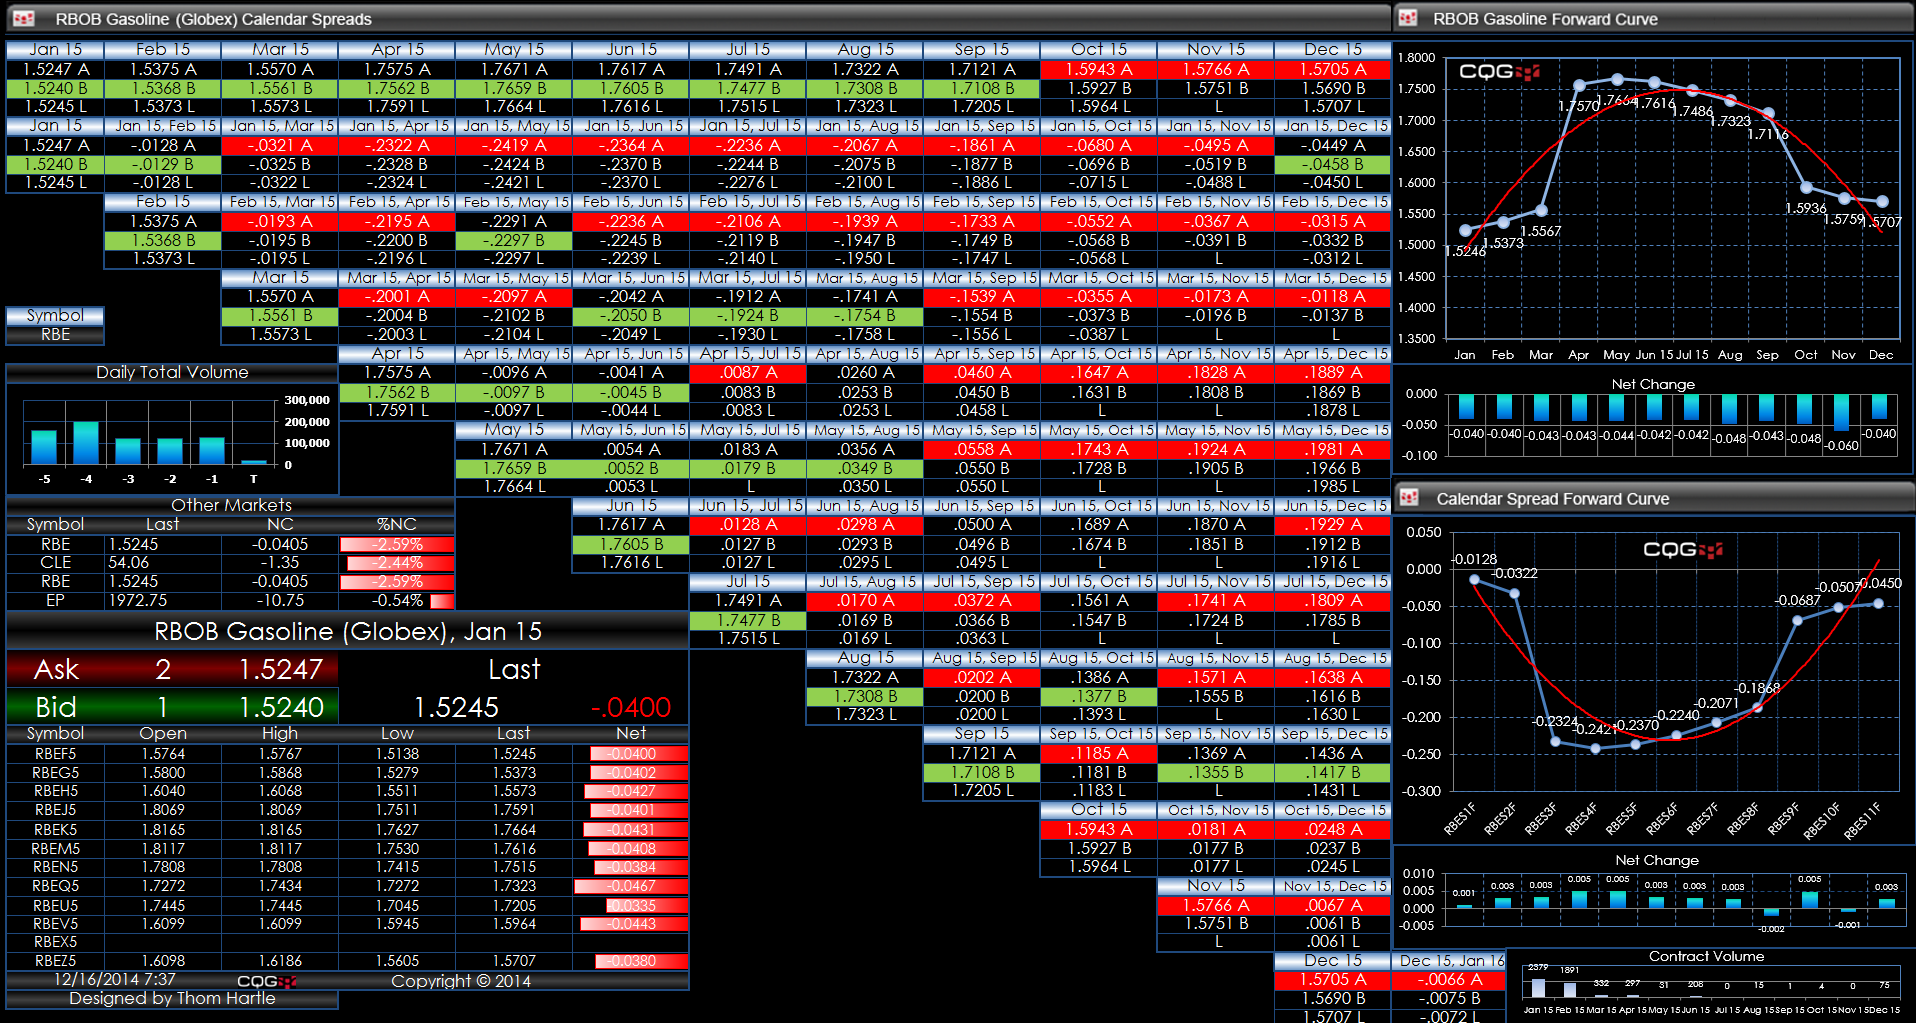
This Microsoft Excel® spreadsheet uses a matrix format to show the RBOB gasoline market traded on the CME Globex electronic trading platform.
This dashboard screen capture shows the inside… more
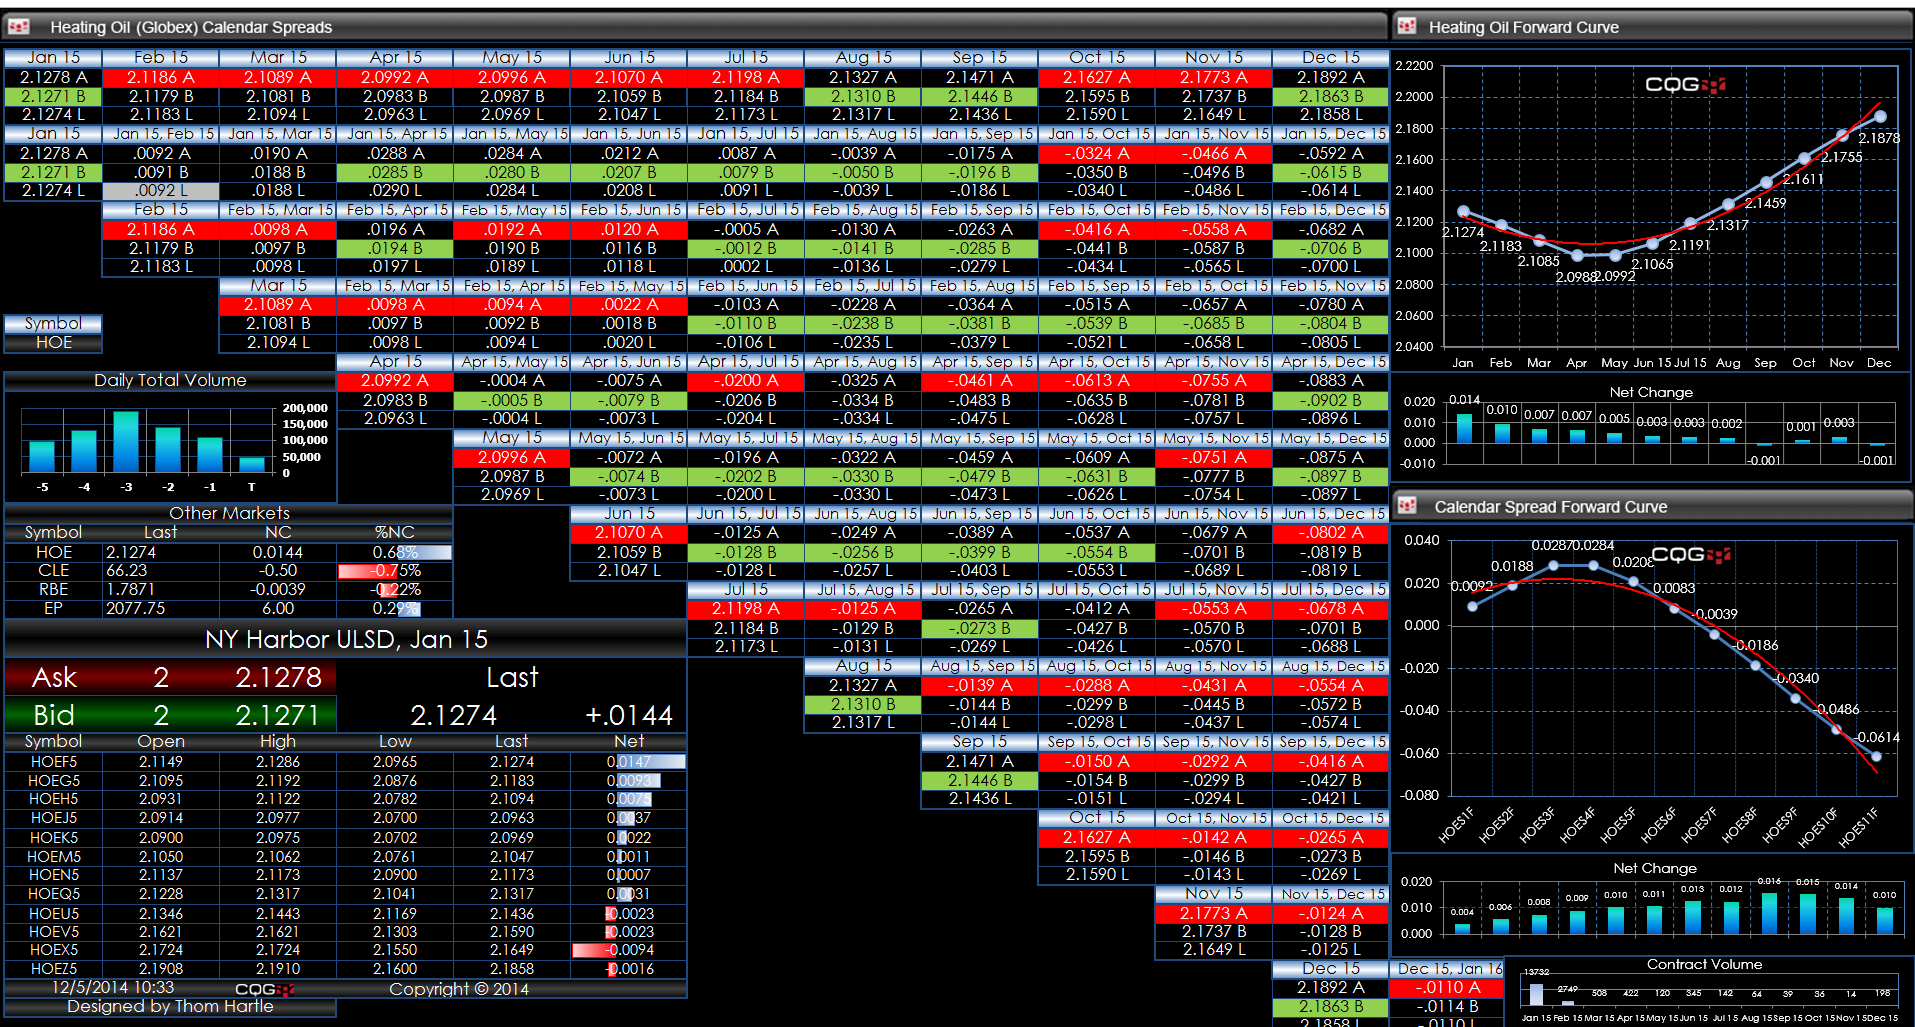
This Microsoft Excel® spreadsheet uses a matrix format to show the heating oil market traded on the CME Globex electronic trading platform.
This dashboard screen capture shows the inside… more
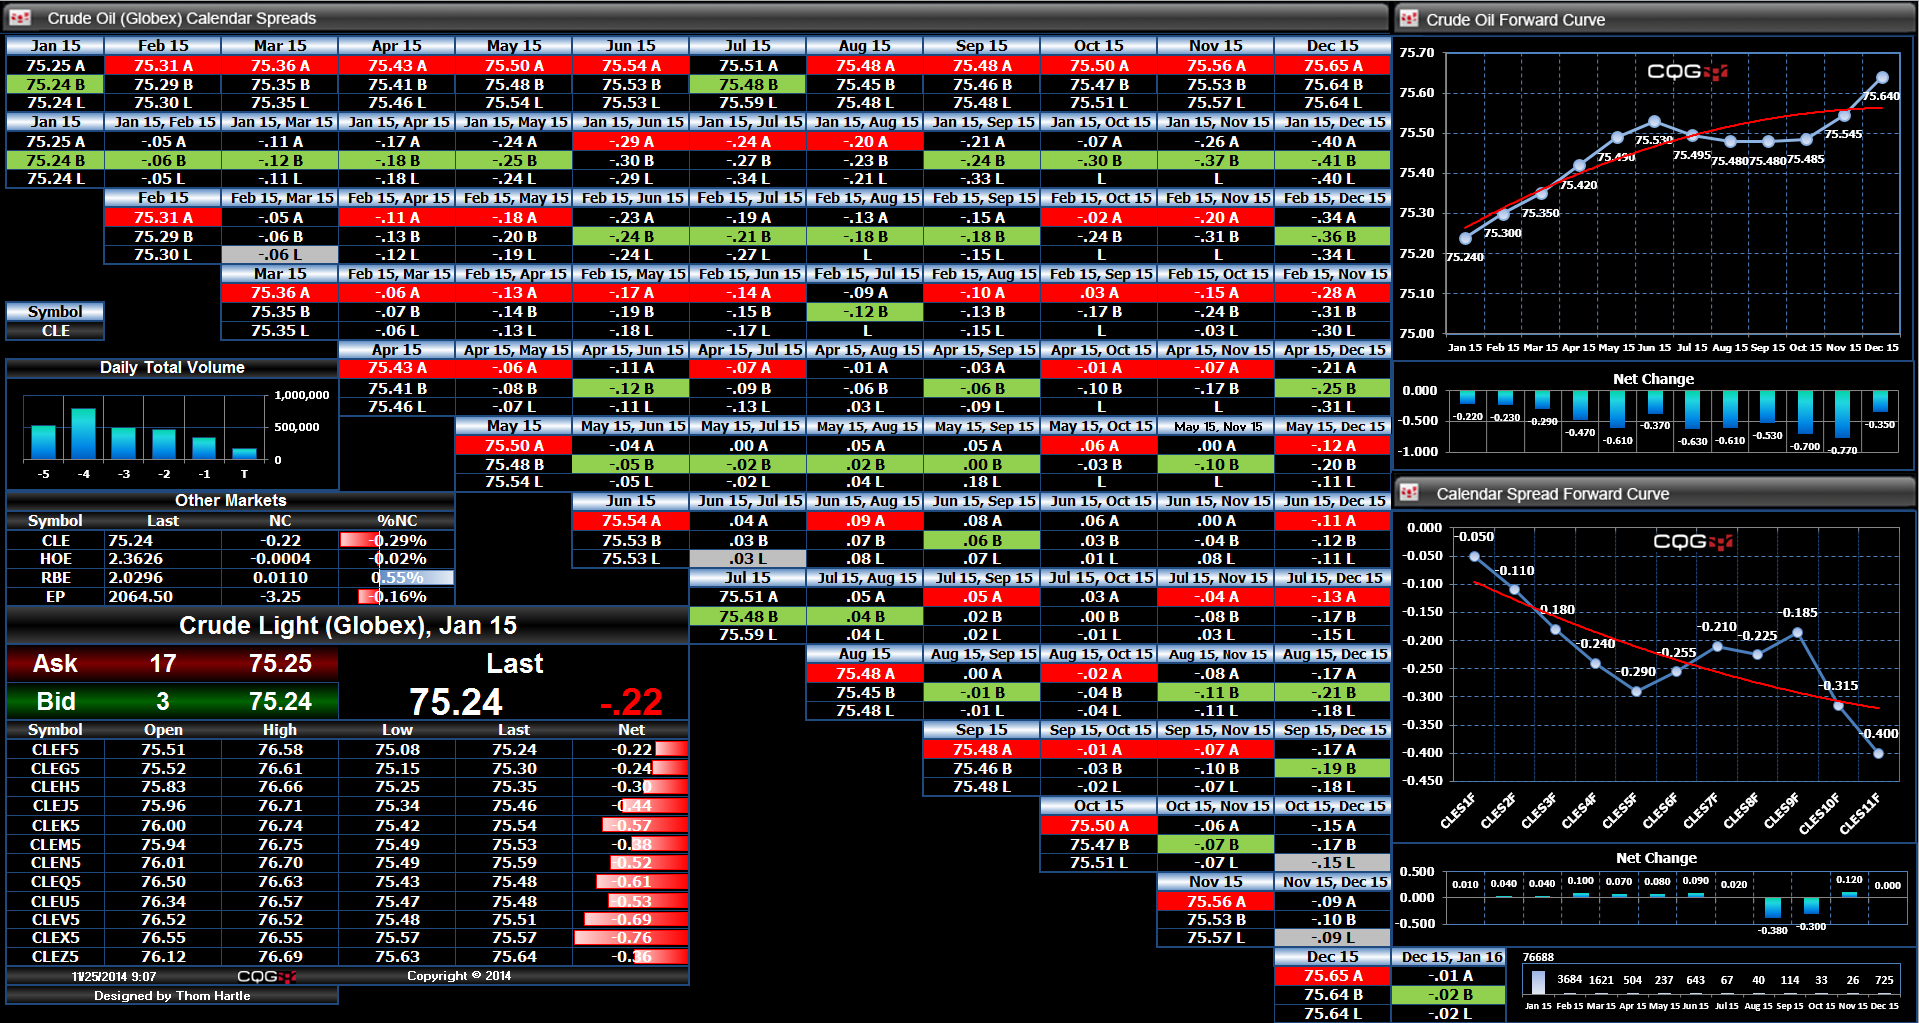
This Microsoft Excel® spreadsheet uses a matrix format to show the crude oil market traded on the CME Globex electronic trading platform.
This dashboard screen capture shows the inside… more