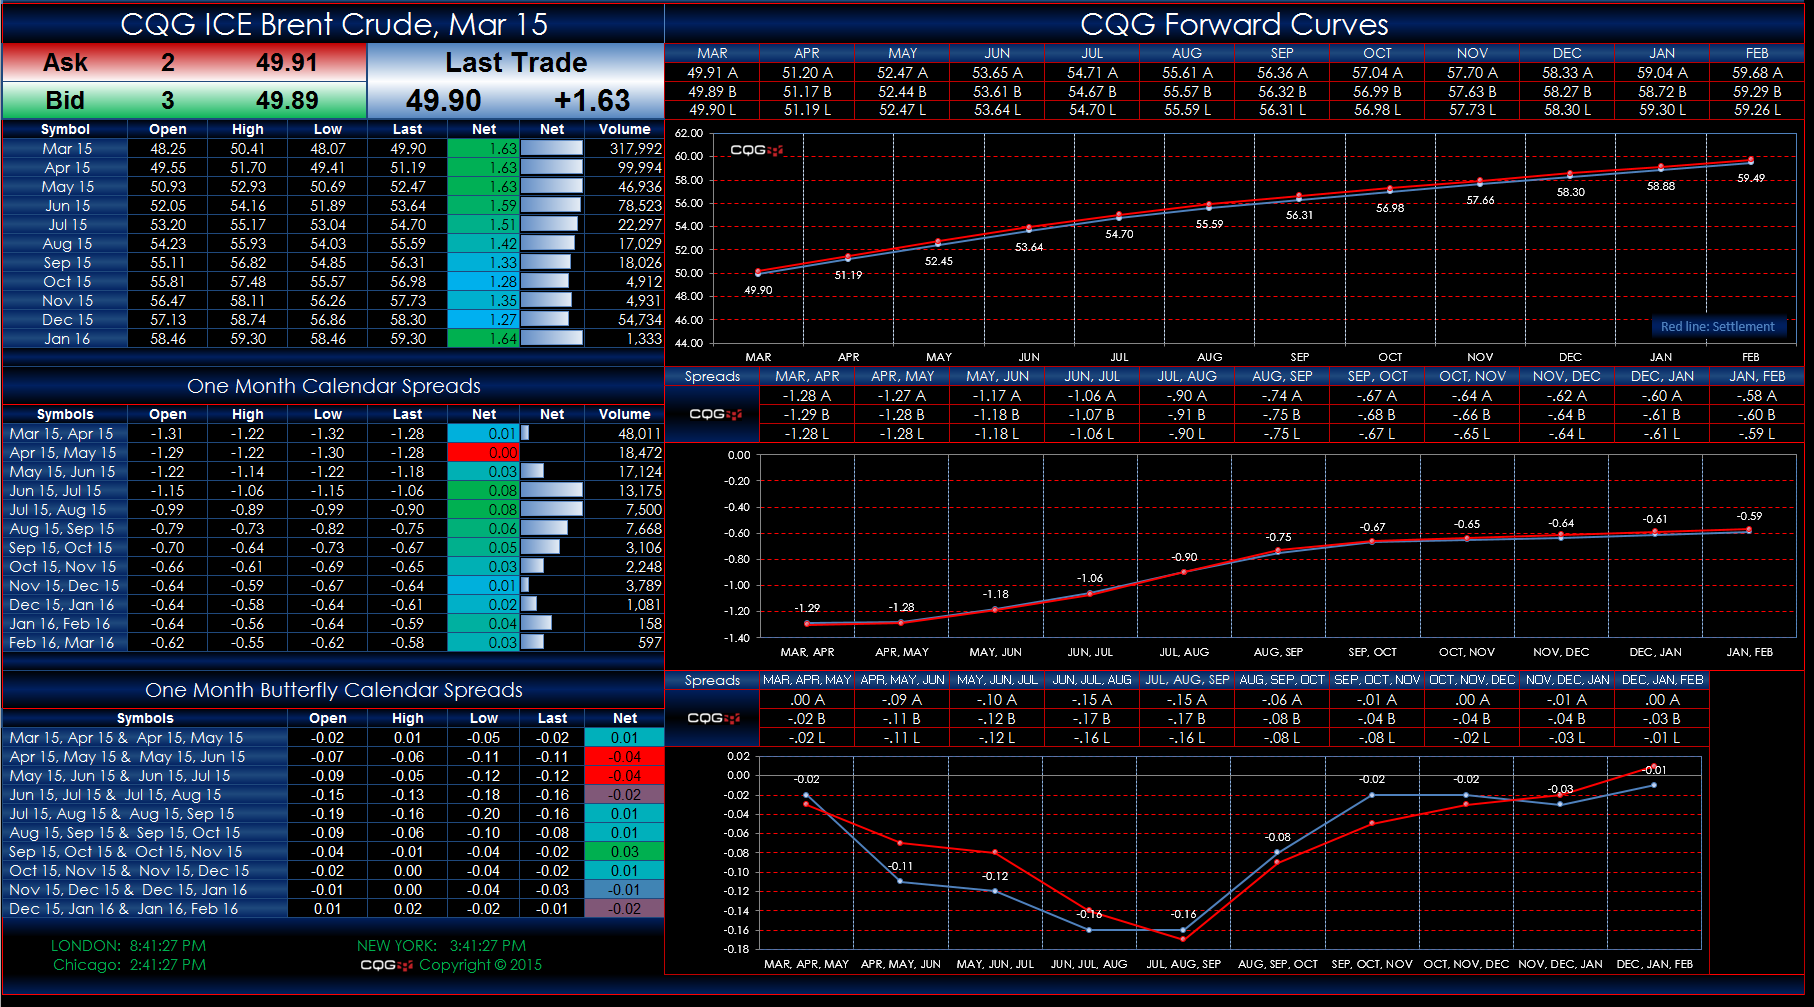
These two Microsoft Excel® spreadsheets present market data and forward curves of the Globex Crude Light Oil and ICE Brent Crude Oil contracts. The data includes the outrights, exchange-traded… more
Workspaces
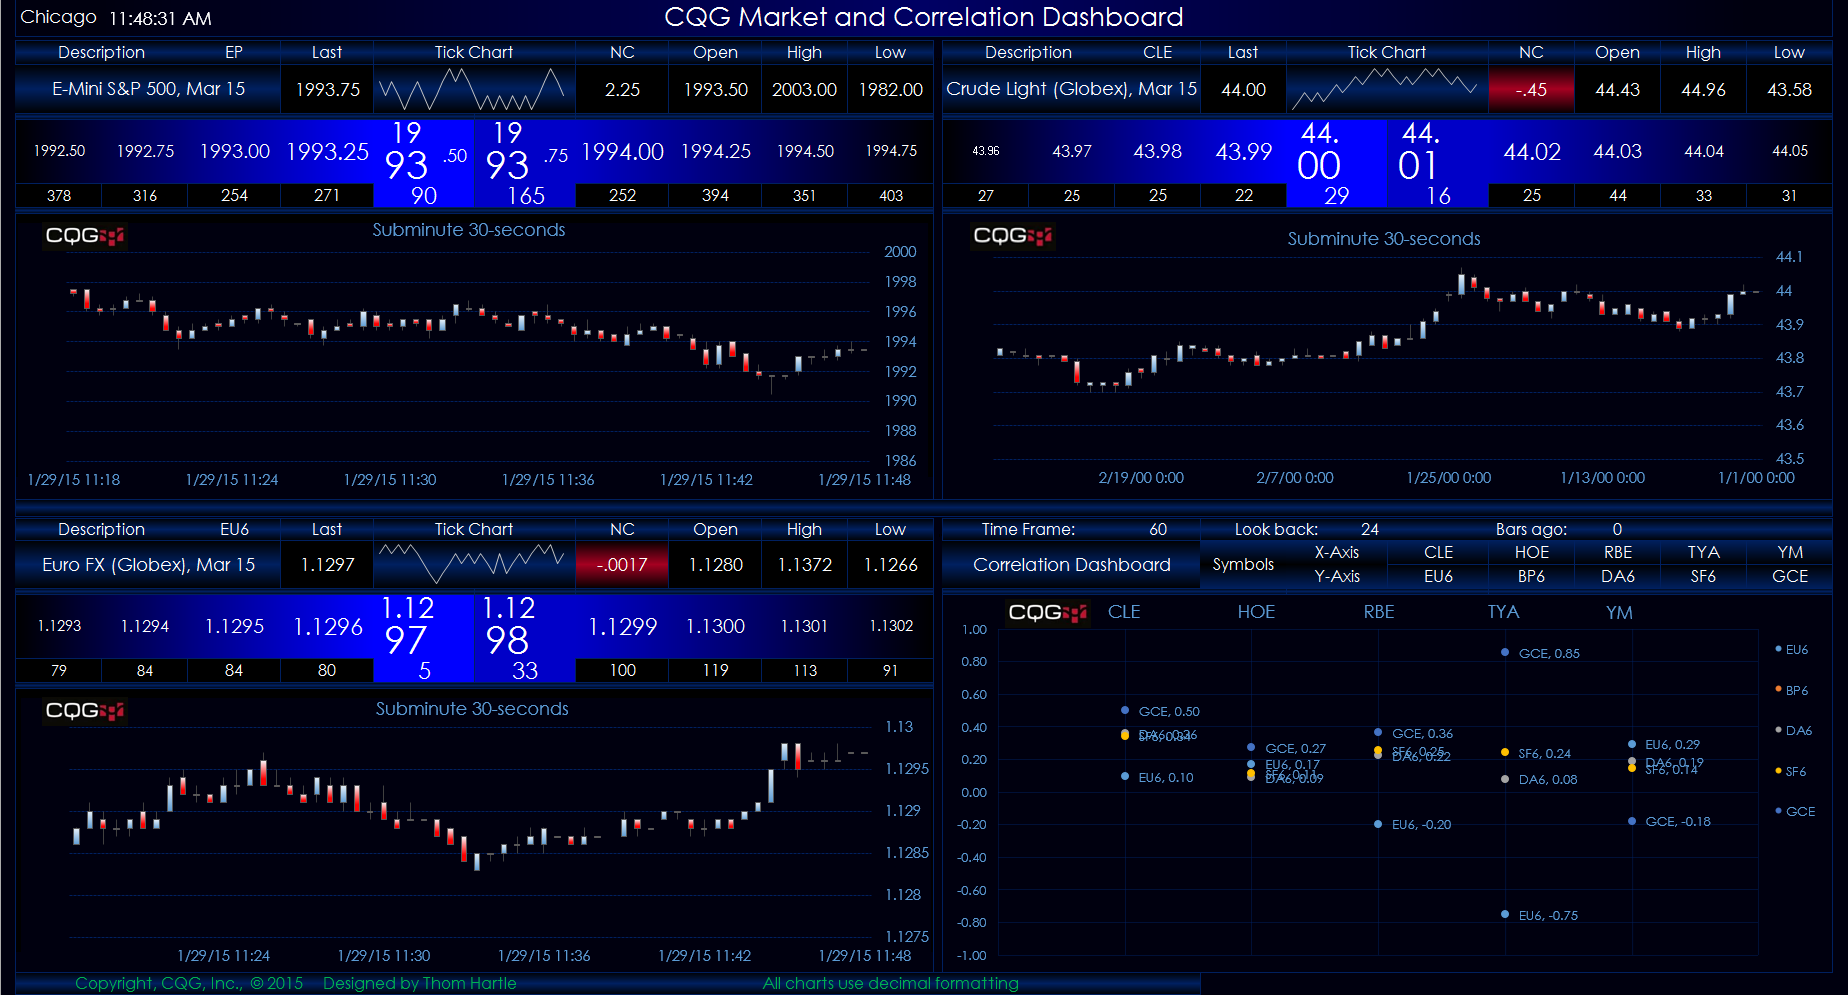
This Microsoft Excel® spreadsheet uses a horizontal DOM display with FX-style formatting of the best bid and best ask for three markets along with bar or sub-minute charts. The fourth display is a… more
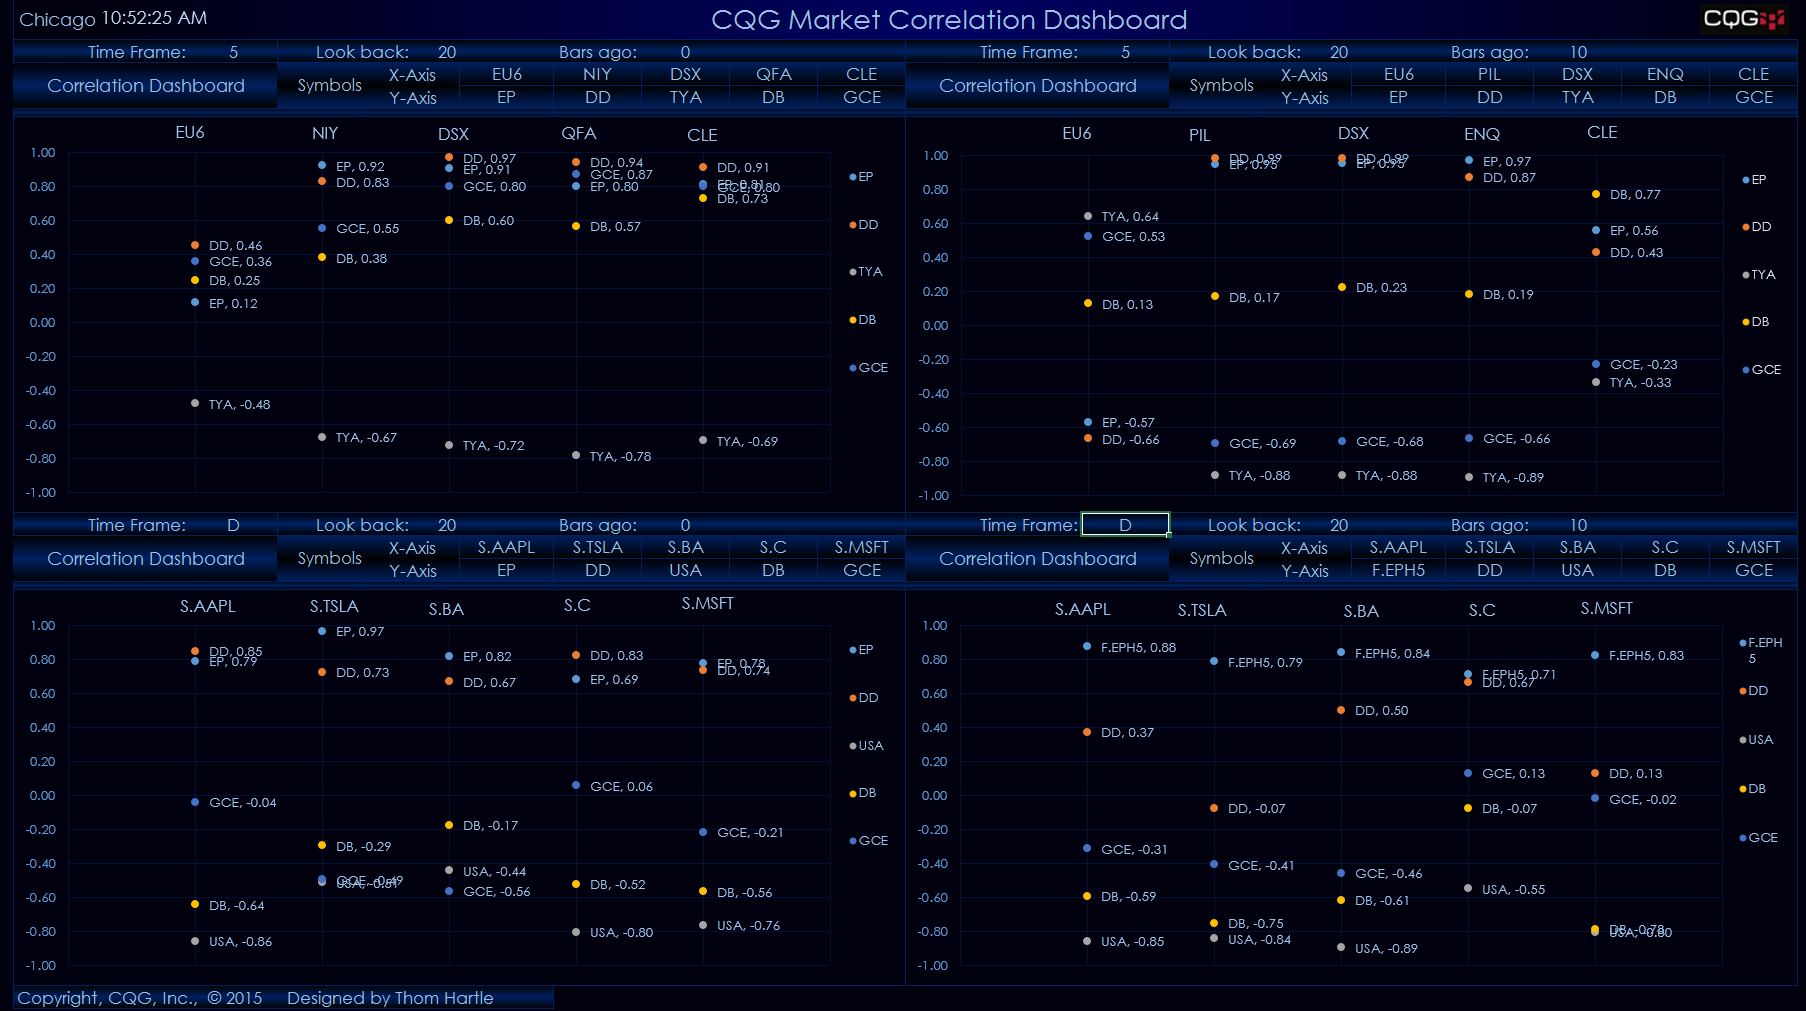
This Microsoft Excel® spreadsheet uses a quadrant format to display correlations. For each quadrant, you can enter five symbols for the horizontal axis and five symbols for the vertical axis. You… more
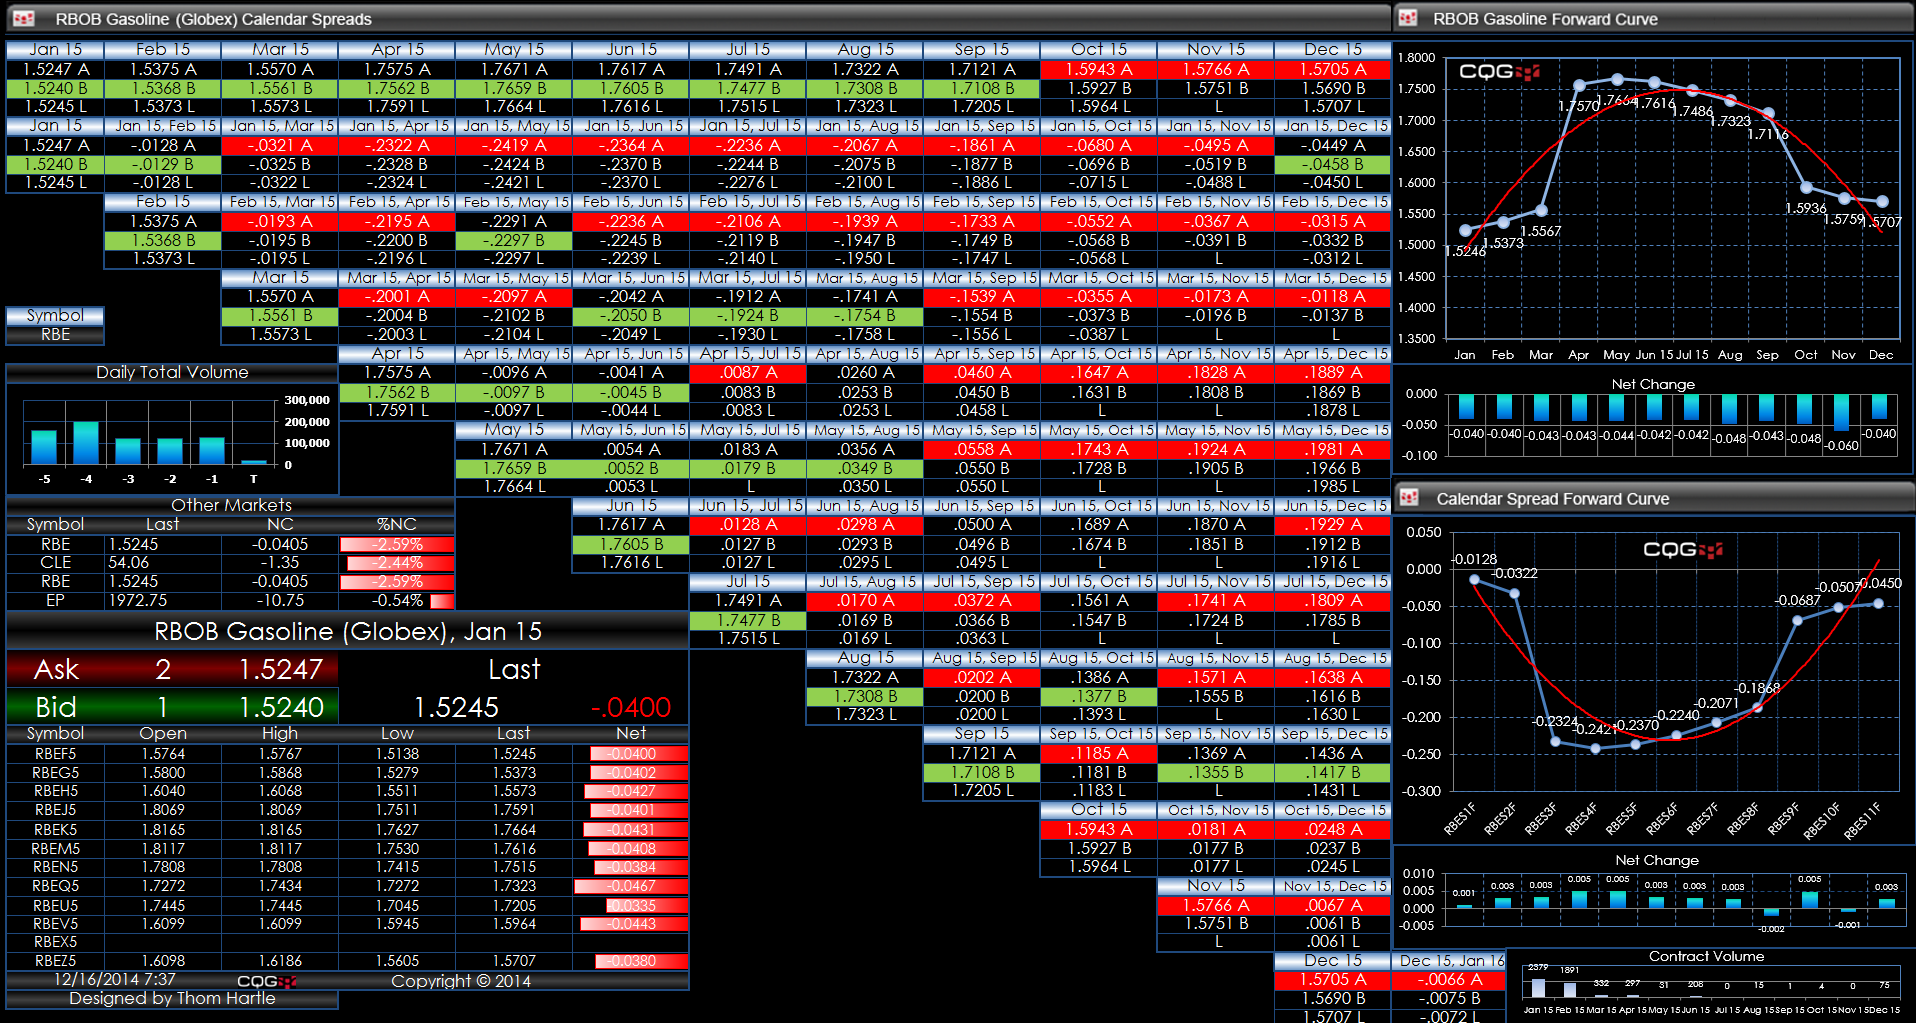
This Microsoft Excel® spreadsheet uses a matrix format to show the RBOB gasoline market traded on the CME Globex electronic trading platform.
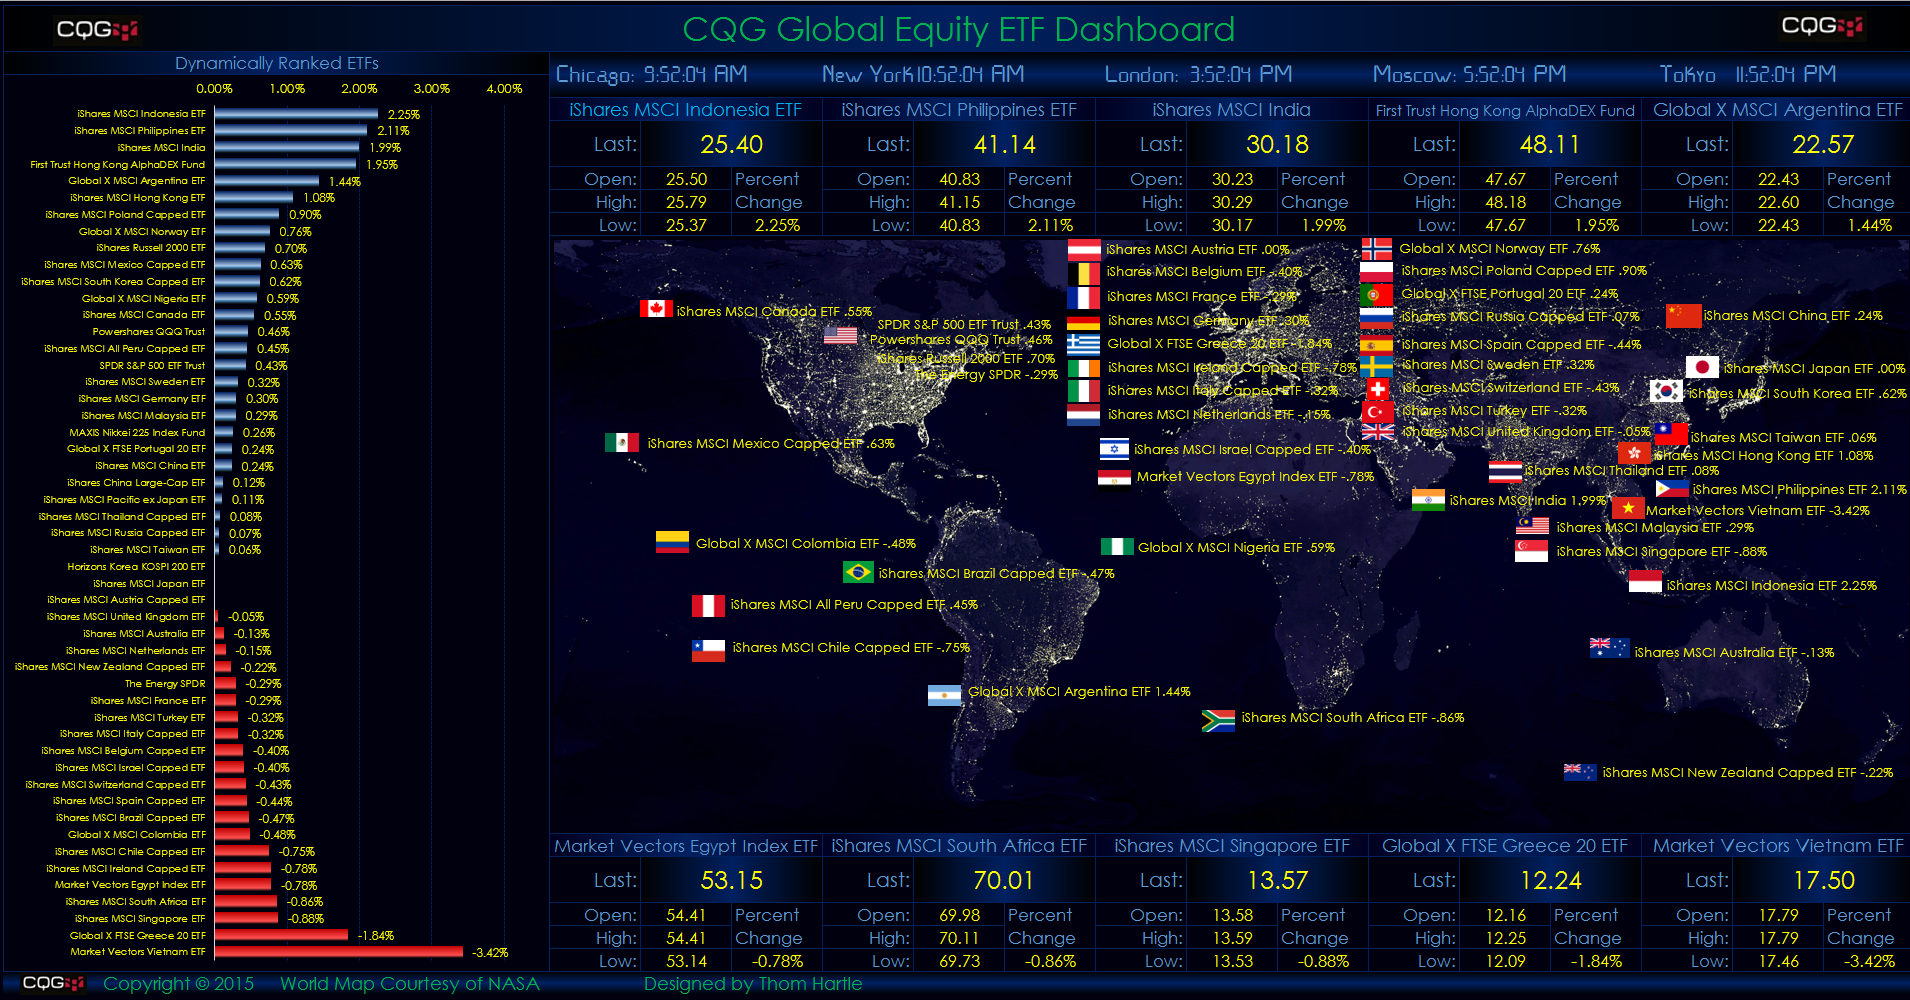
This dashboard screen capture shows the inside… more
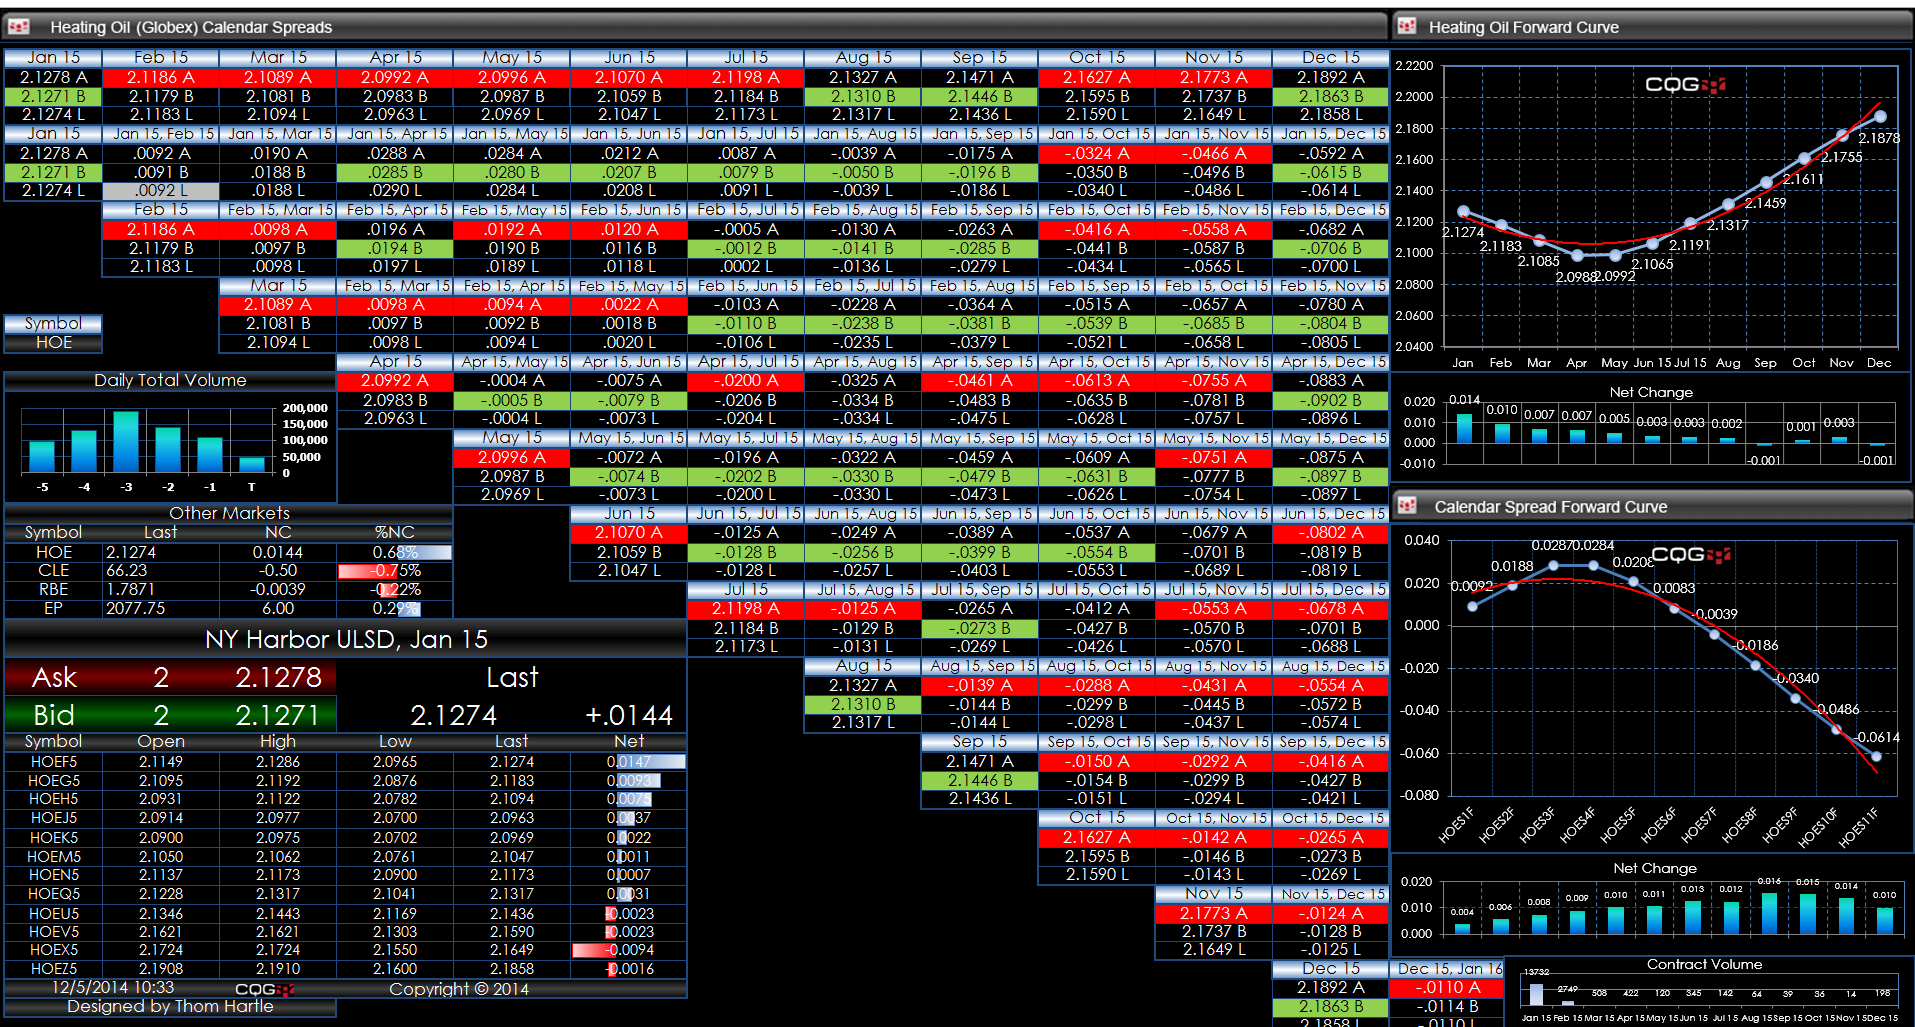
This Microsoft Excel® spreadsheet uses a matrix format to show the heating oil market traded on the CME Globex electronic trading platform.
This dashboard screen capture shows the inside… more
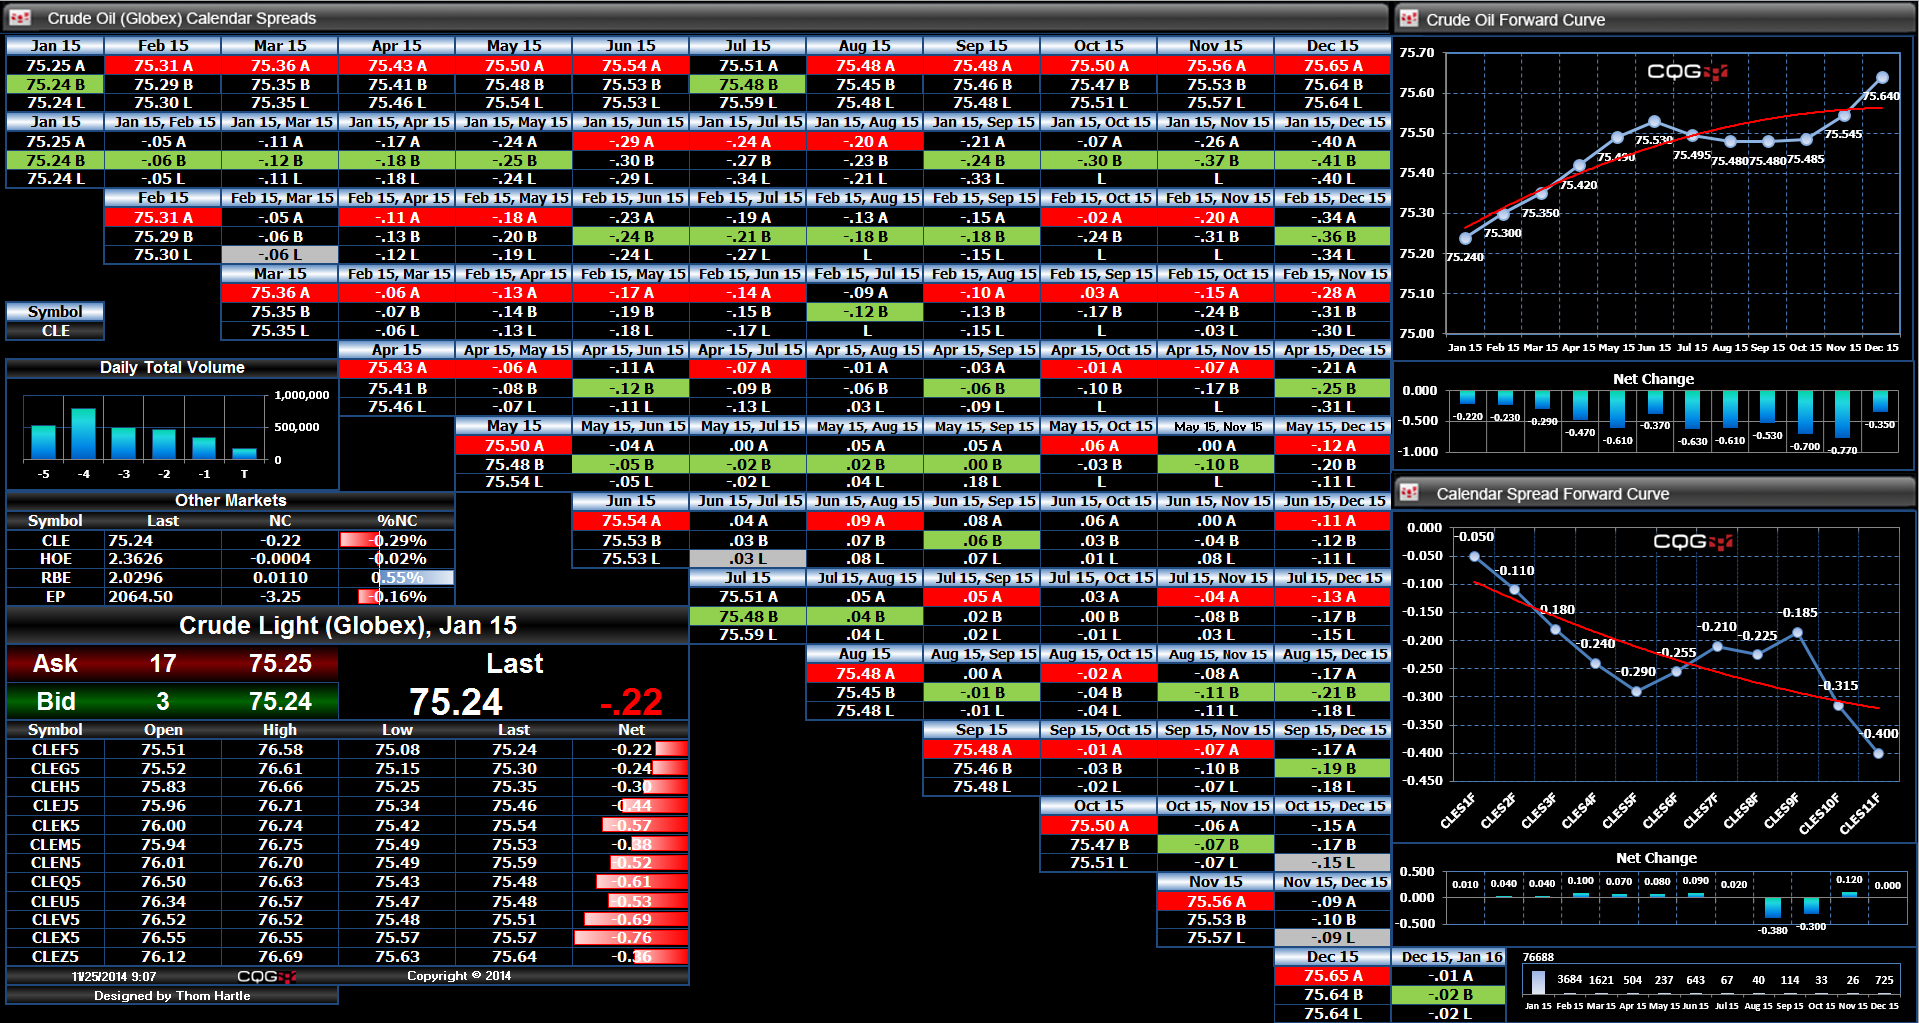
This Microsoft Excel® spreadsheet uses a matrix format to show the crude oil market traded on the CME Globex electronic trading platform.
This dashboard screen capture shows the inside… more
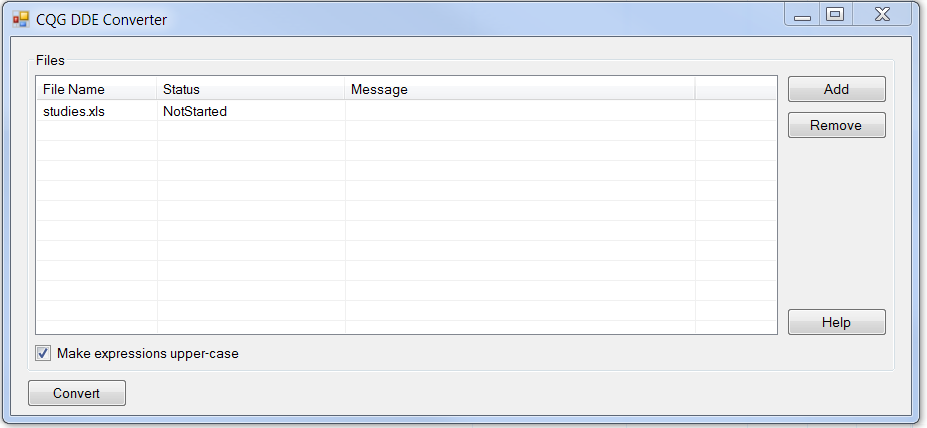
In order to smoothly transition from DDE to RTD, CQG provides a tool that converts all DDE-coded spreadsheets into RTD format. This zip file contains the converter for updating DDE coding in Excel… more
Version 3
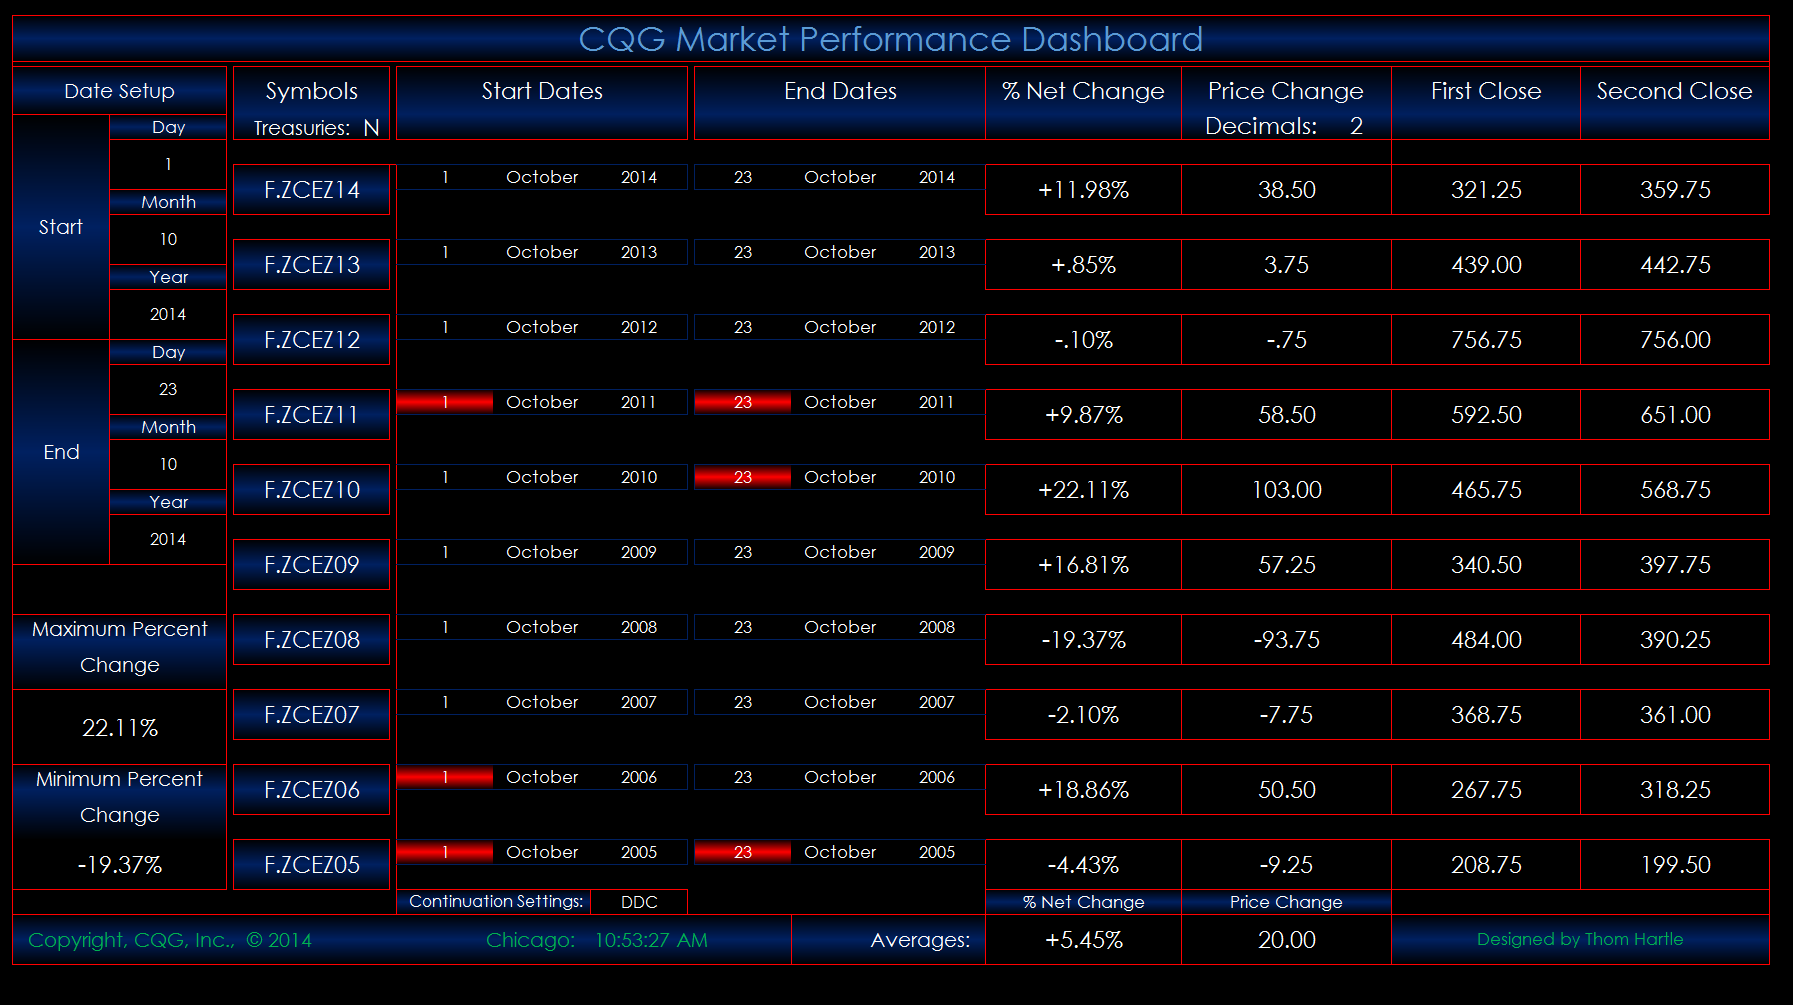
This CQG-powered Microsoft Excel® dashboard offers a ten-year performance review for a period defined by the user. You can use futures and stock symbols. Enter… more

This Microsoft Excel® dashboard displays current market data and five-minute, fifteen-minute, thirty-minute, and sixty-minute measurements of volatility. Volatility is defined as the upper twenty-… more
To help you design and manage your custom dashboards using CQG with Microsoft Excel®, Thom Hartle has written the following articles that answer the most common questions.
Topic Description… more