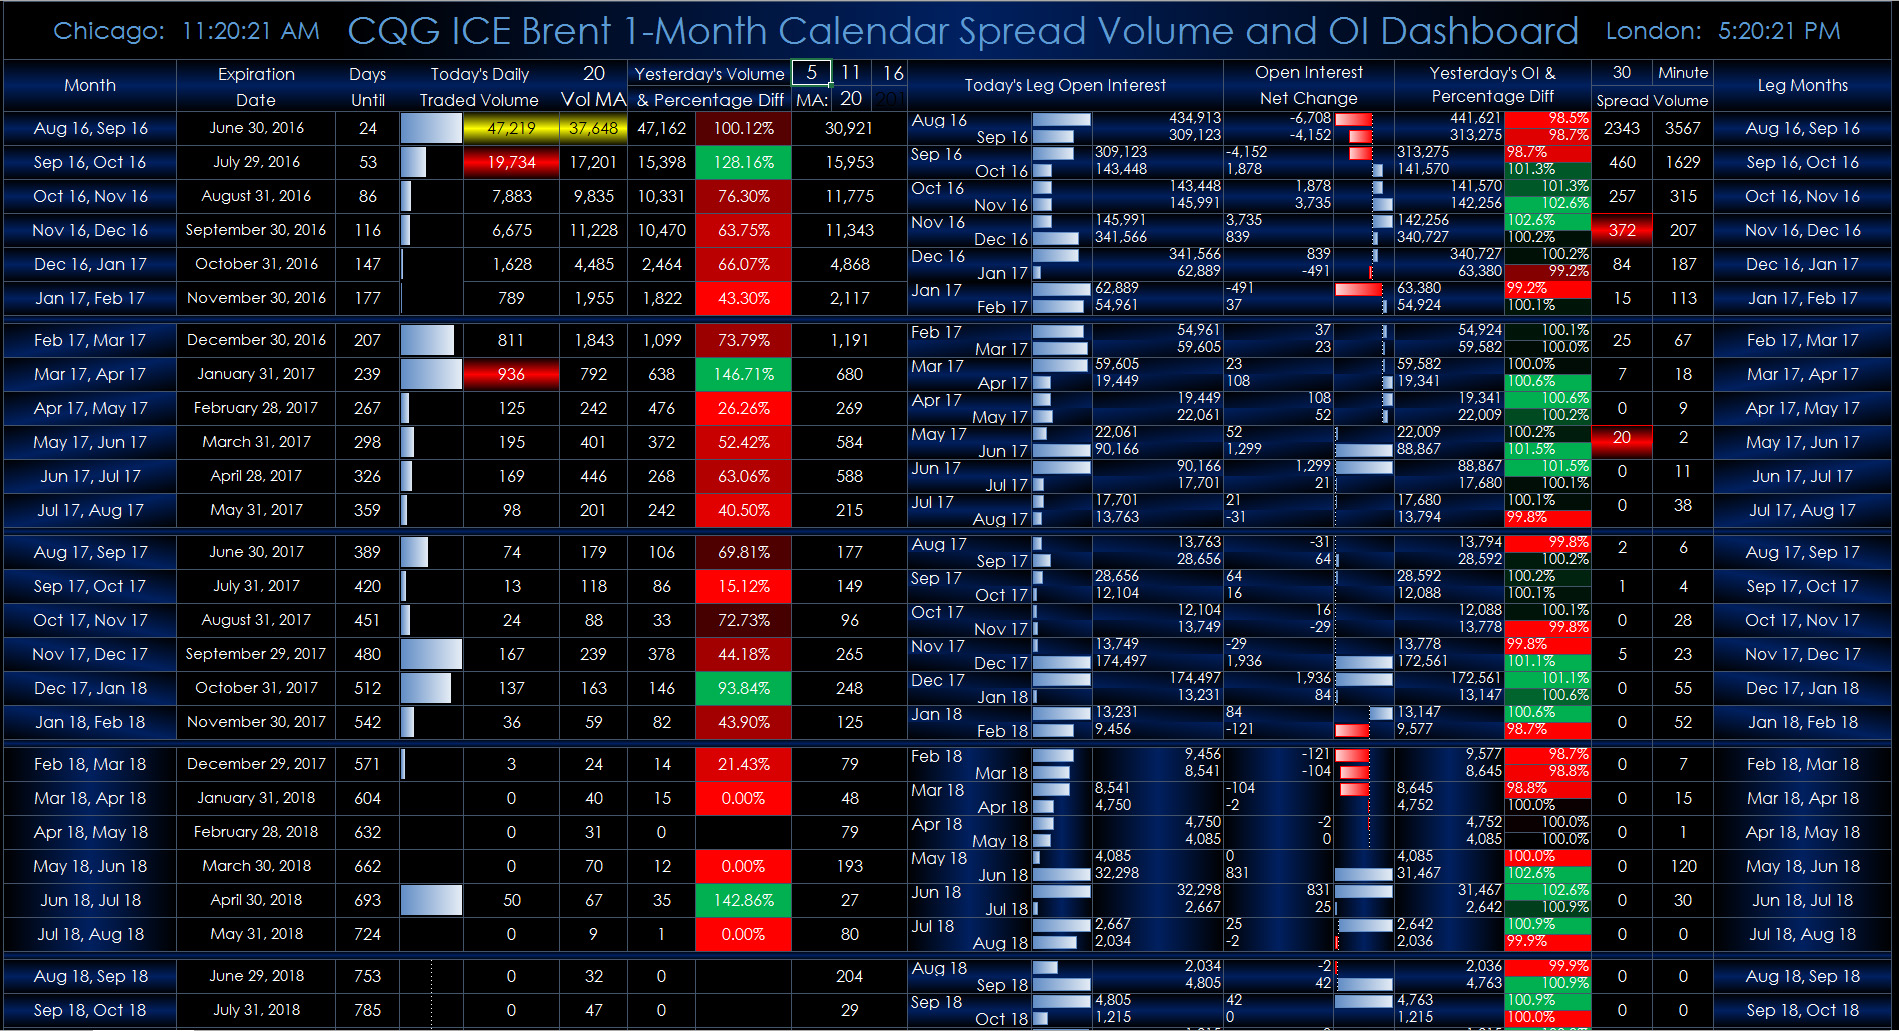
This Microsoft Excel® dashboard displays individual one-month Brent crude oil calendar spreads and their individual legs for tracking the volume and open interest rolls. All of the active… more
Workspaces
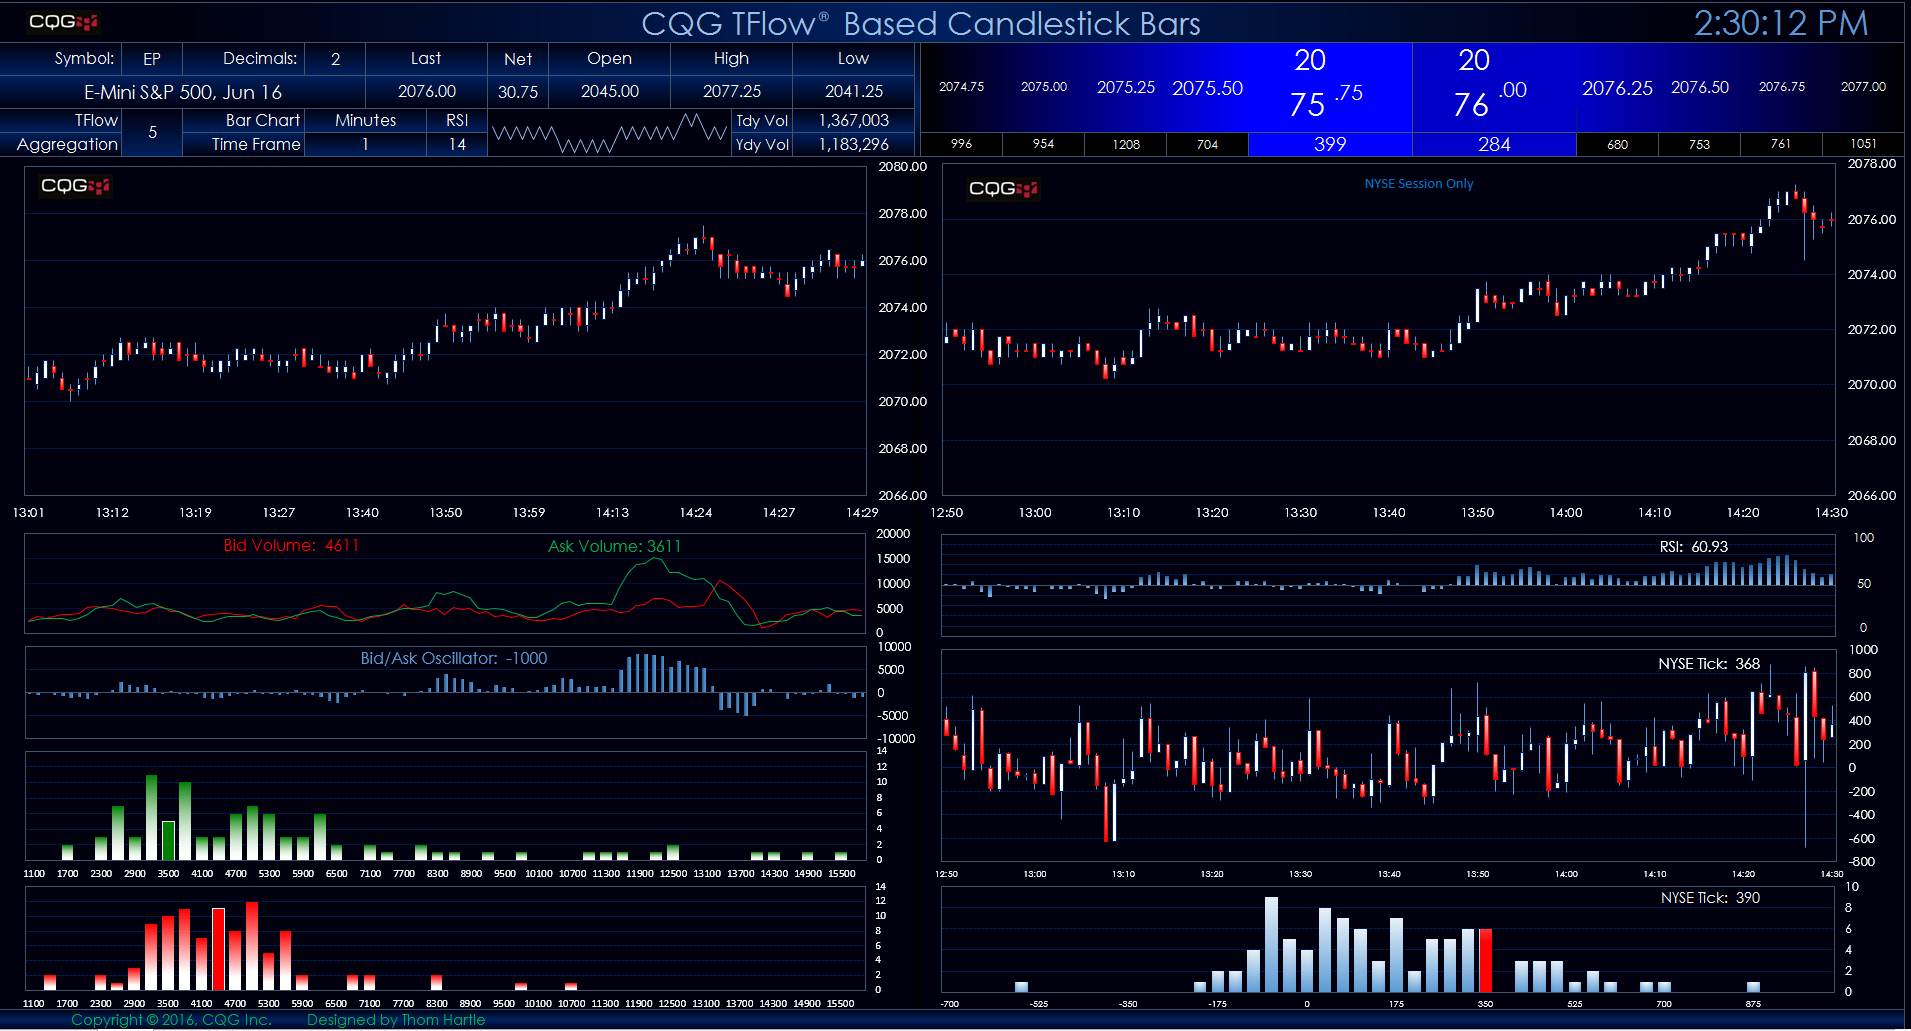
This Microsoft Excel® spreadsheet presents two views of the E-mini S&P contract. The left-hand view displays candlestick bars using CQG’s proprietary TFlow chart data. You can use the… more
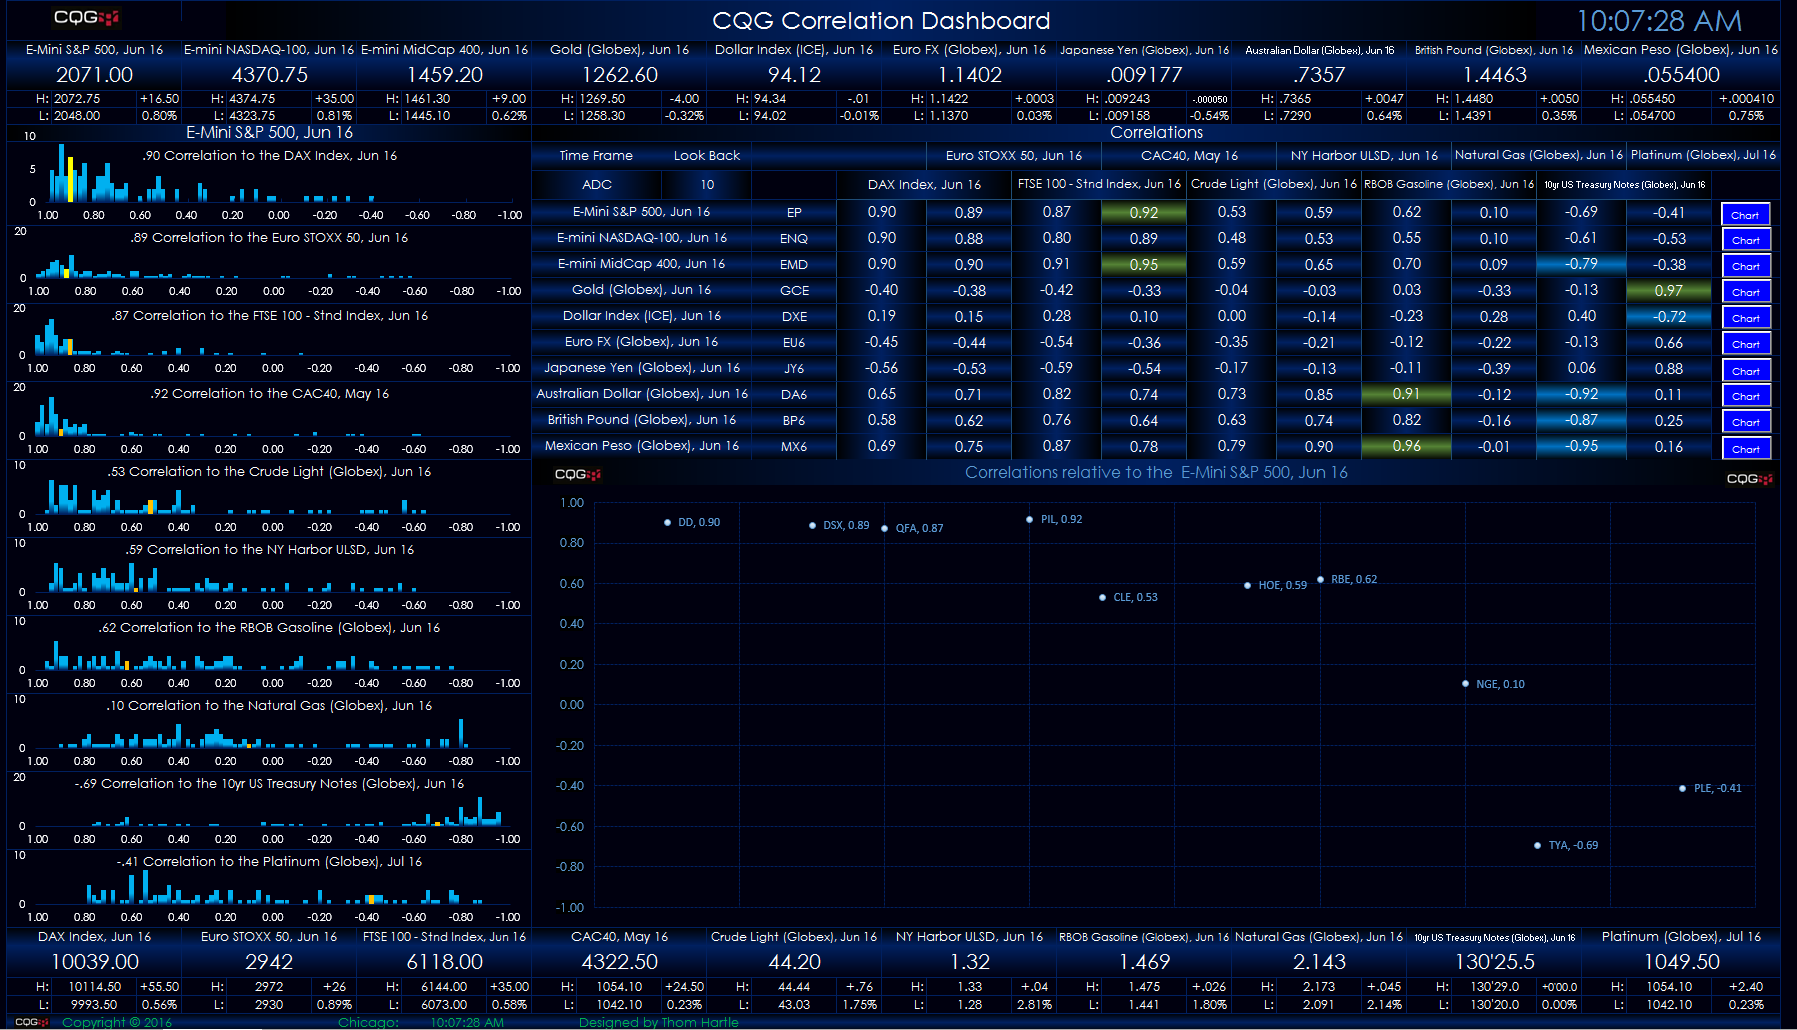
This Microsoft Excel® spreadsheet presents a ten-by-ten correlation matrix.
There is a symbols tab where you enter symbols and price formatting, such as two decimal places, etc. The… more
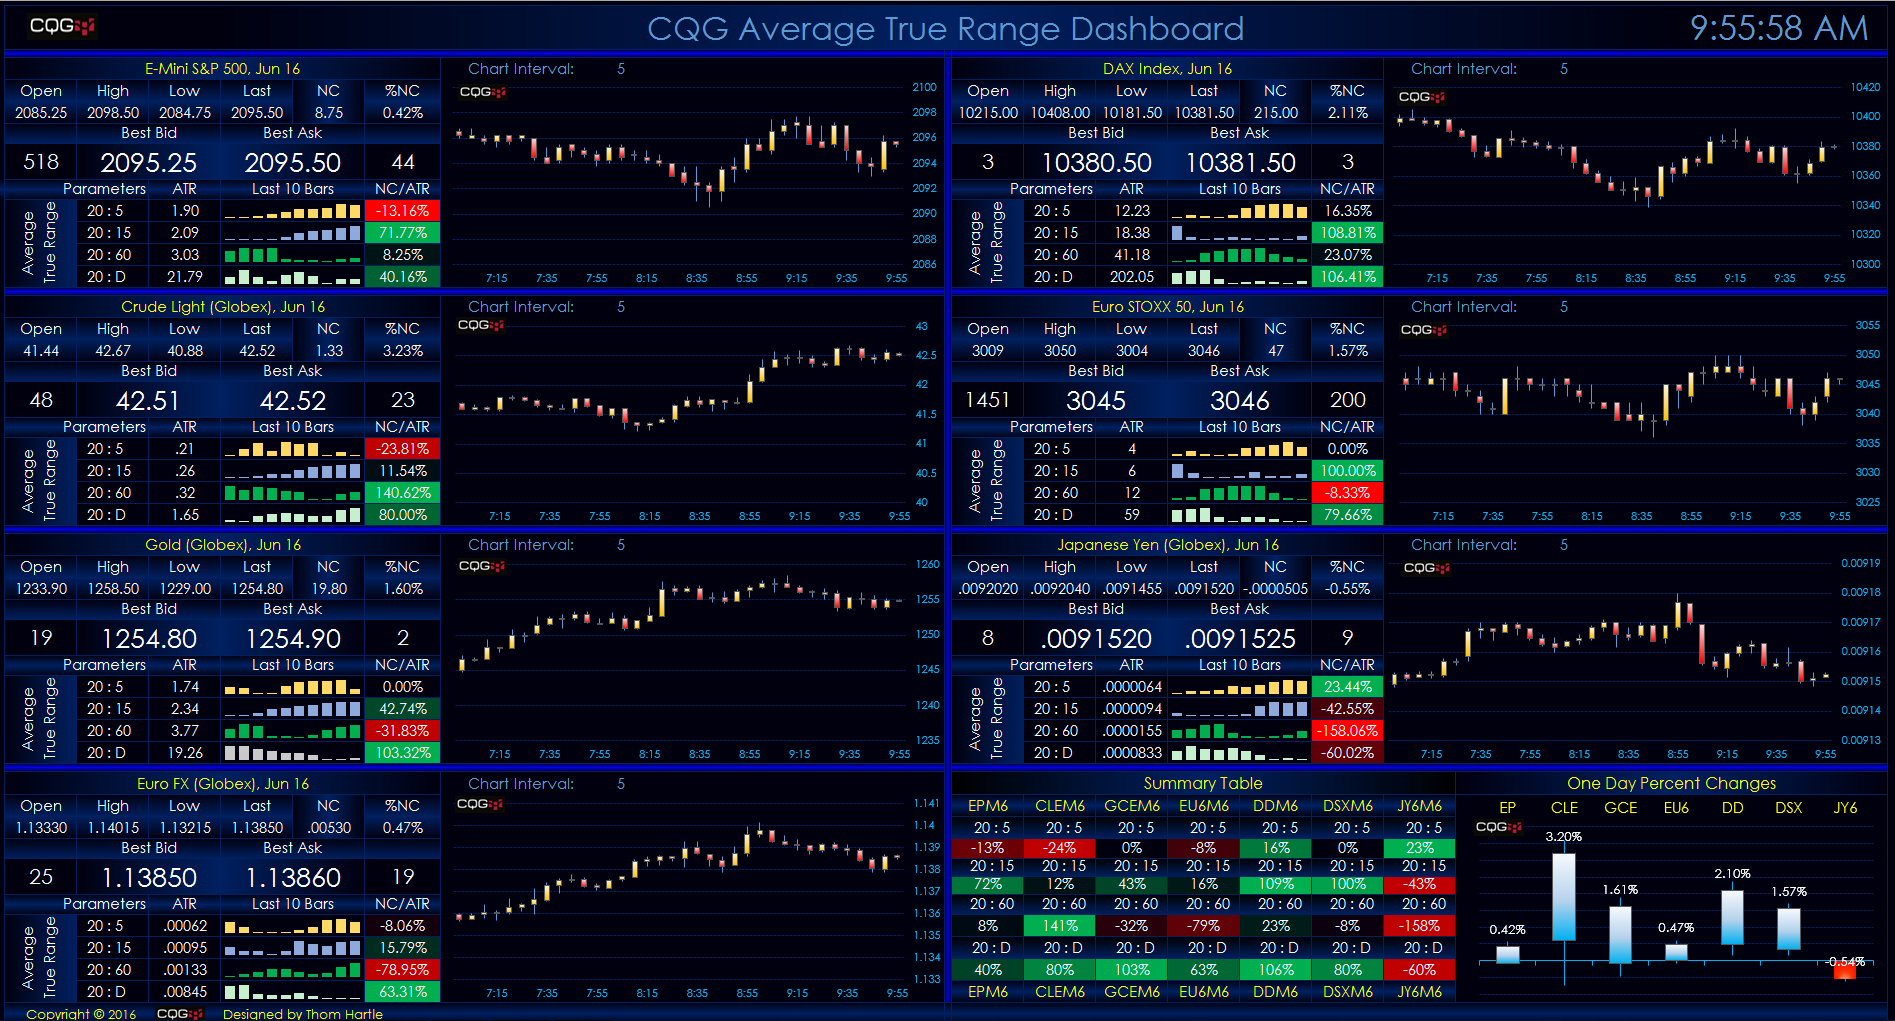
This Microsoft Excel® dashboard tracks four average true range study values for seven markets. On the Parameters tab you can enter the symbol, the number of decimals for prices, and the session… more
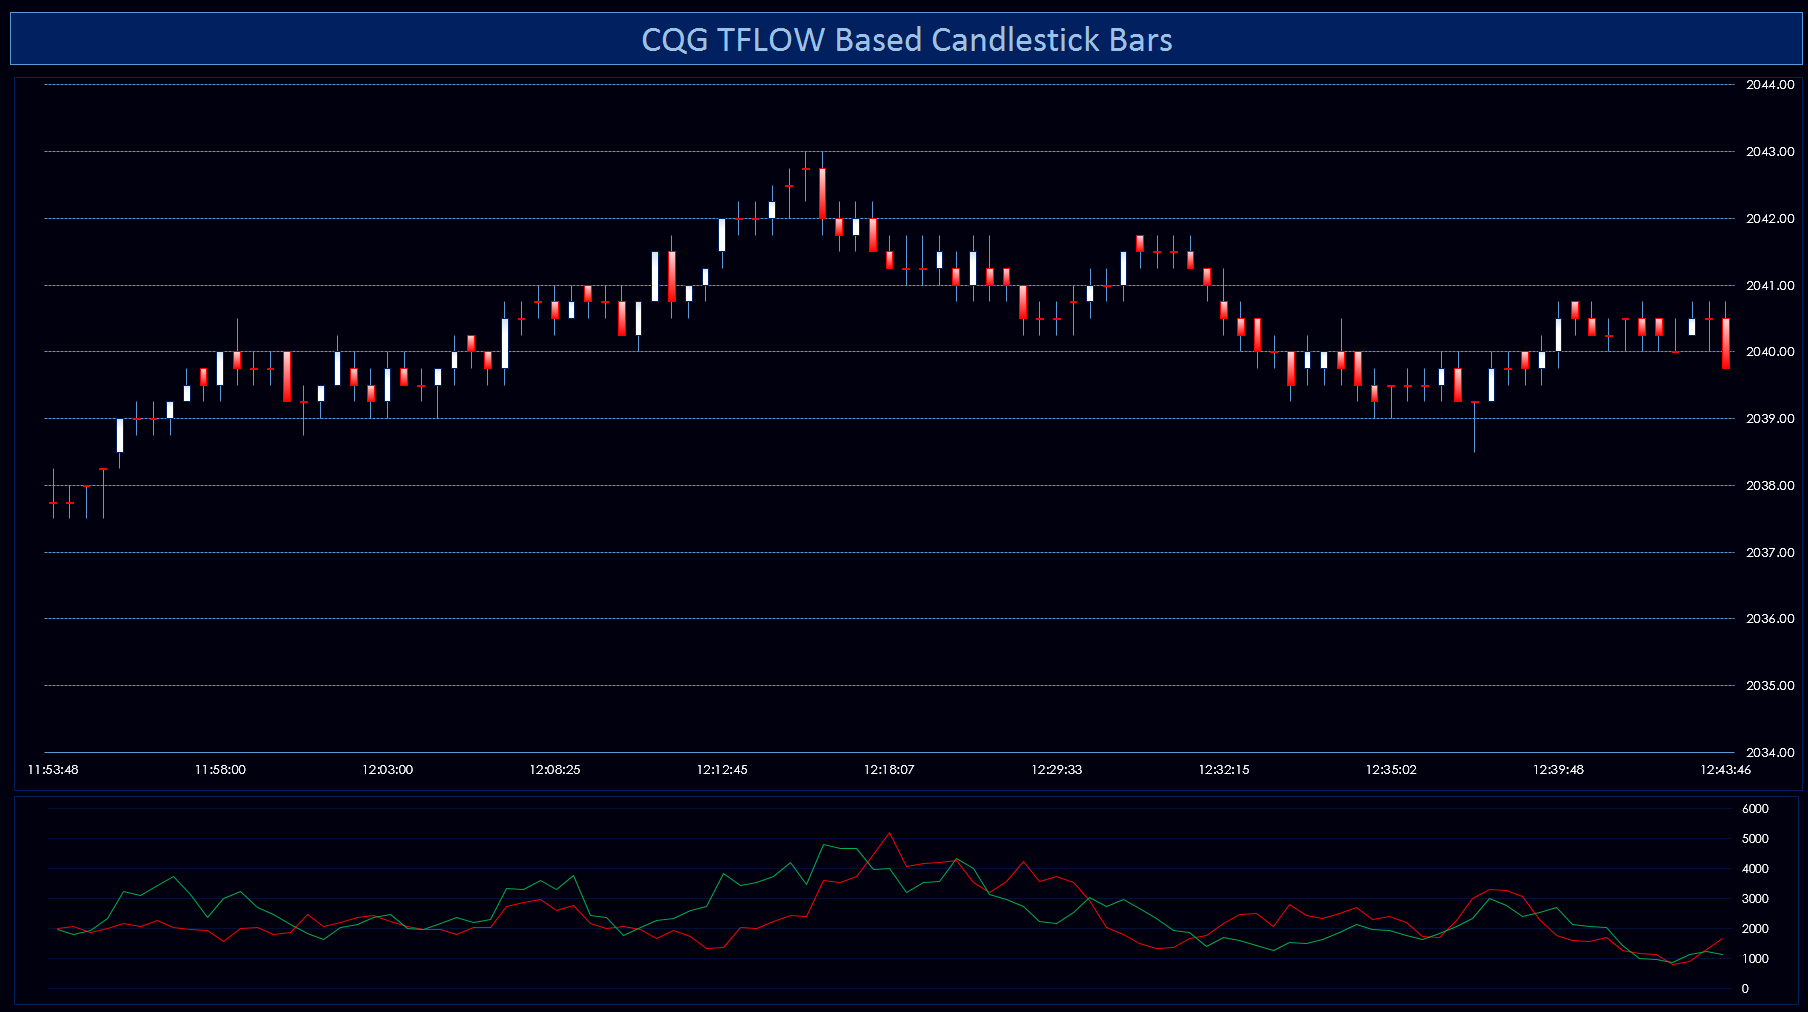
CQG offers exclusive TFlow® charts that show the inside market. There are RTD formulas to pull the TFlow chart data into Excel. While Excel cannot display the CQG TFlow chart data, it can use the… more
Customers using our flagship product, CQG Integrated Client (CQG IC), have access to a new study called Algo Orders. Using a proprietary algorithm, this trading activity indicator detects and… more
Customers using our flagship product, CQG Integrated Client (CQG IC), have access to a new study called Algo Orders. Using a proprietary algorithm, this trading activity indicator detects and… more
Customers using our flagship product, CQG Integrated Client (CQG IC), have access to a new study called Algo Orders. Using a proprietary algorithm, this trading activity indicator detects and… more
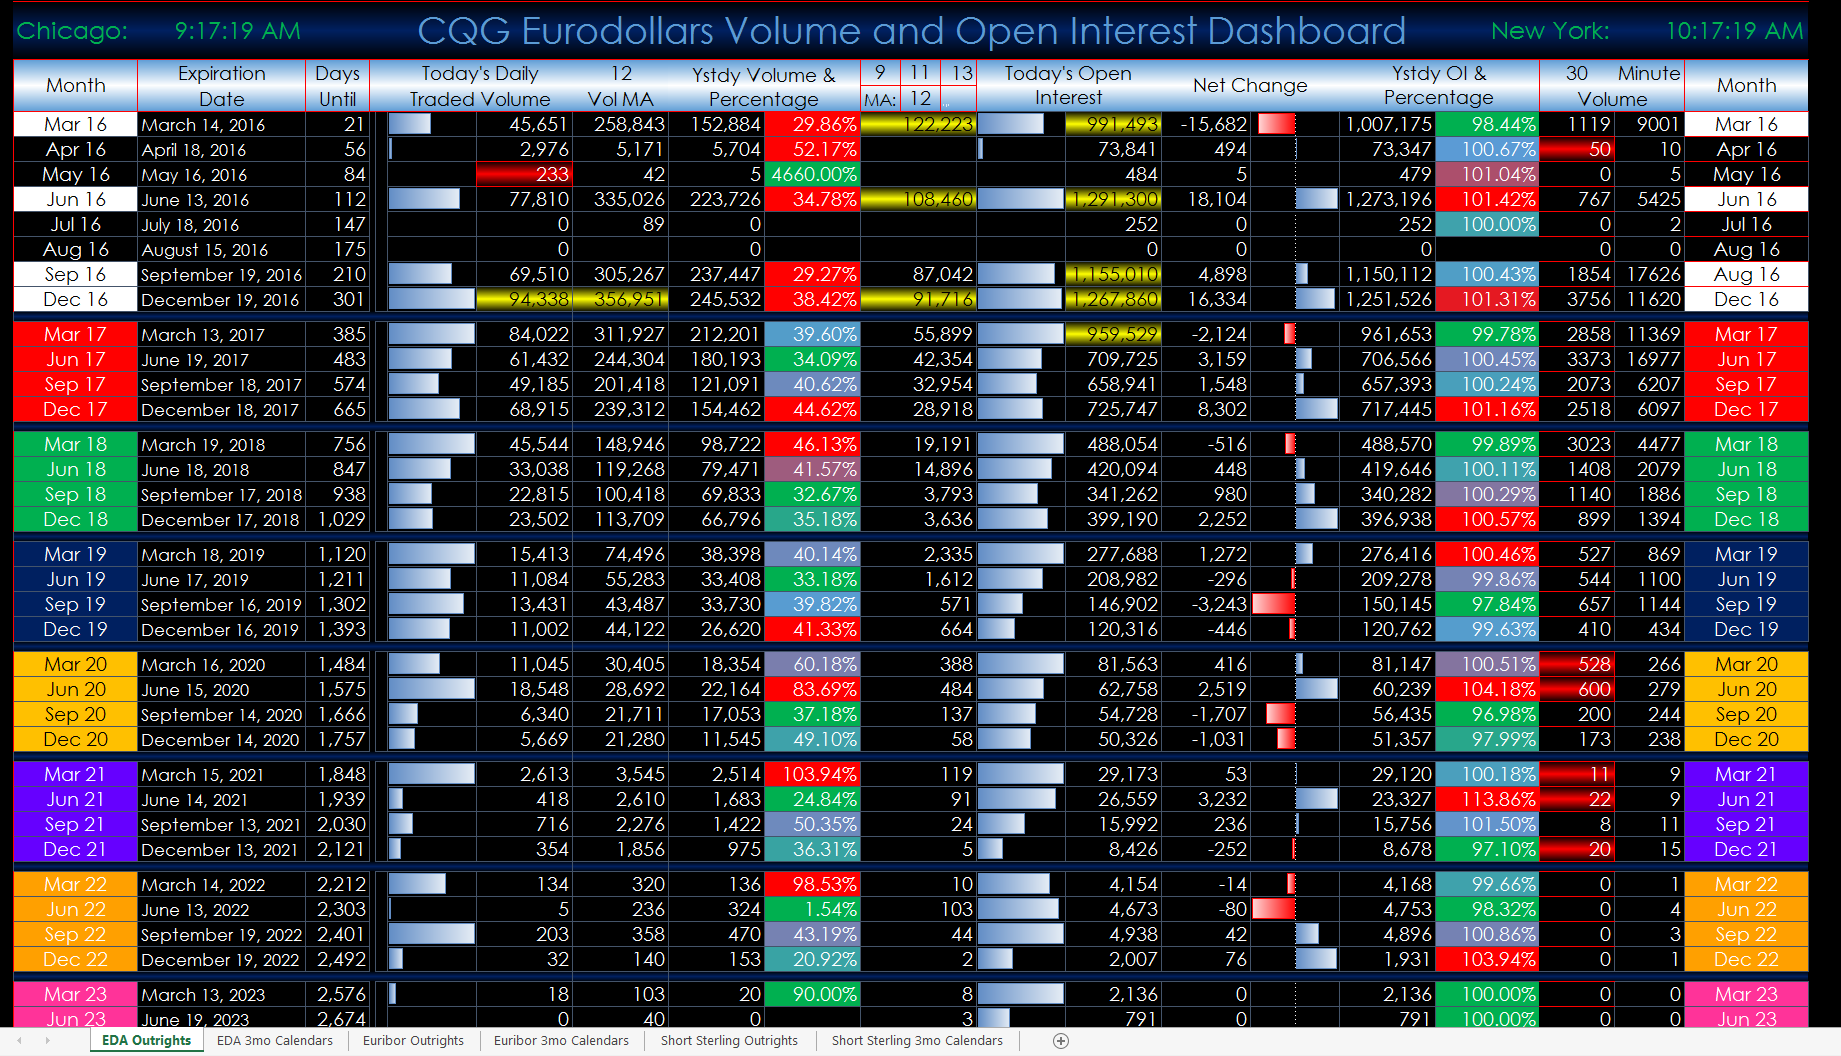
This Microsoft Excel® dashboard displays both outrights and individual three-month calendar spreads and their individual legs for tracking the rolls. The markets covered are the Globex-traded… more

This Microsoft Excel® dashboard displays individual Euribor 3-month calendar spreads and their individual legs for tracking the rolls. All of the active deliveries for each individual symbol are… more