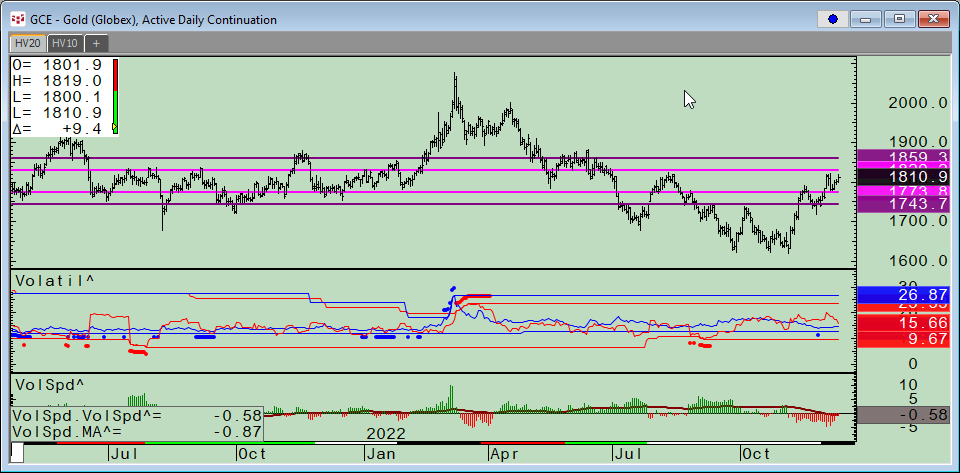
CQG Product Specialist Stan Yabroff designed a CQG page for customers to track and analyze a market’s implied volatility and historical volatility. This post details the features and functionality… more
Workspaces

Powered by CQG FX, this Microsoft Excel® dashboard measures volatility by using the difference between the upper and lower Bollinger Bands and dividing the difference by the Moving Average. The… more

This Microsoft Excel dashboard measures volatility by using the difference between the upper and lower Bollinger Bands and dividing the difference by the Moving Average. The dashboard then sorts… more