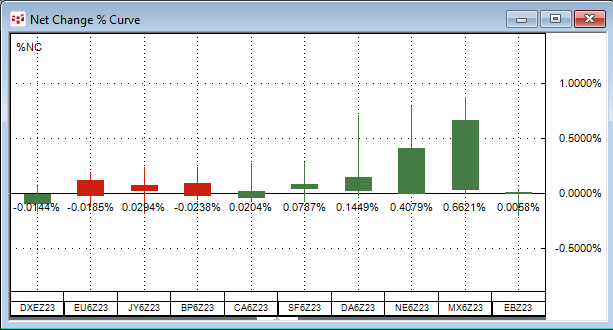
The Net Change Curve chart displays a collection of symbols’ daily net price change or daily net percentage change making it easy to compare on a relative basis each market’s current session’s… more
Workspaces
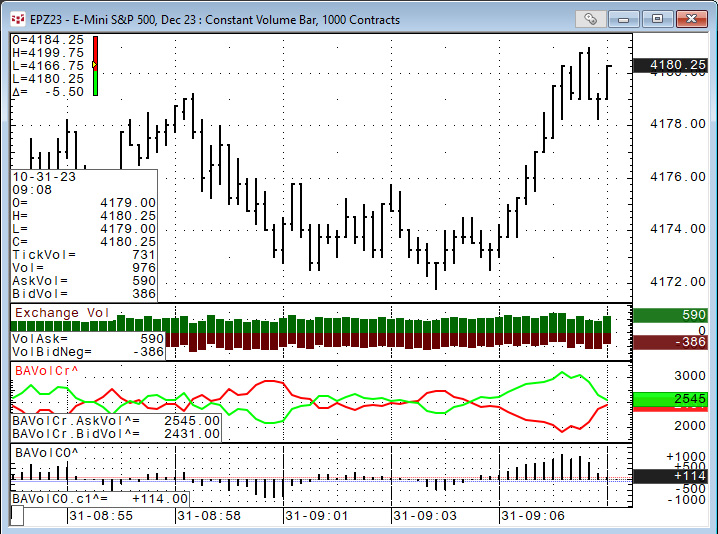
CQG IC and QTrader offer charts that utilize volume for the horizontal scale, not time. The first chart type to discuss is Constant Volume Bars.
Constant Volume Bar (CVB)
The Constant… more