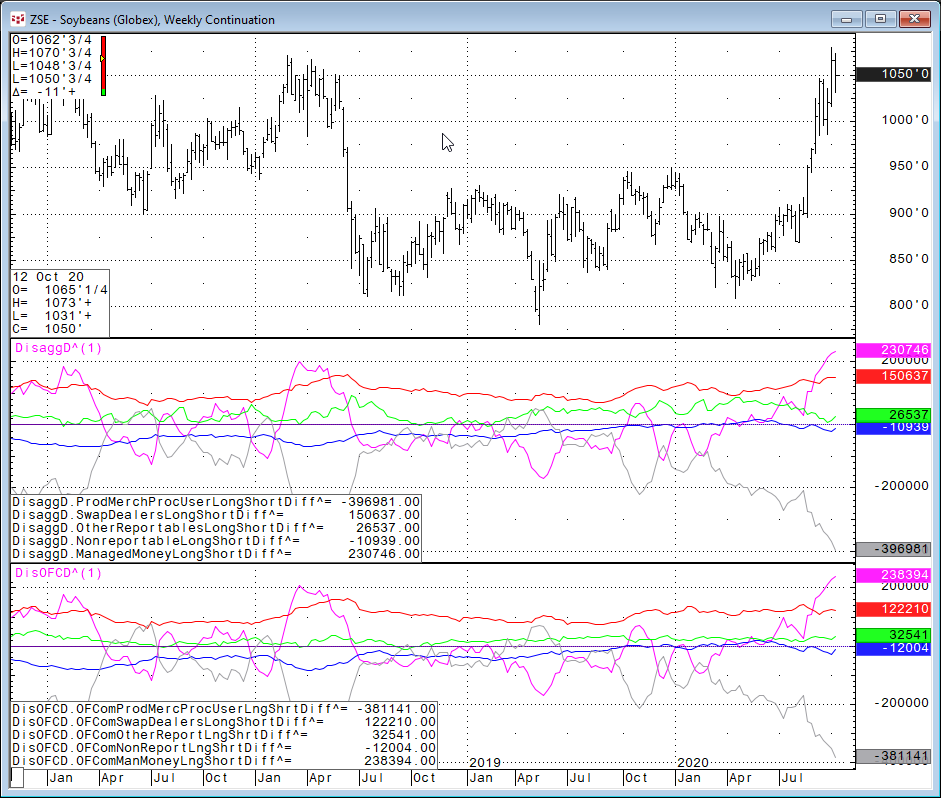
CQG has added more data to the Disaggregated group in the CQG Symbol Finder. Now, both the futures only and the combined futures and options data are available.The Disaggregated reports are broken… more
Workspaces
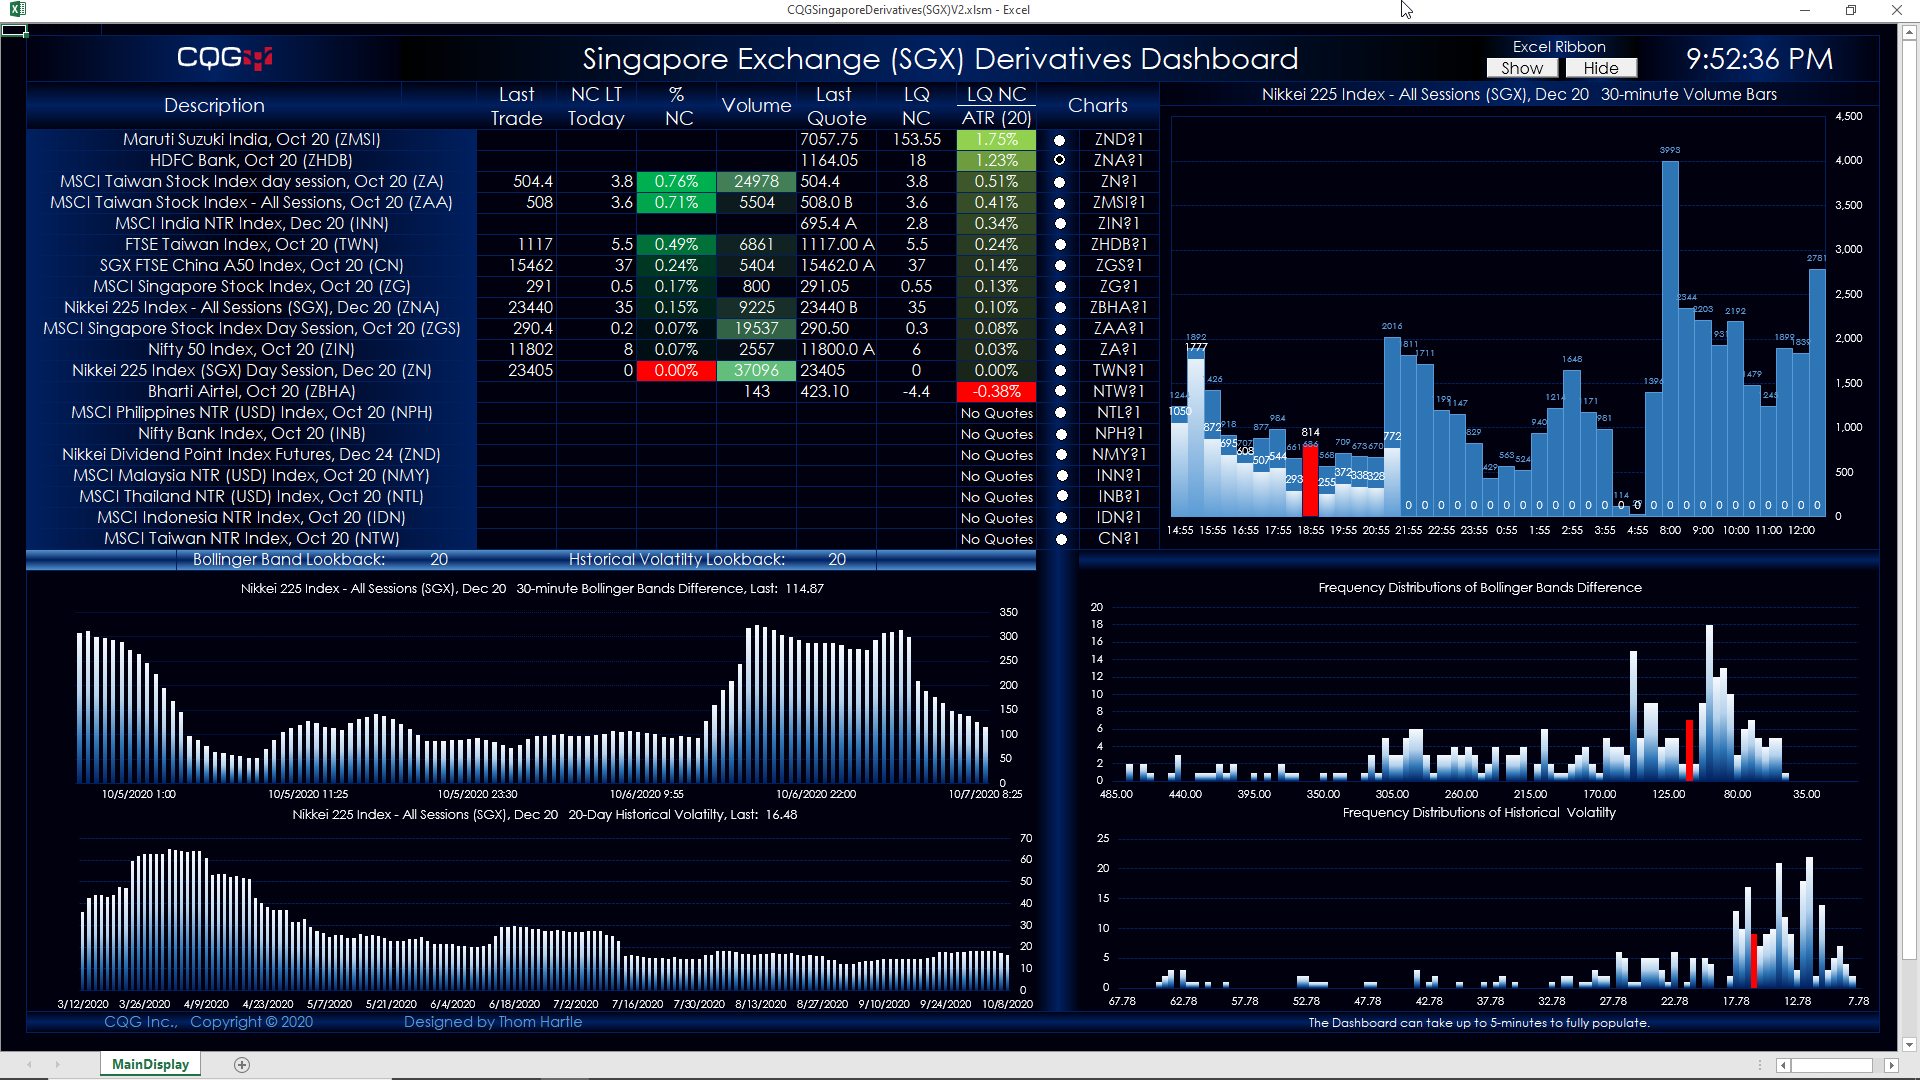
This Microsoft Excel® dashboard tracks the futures contracts traded on SGX. The symbol choices are hard coded and are the most popular by volume and open interest.
This dashboard… more
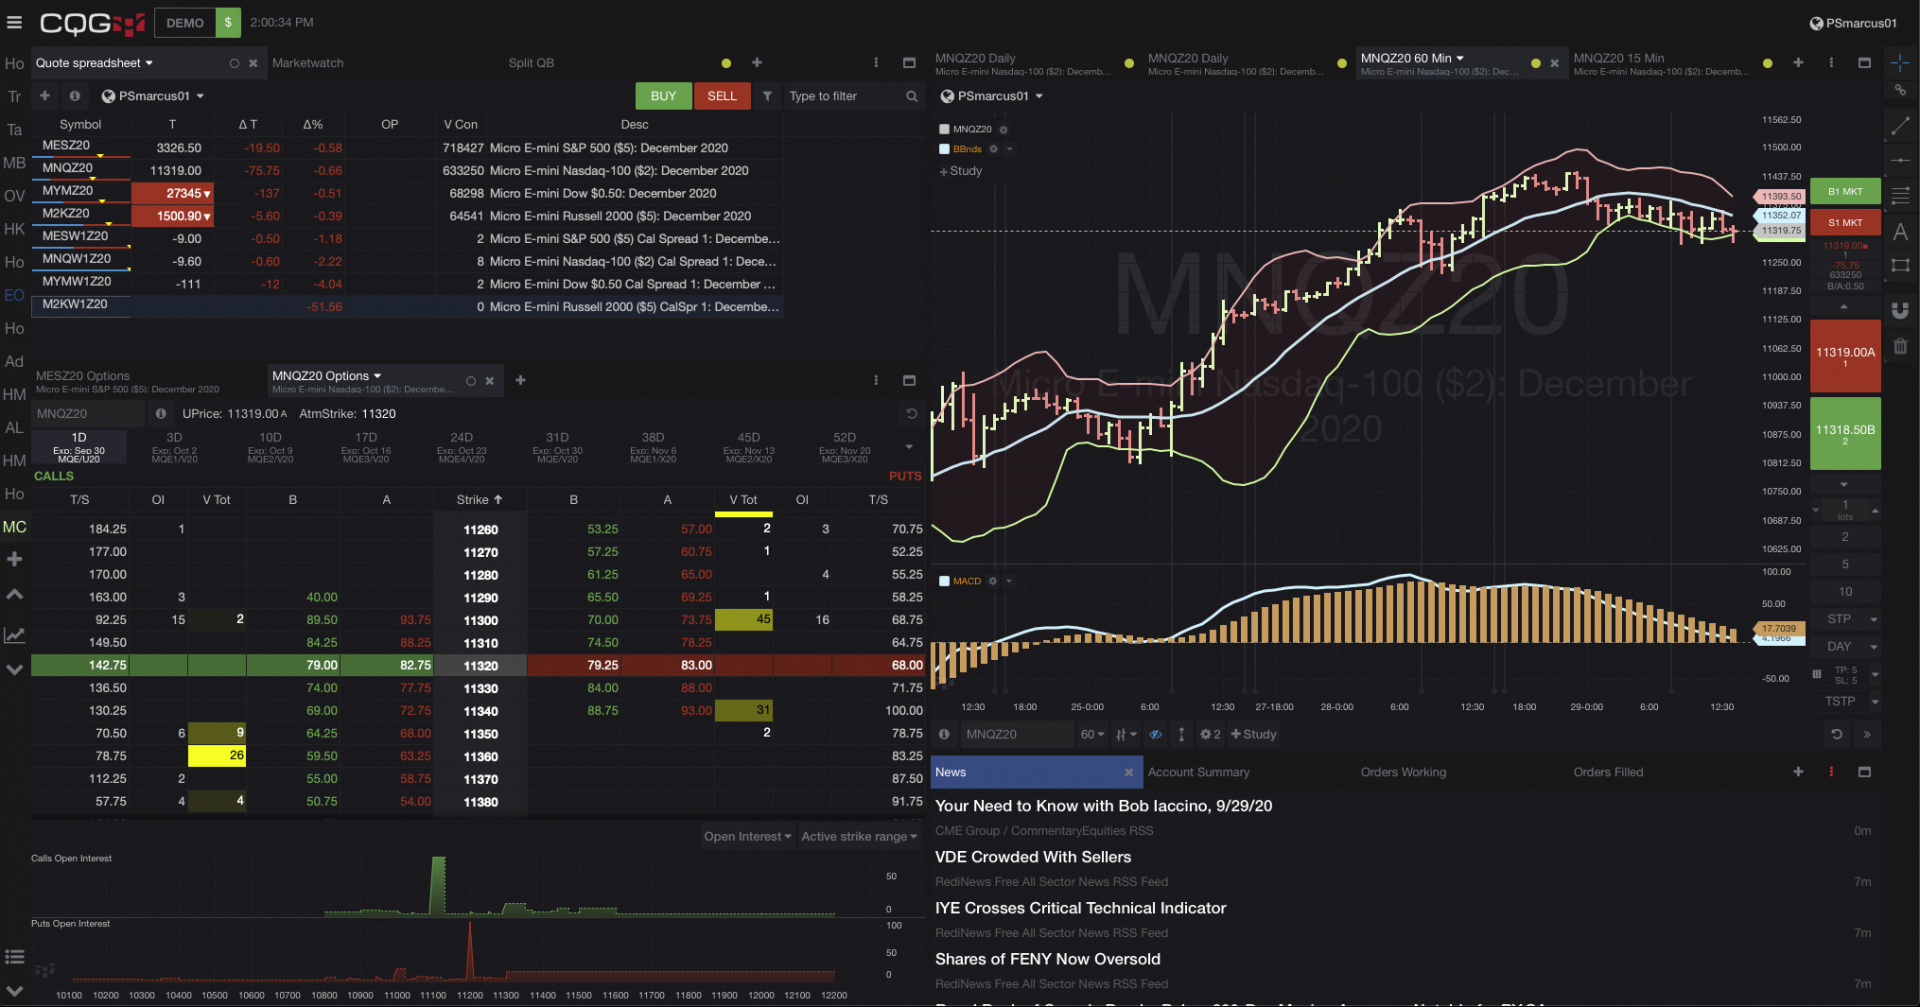
The CME Group has added Options on Micro Futures to their product offerings. These contracts are 1/10 the size of the E-mini futures on the S&P 500, Nasdaq-100, Dow Jones Industrial Average… more
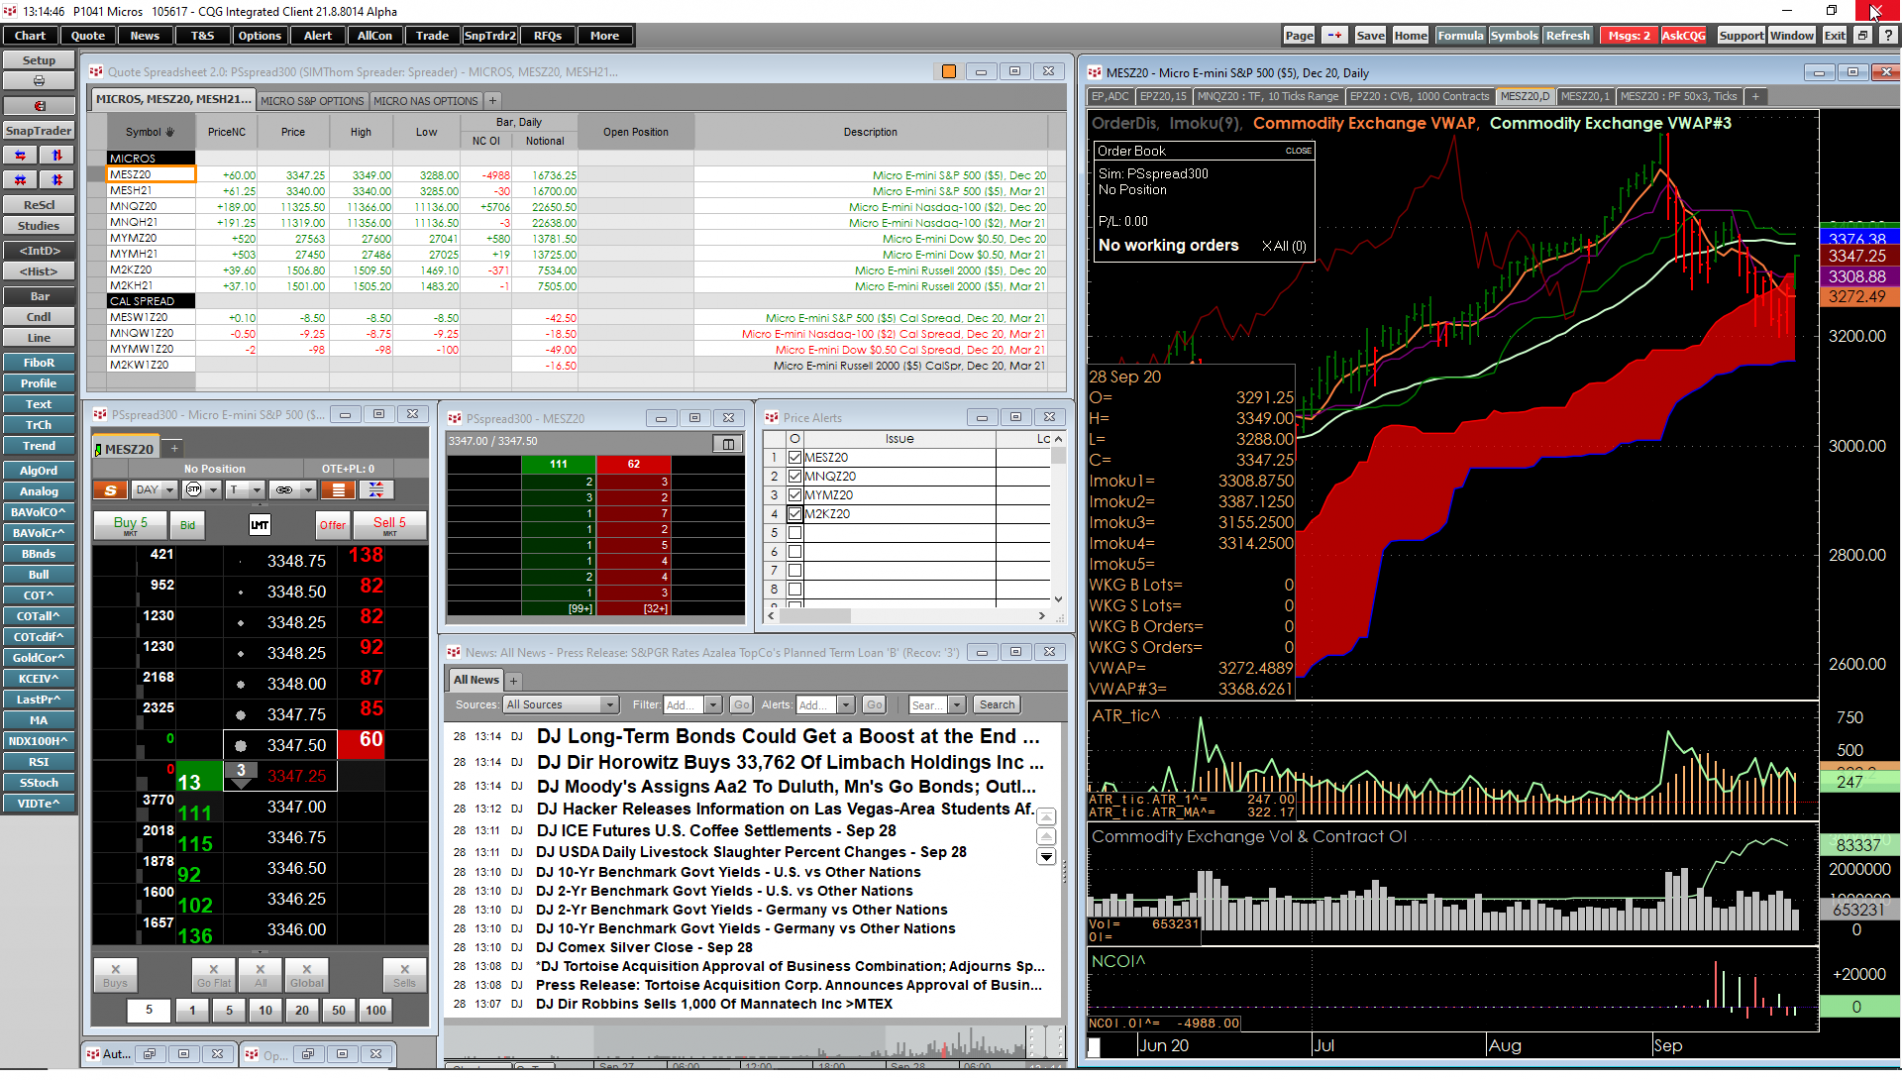
The CME Group has added Options on Micro Futures to their product offerings. These contracts are 1/10 the size of the E-mini futures on the S&P 500, Nasdaq-100, Dow Jones Industrial Average… more
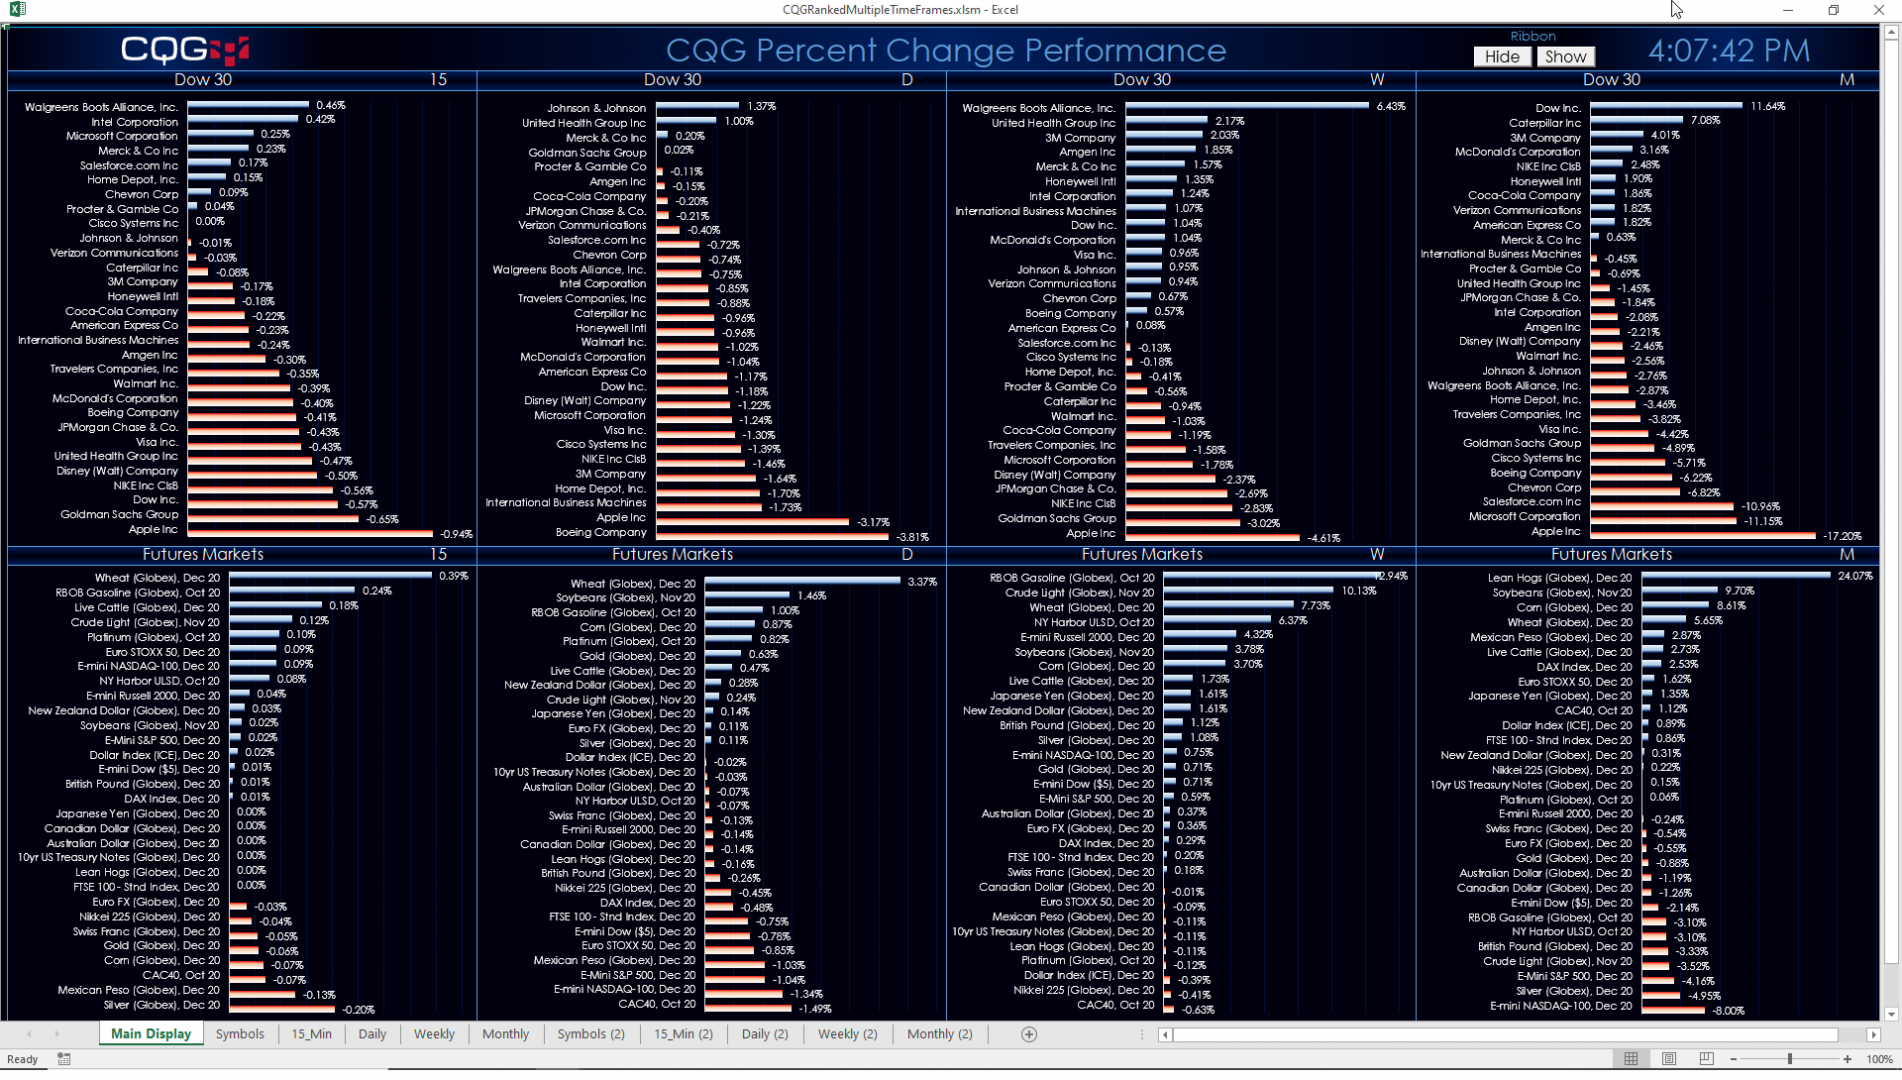
This Microsoft Excel® dashboard uses ranked by percent net change for two sets of 30 symbols. The dashboard is preloaded with the stocks comprising the Dow Jones Industrial Average® and 30 futures… more
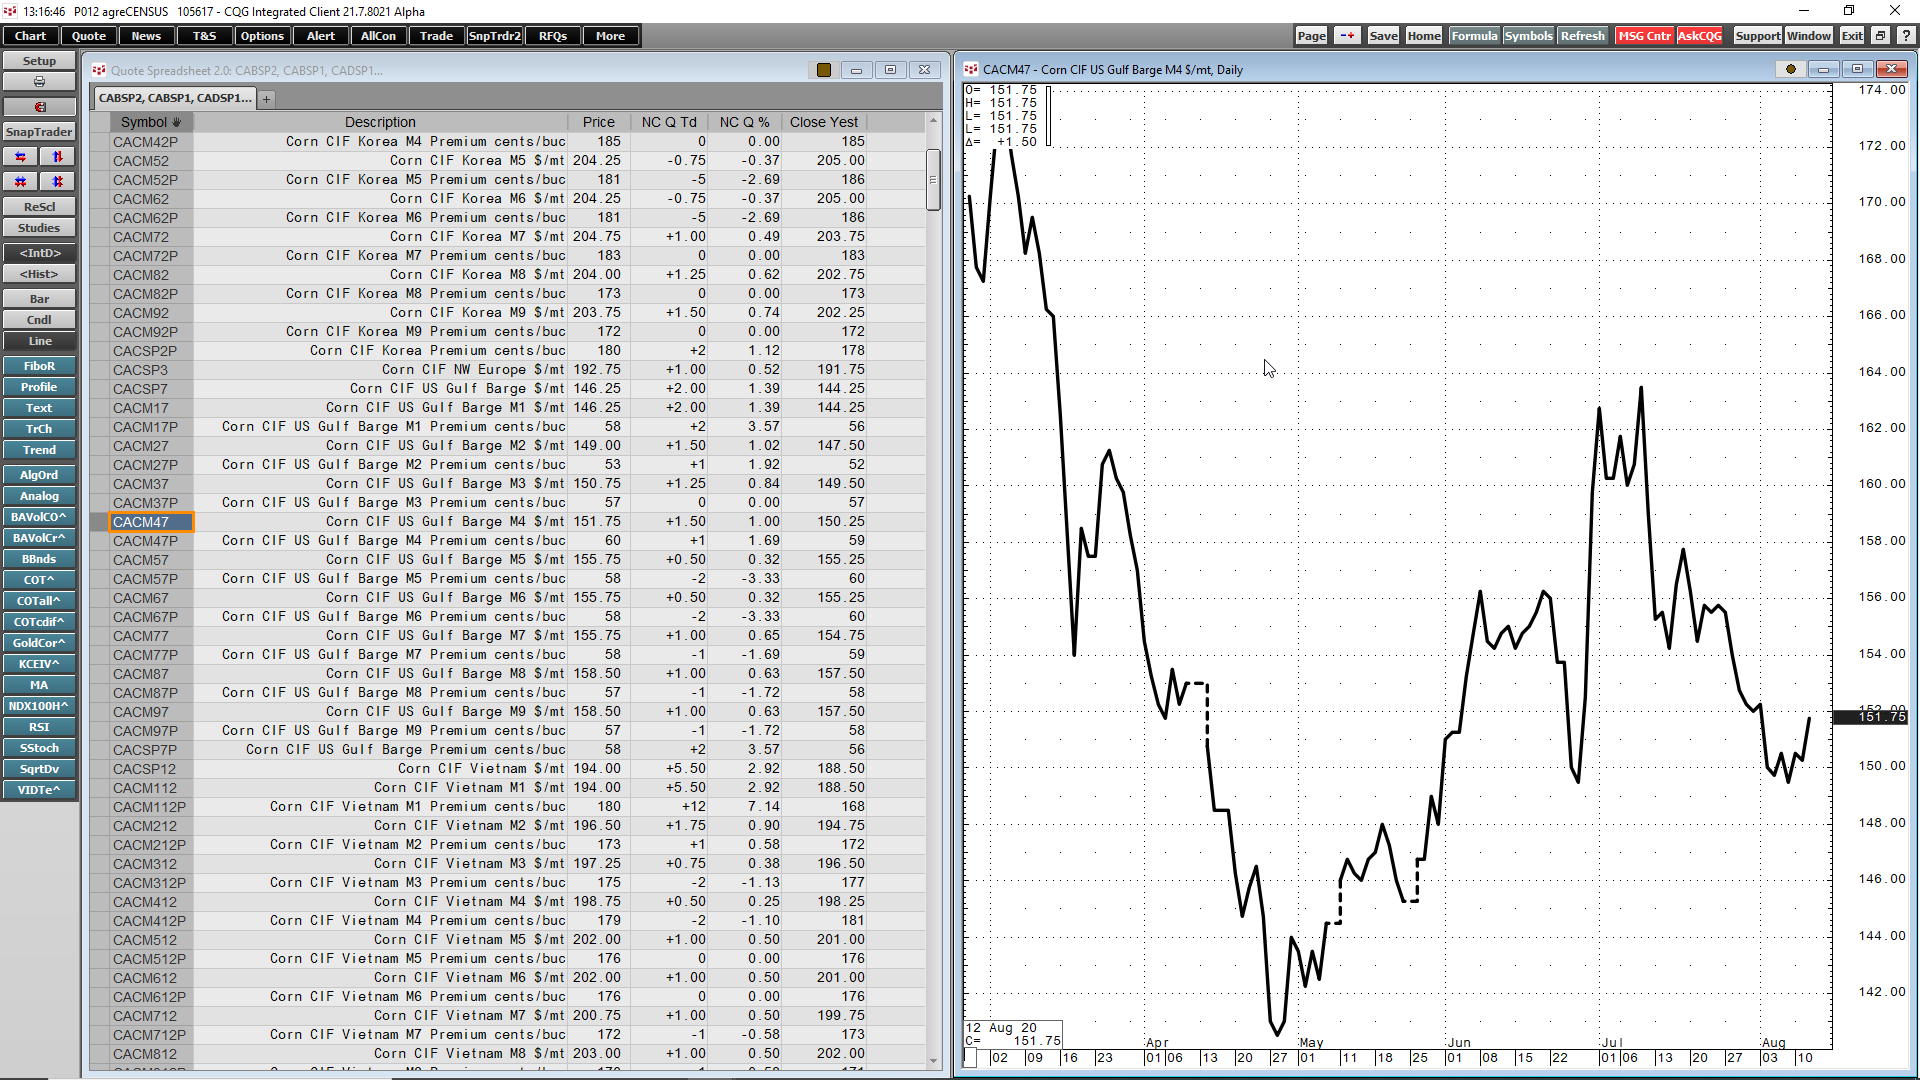
Maintain a global view of the price structure of the agricultural markets through Fastmarkets AgriCENSUS data.
Fastmarkets AgriCENSUS is an independent price reporting agency (PRA) that… more
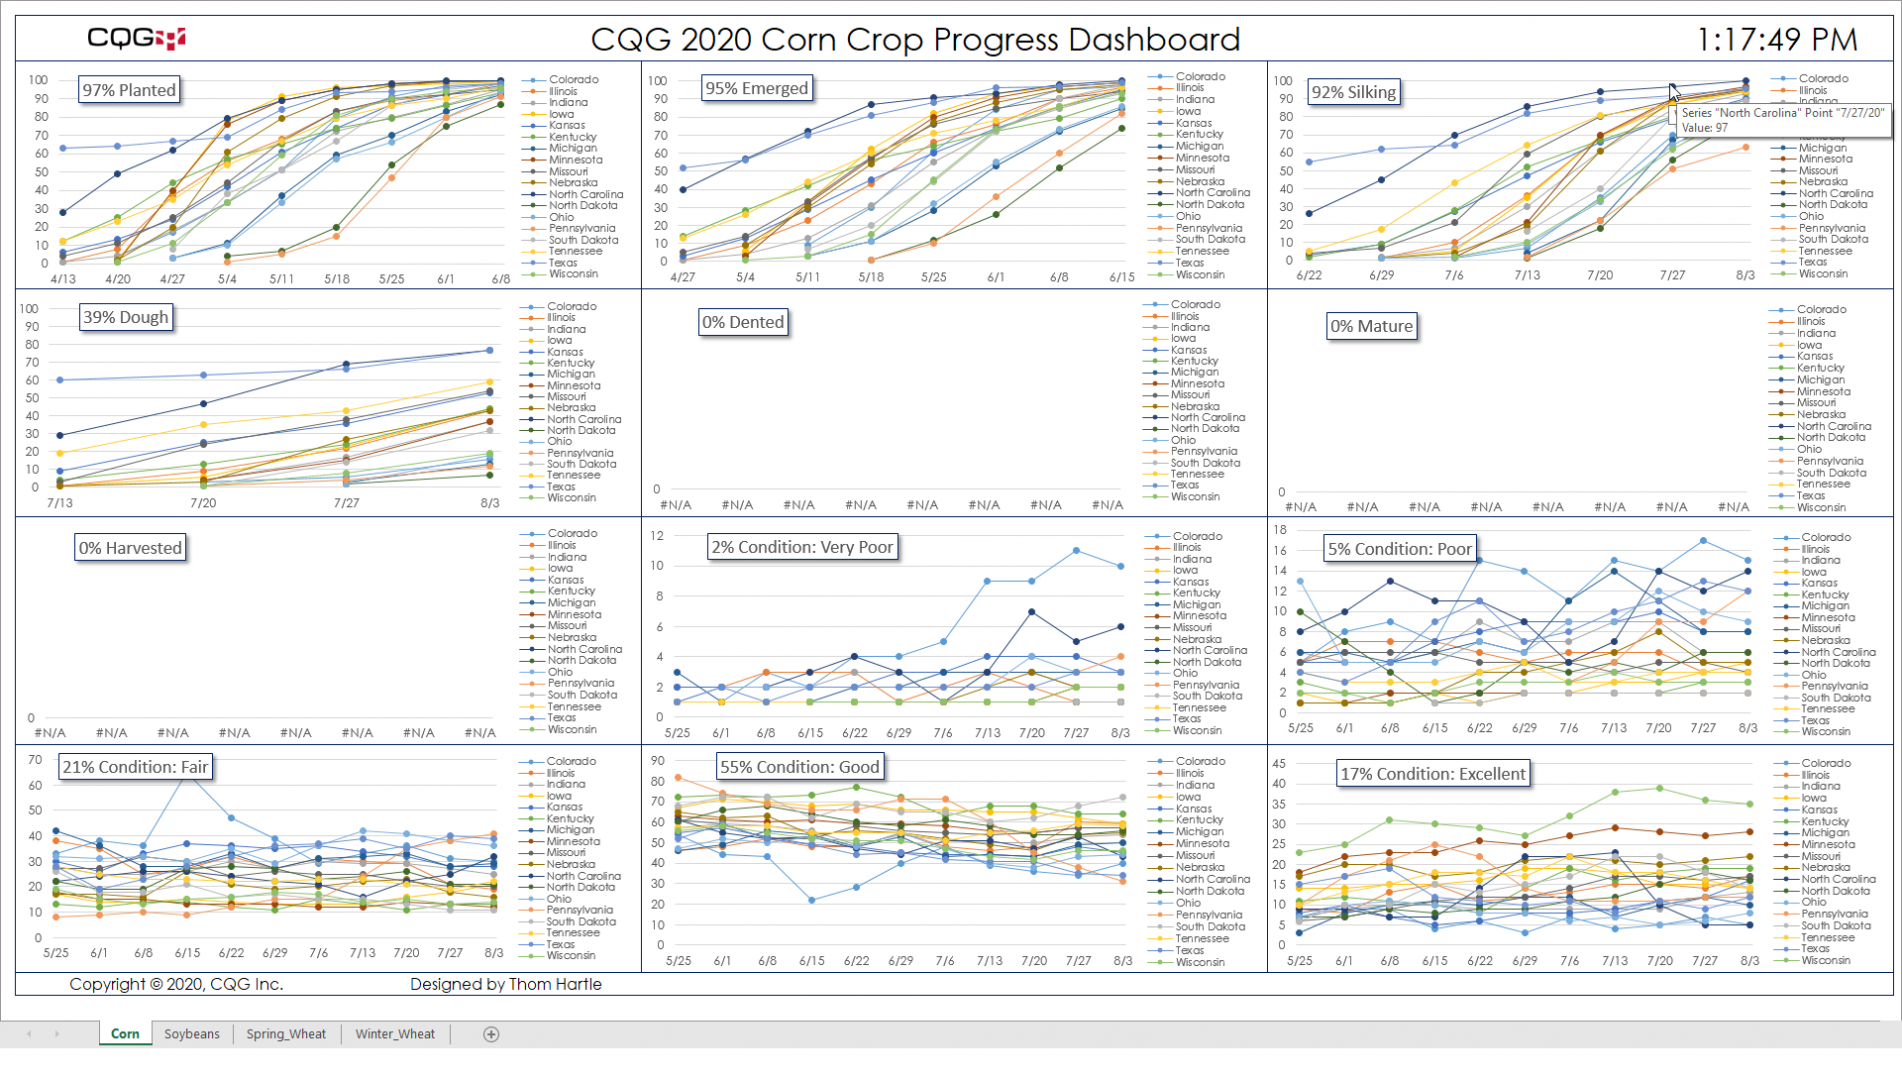
CQG has added the USDA Crop Progress weekly report to the USDA data offering. This weekly report is very important to traders and analysts in the agricultural markets. Published during the growing… more
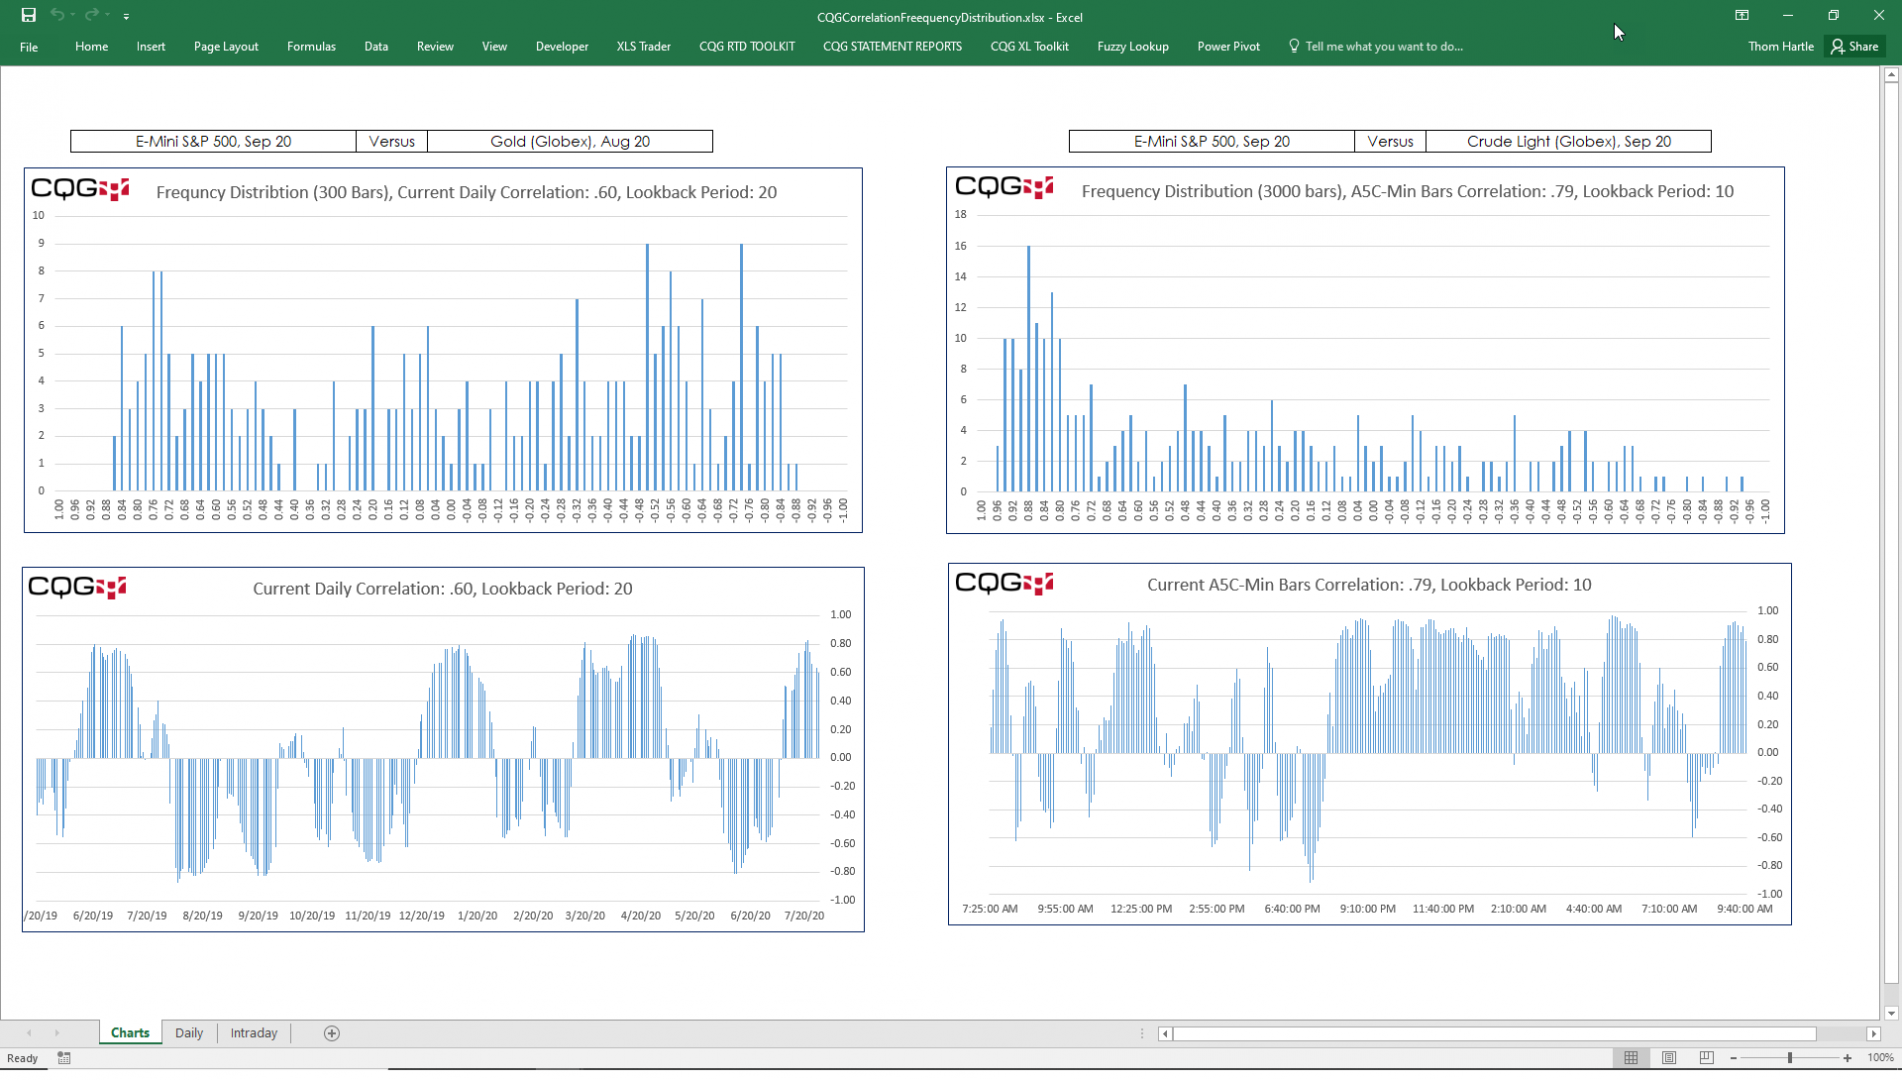
Imagine that today the 20 day correlation between the E-mini S&P 500 futures contract (symbol: EP) and the Crude Oil Contract (symbol: CLE) is 0.82. Now, is that a typical value or an unusual… more
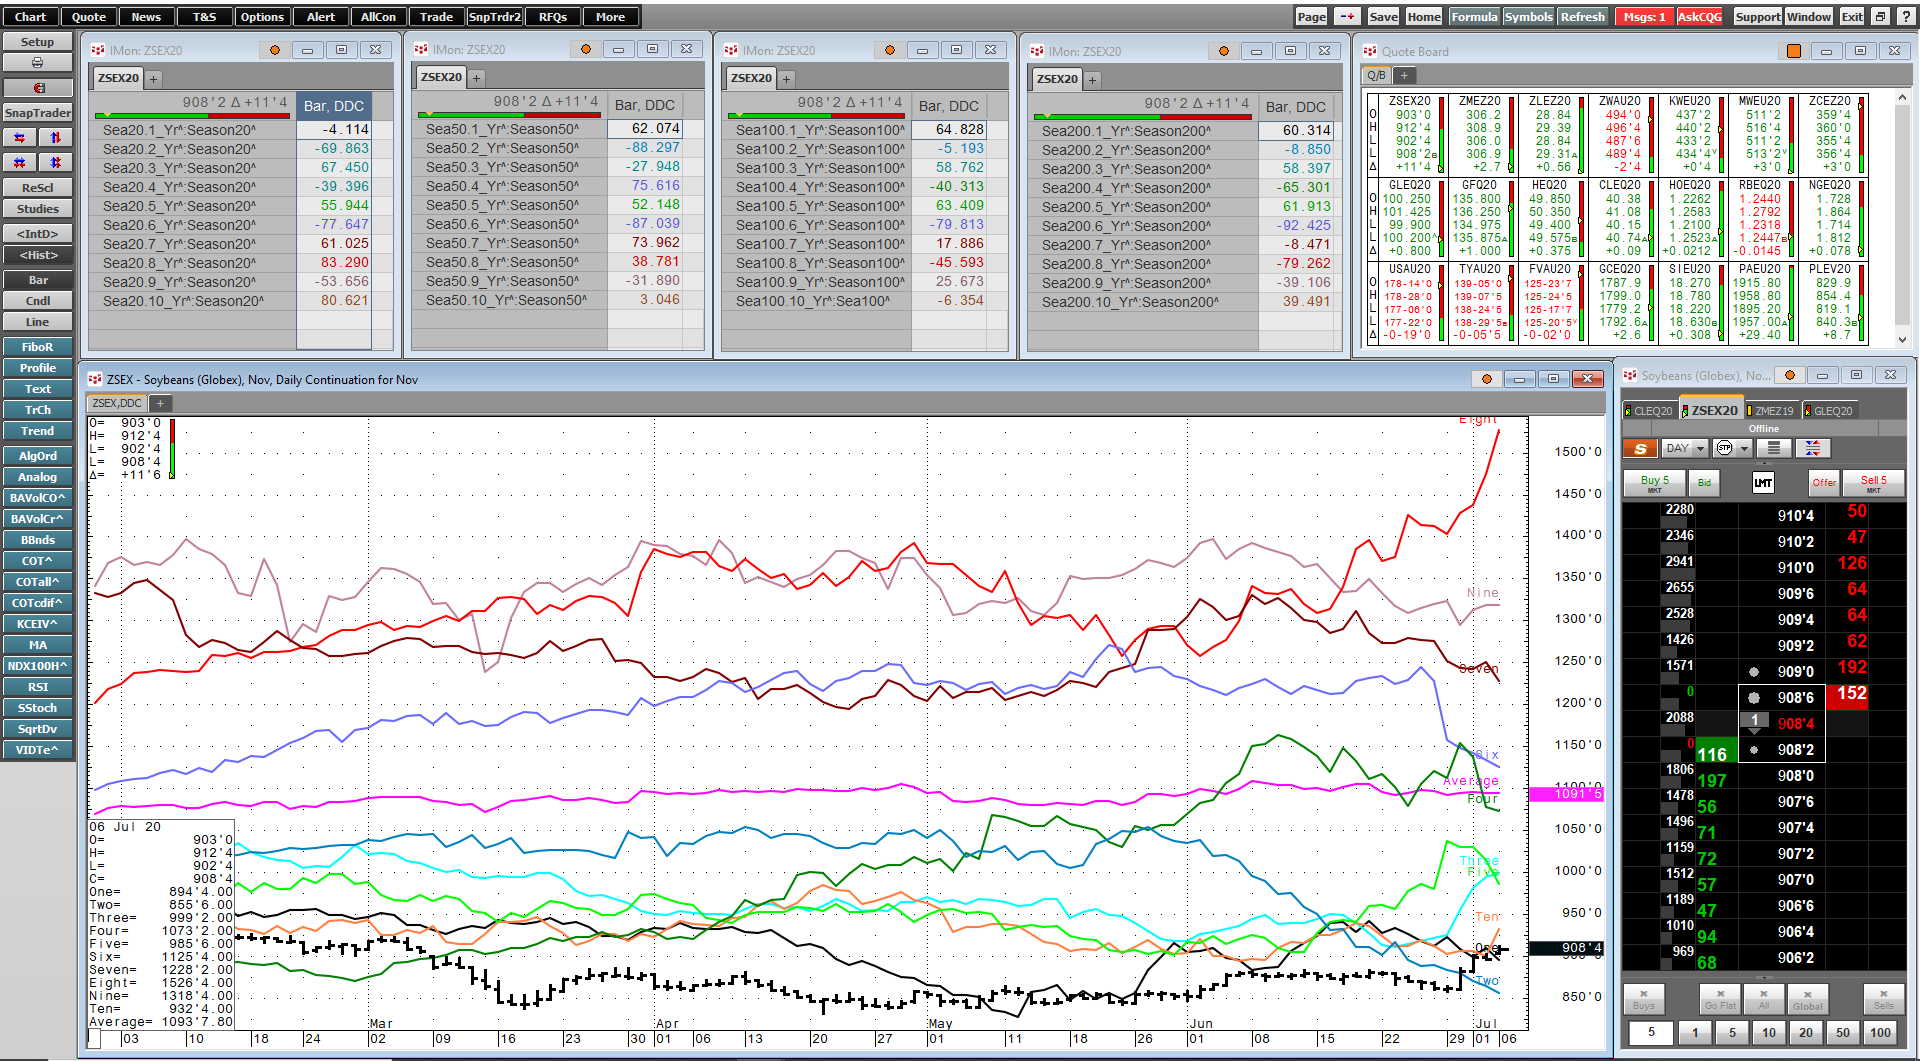
CQG’s Integrated Client and QTrader Version 2020 offers a new study called the Seasonal Study. This study is very popular with analysts and traders in the agricultural markets because of the… more
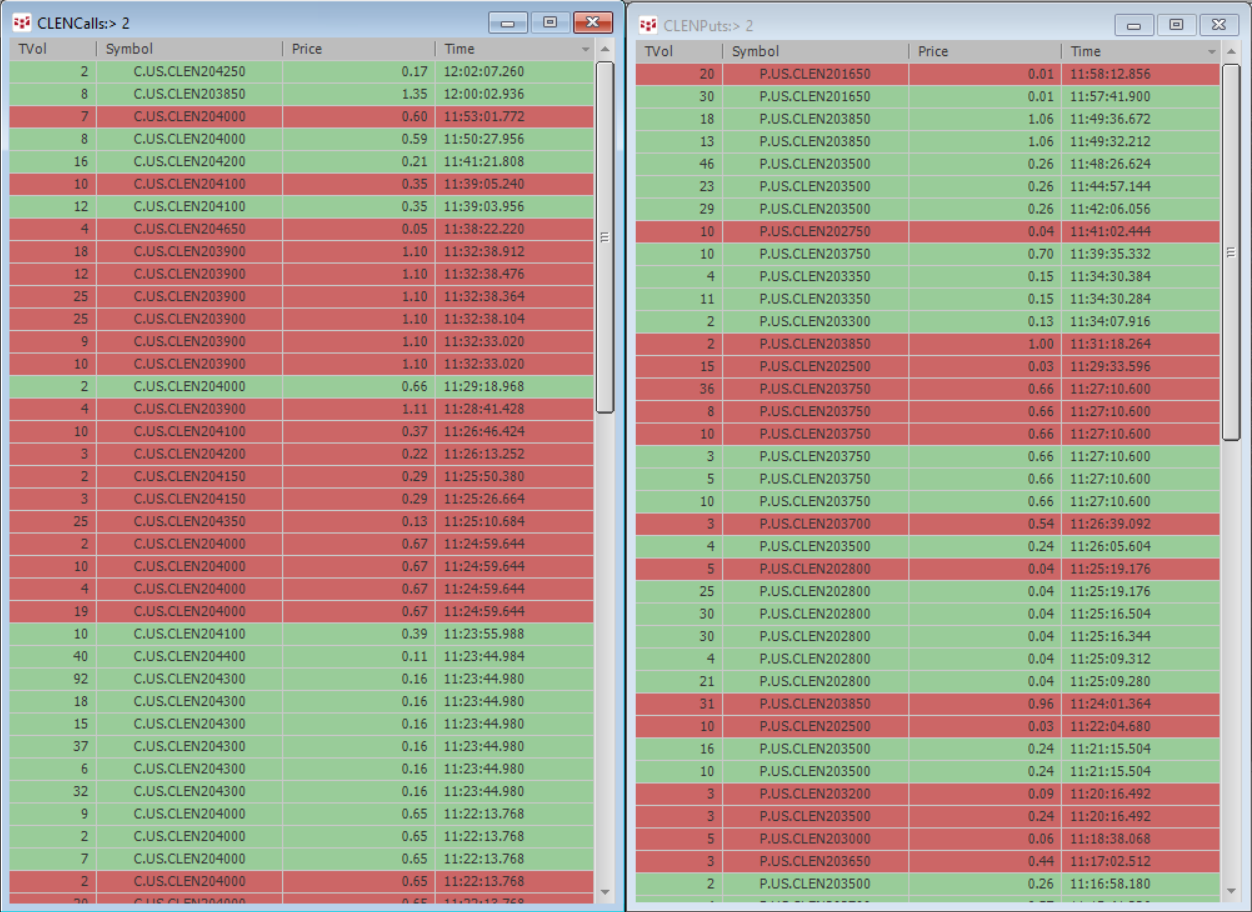
CQG’s Portfolio T&S Monitor displays trades using a time & sales format for a portfolio of instruments. The standard T&S display shows you trading activity for just one instrument.… more