
This Microsoft Excel® dashboard displays market data for Soybean Crush Spreads traded on the CME Globex platform. These spreads have an added layer of complexity due to the soybean contract not… more
Workspaces
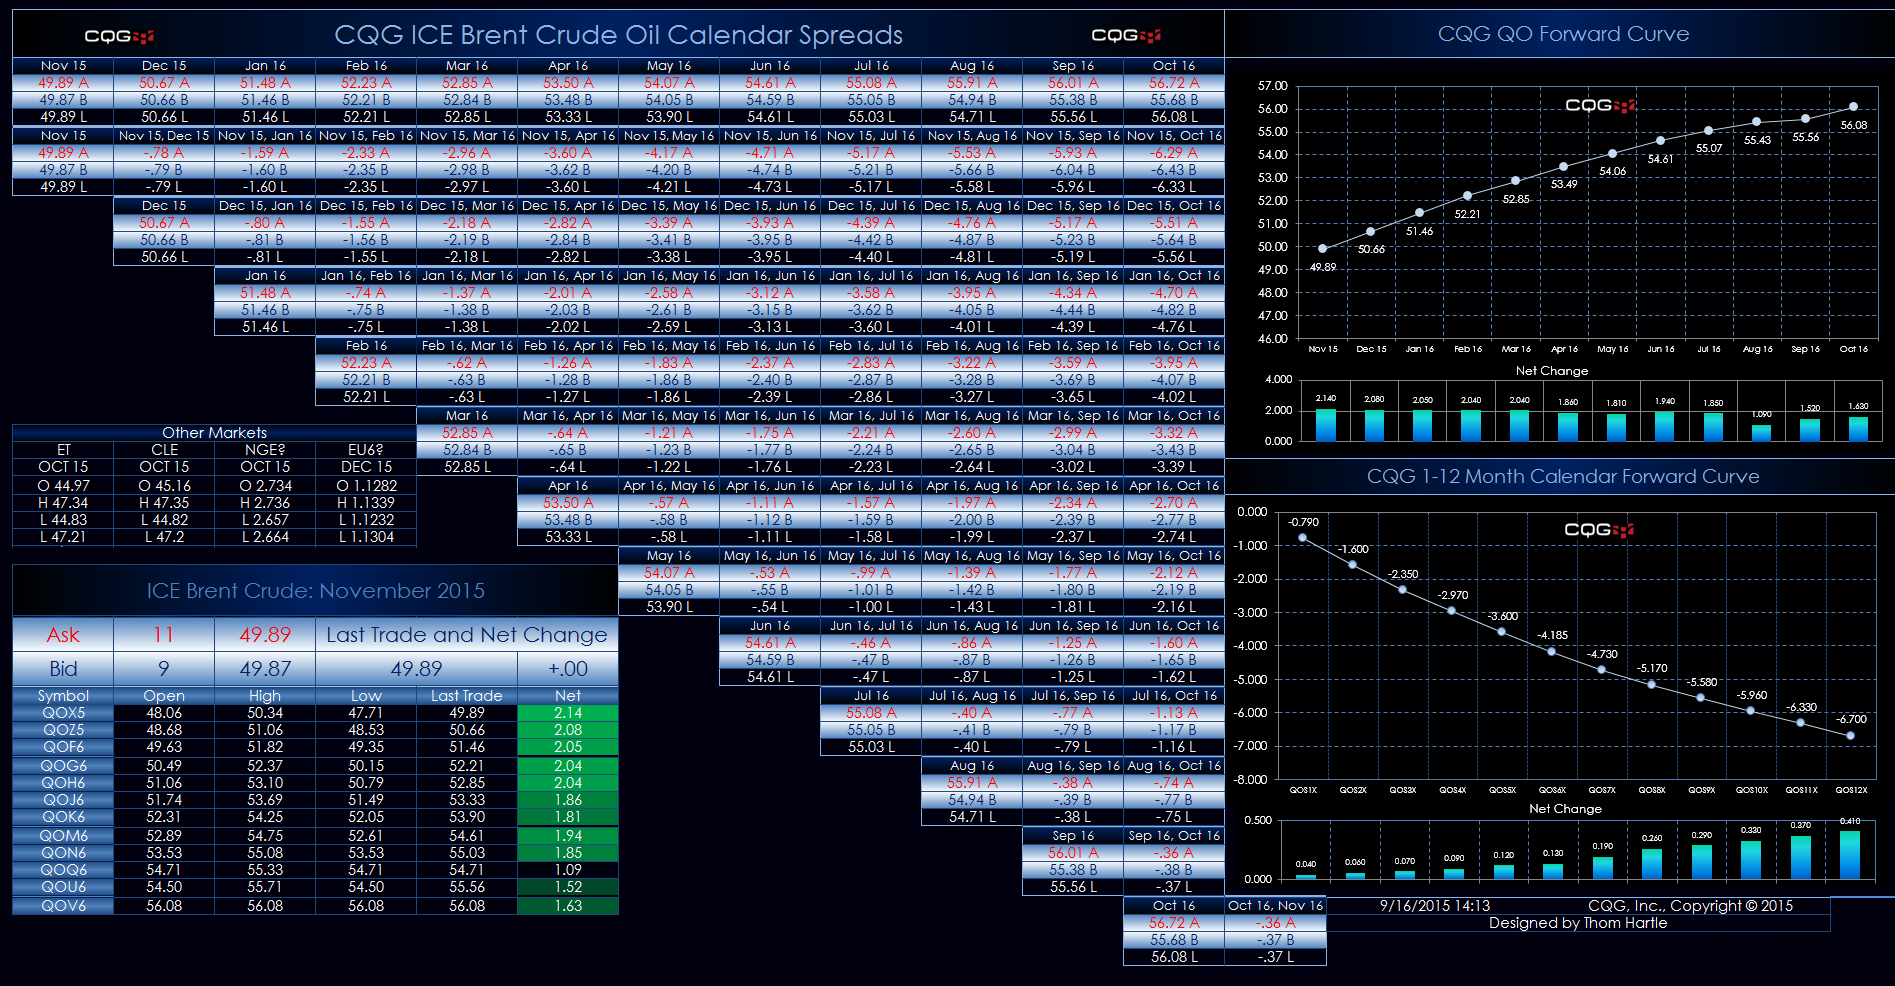
This Microsoft Excel® spreadsheet uses the CQG Toolkit to pull in Brent Crude Oil market data traded on the ICE exchange.
The dashboard uses a matrix-style presentation with the outrights… more
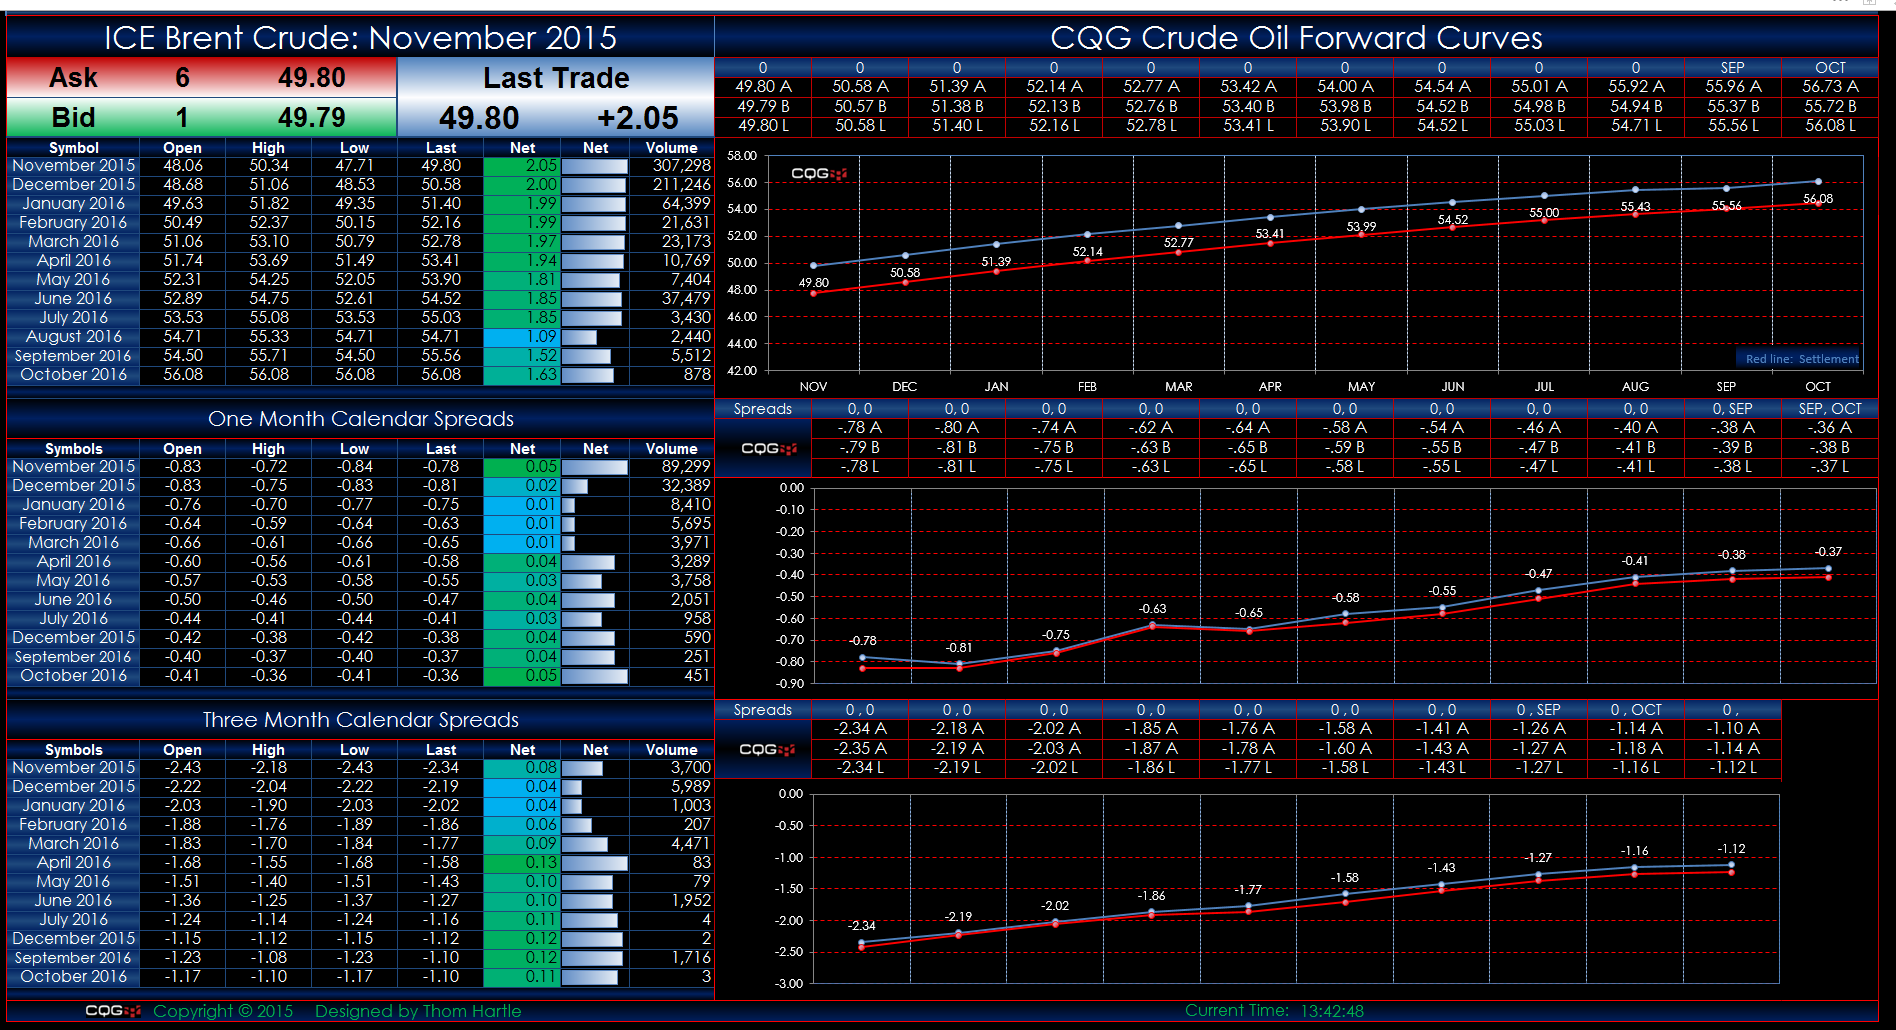
This Microsoft Excel® spreadsheet uses the CQG Toolkit to pull in Brent Crude Oil market data traded on the ICE exchange.
The forward curves display today's data. If the last price is… more
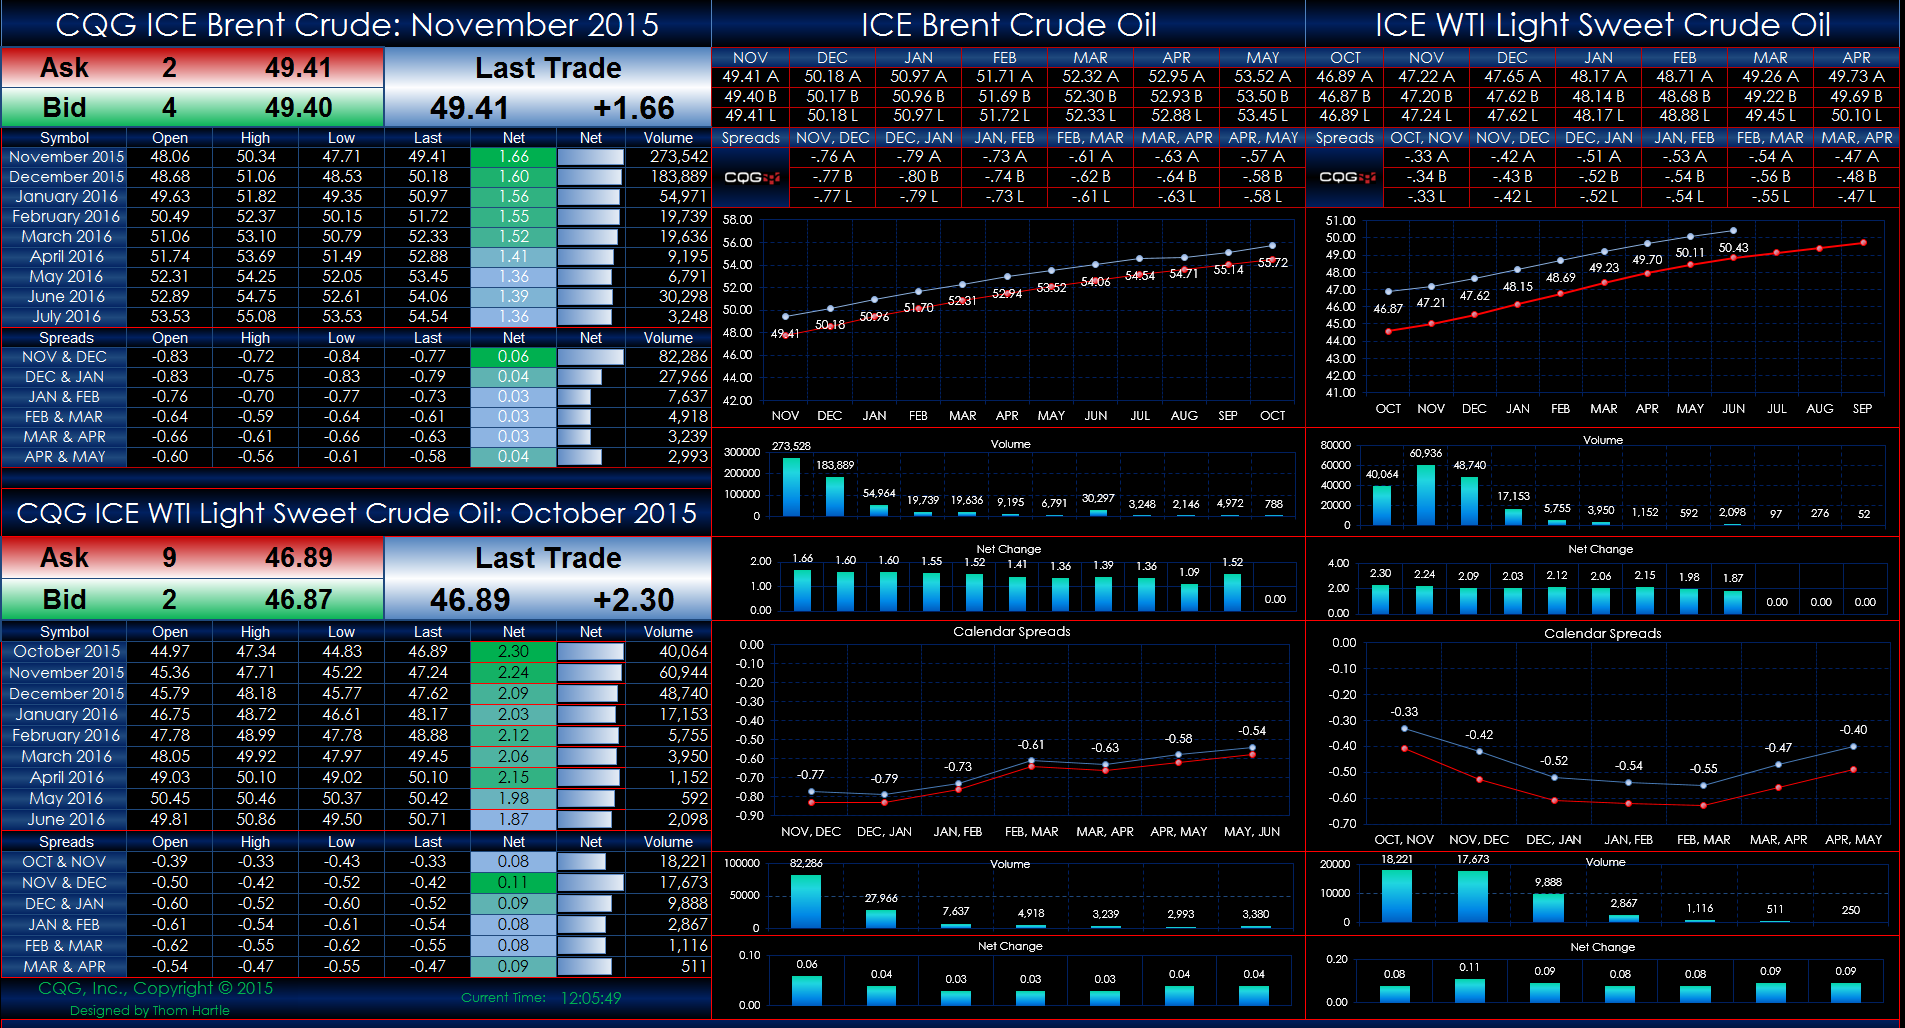
This Microsoft Excel® spreadsheet uses the CQG Toolkit to pull in Brent Crude Oil and WTI Light Sweet Crude Oil market data traded on the ICE exchange.
The forward curves display today's… more
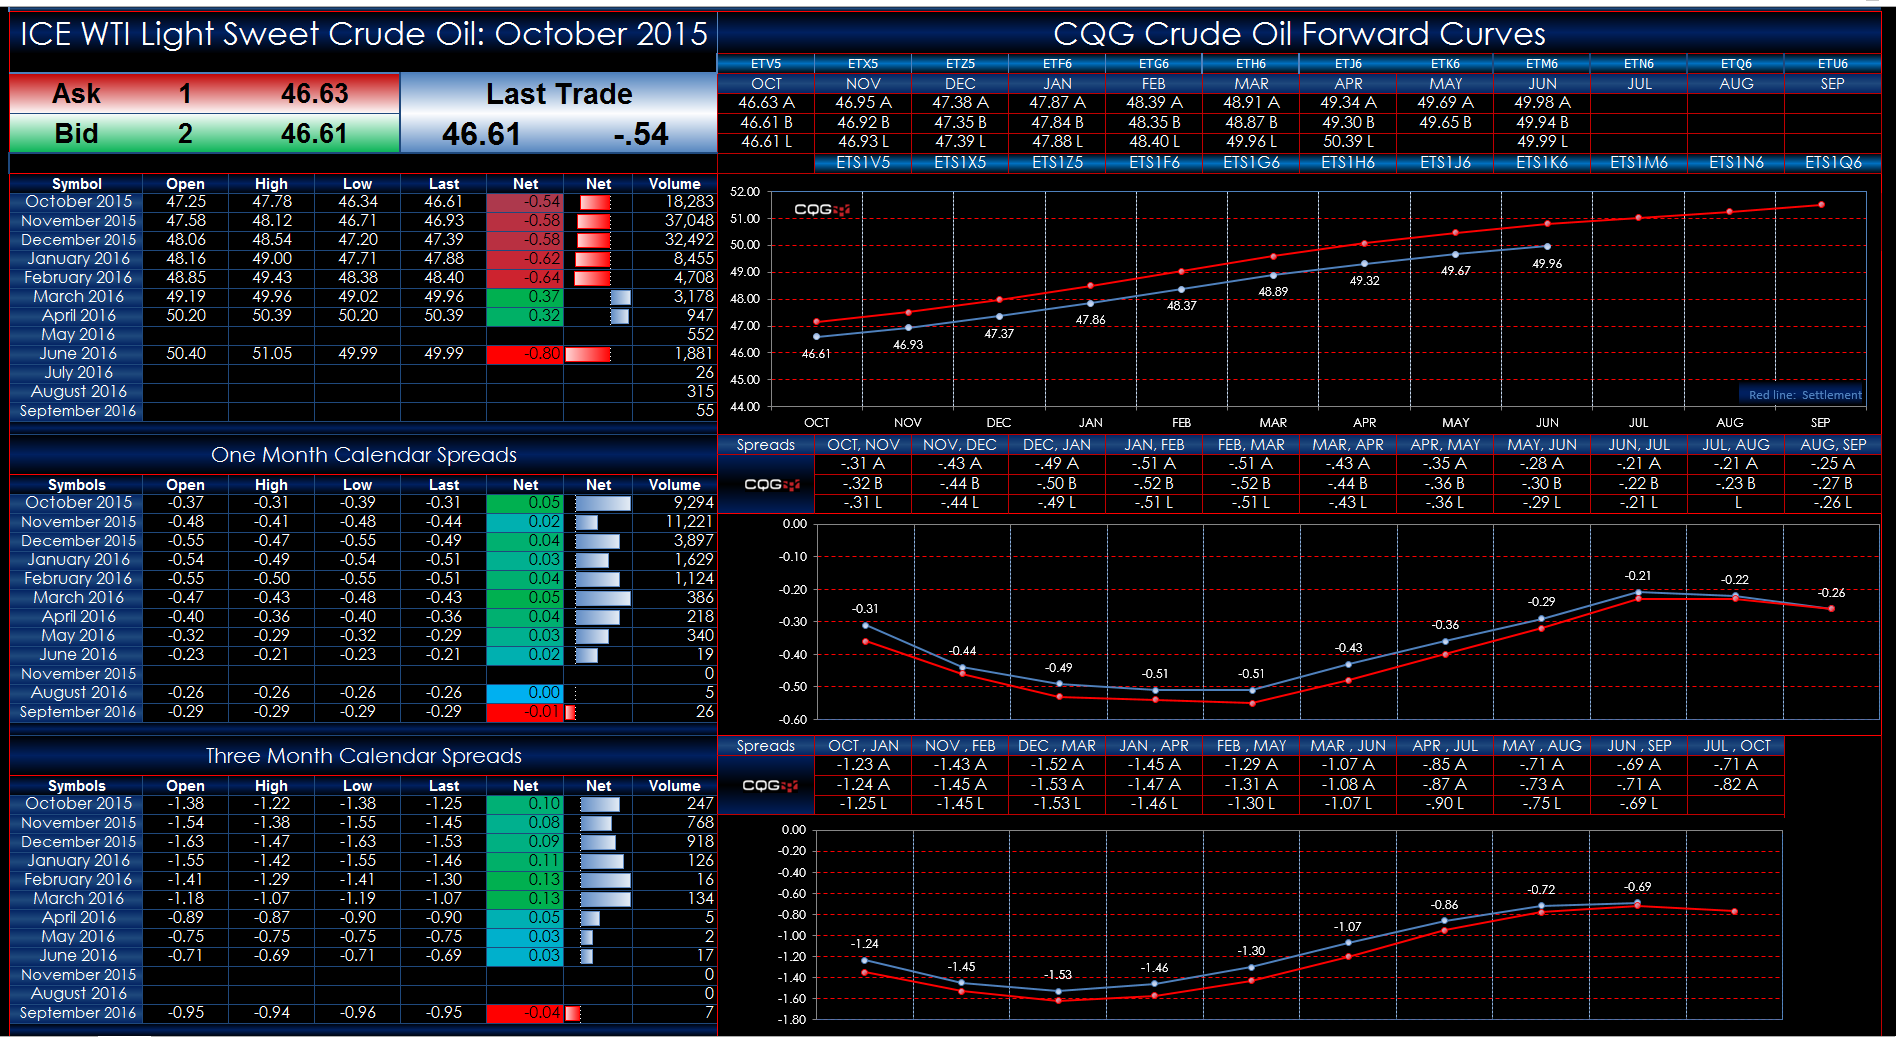
This Microsoft Excel® spreadsheet uses the CQG Toolkit to pull in WTI Light Sweet Crude Oil market data traded on the ICE exchange.
The dashboard uses a matrix-style presentation with the… more
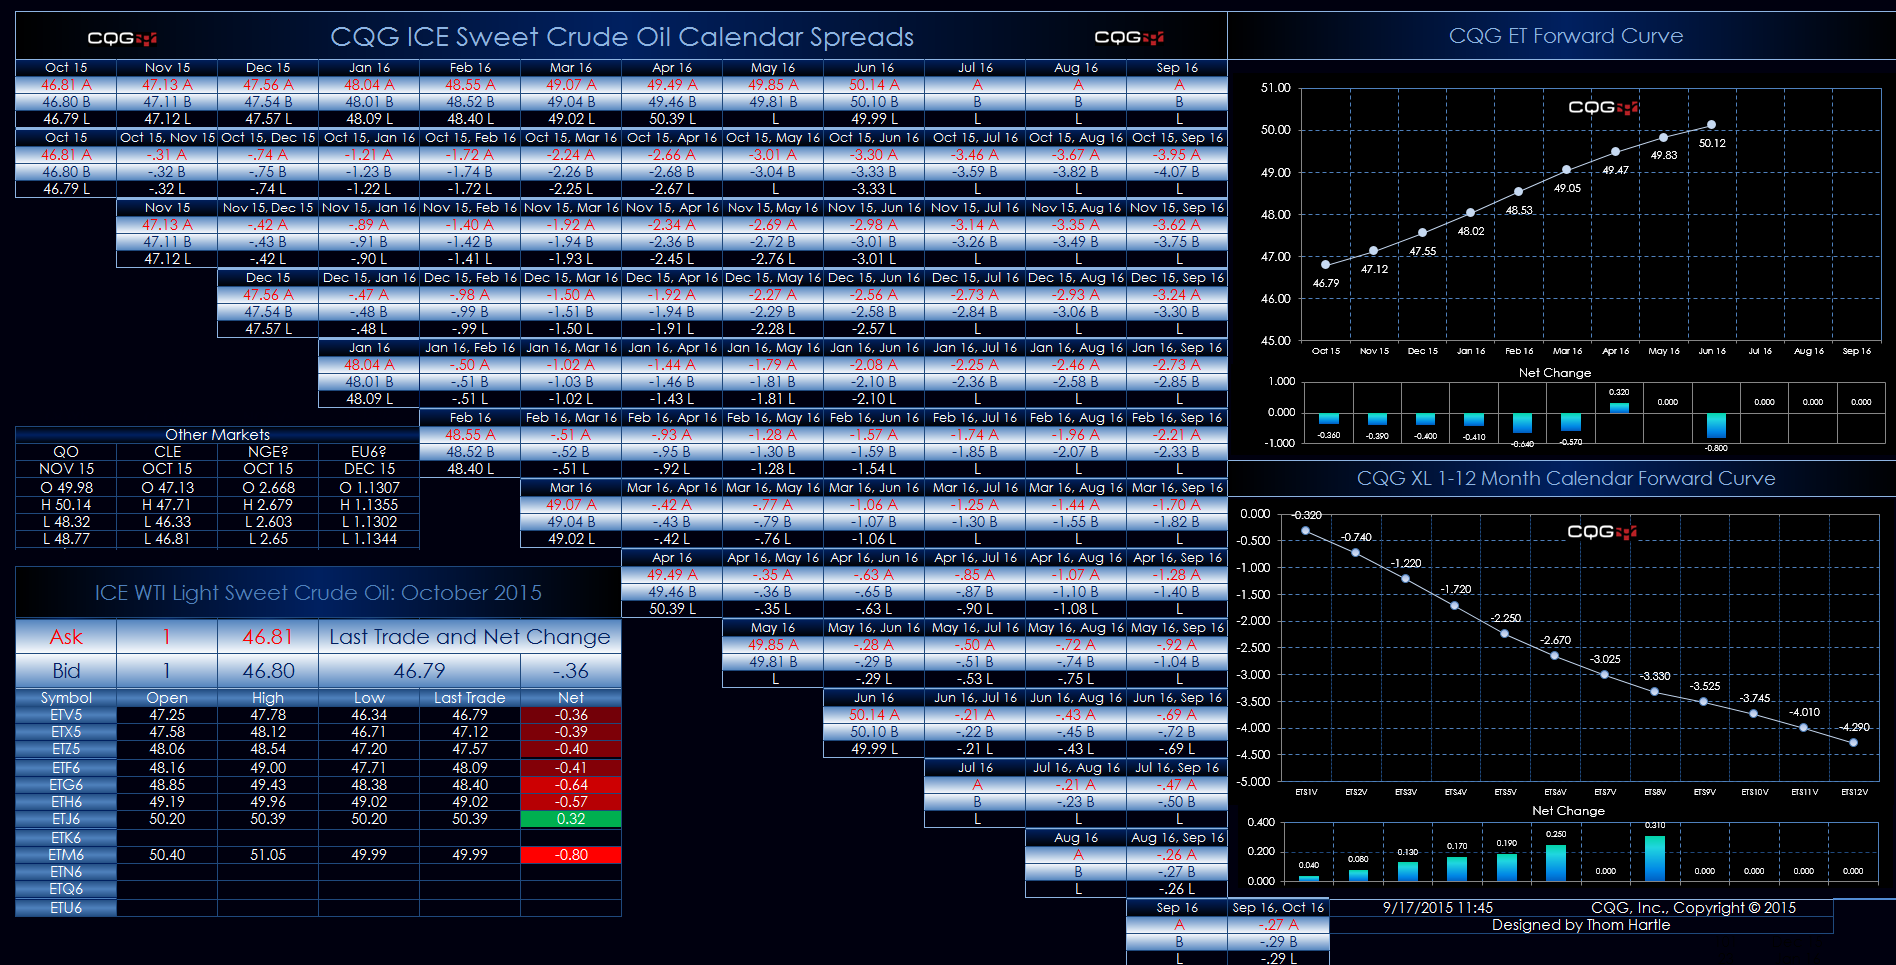
This Microsoft Excel® spreadsheet uses the CQG Toolkit to pull in WTI Light Sweet Crude Oil market data traded on the ICE exchange.
The dashboard uses a matrix-style presentation with the… more

This Microsoft Excel® spreadsheet uses the CQG Toolkit to pull in market data for RBOB gasoline traded on CME Globex.
The dashboard uses a matrix-style presentation with the outrights… more
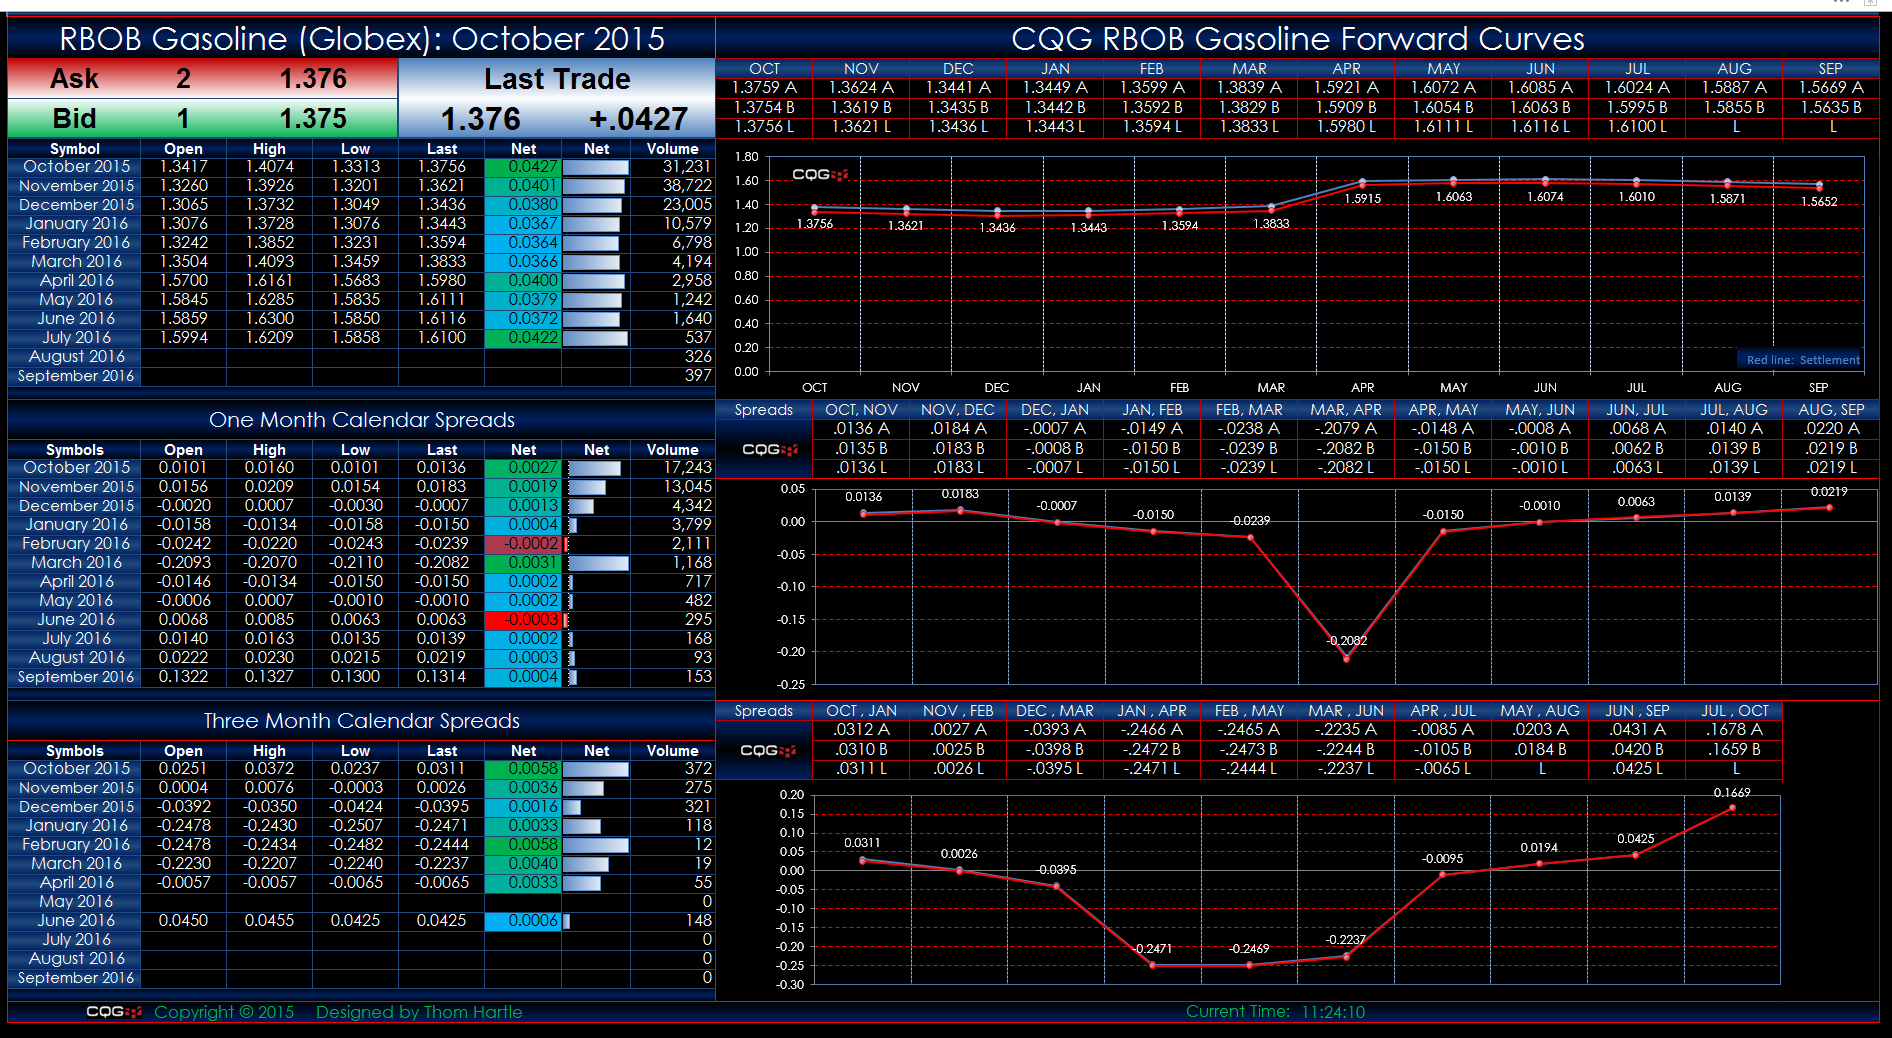
This Microsoft Excel® spreadsheet uses the CQG Toolkit to pull in market data for RBOB gasoline traded on CME Globex.
Twelve months of outrights, one-month, and three-month calendar spreads… more
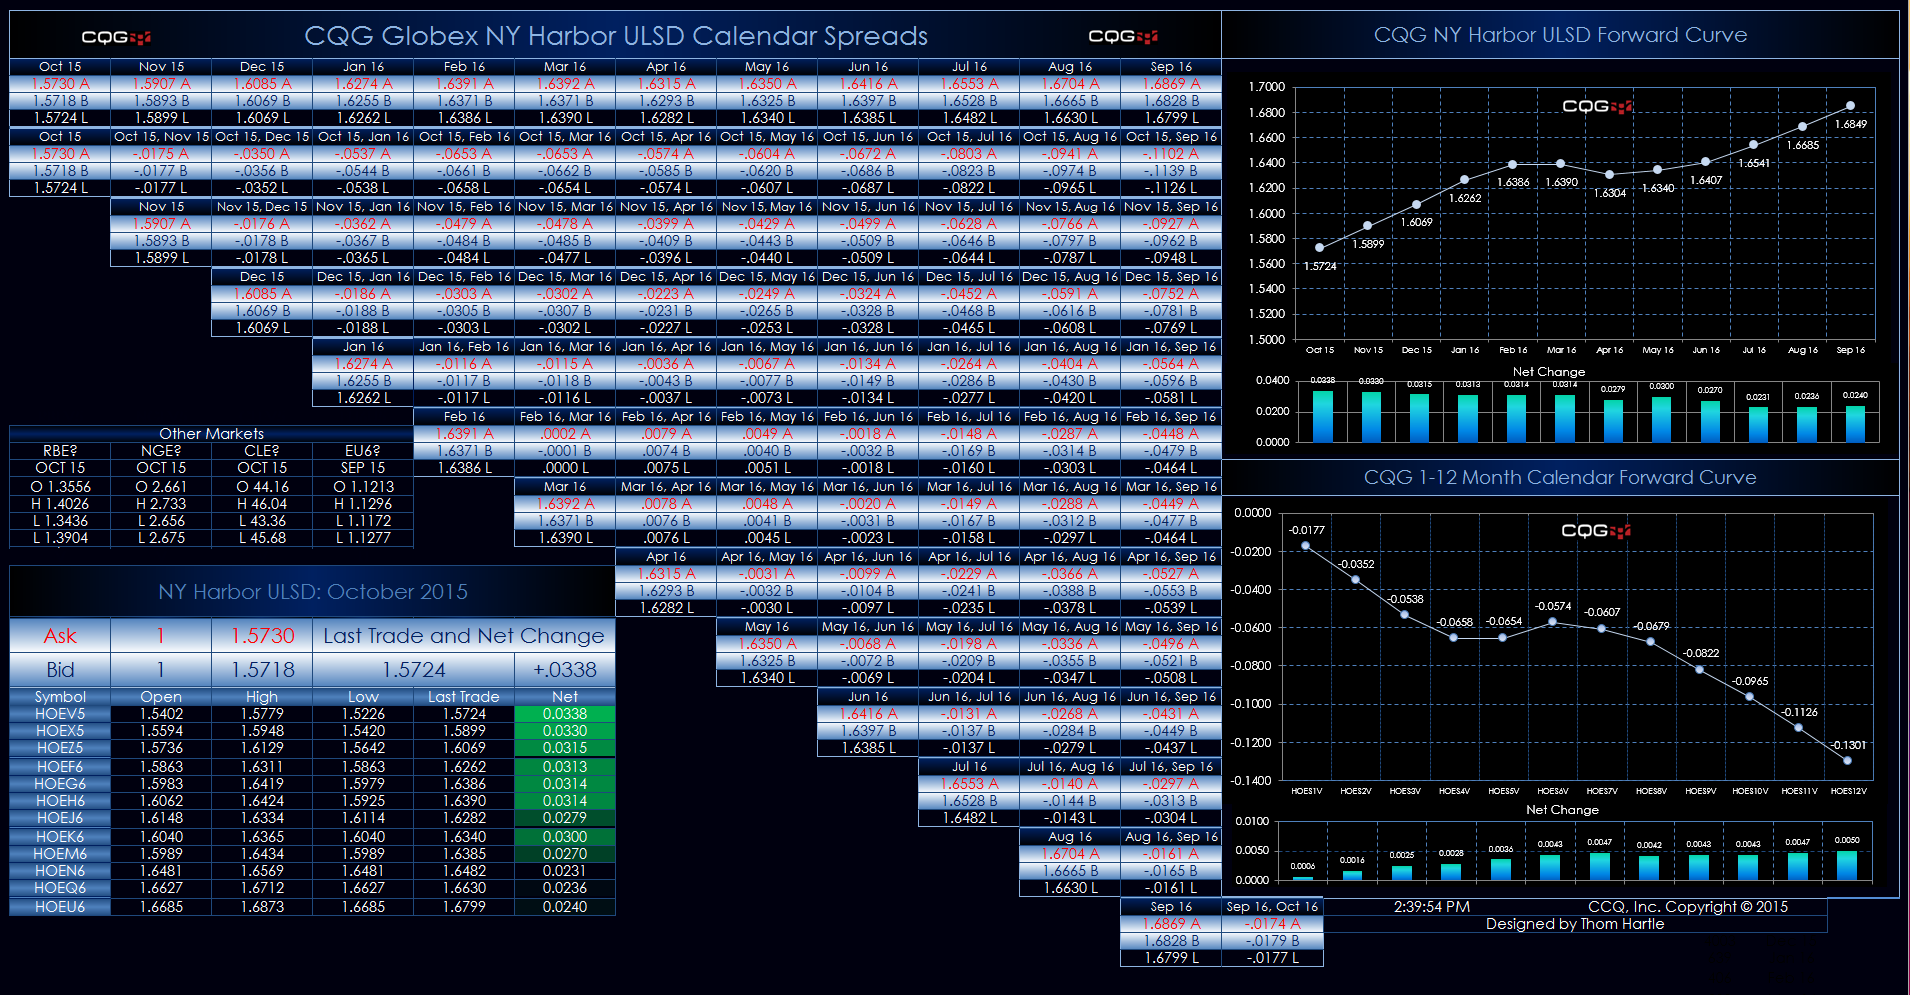
This Microsoft Excel® spreadsheet uses the CQG Toolkit to pull in market data for heating oil traded on CME Globex.
The dashboard uses a matrix-style presentation with the outrights… more
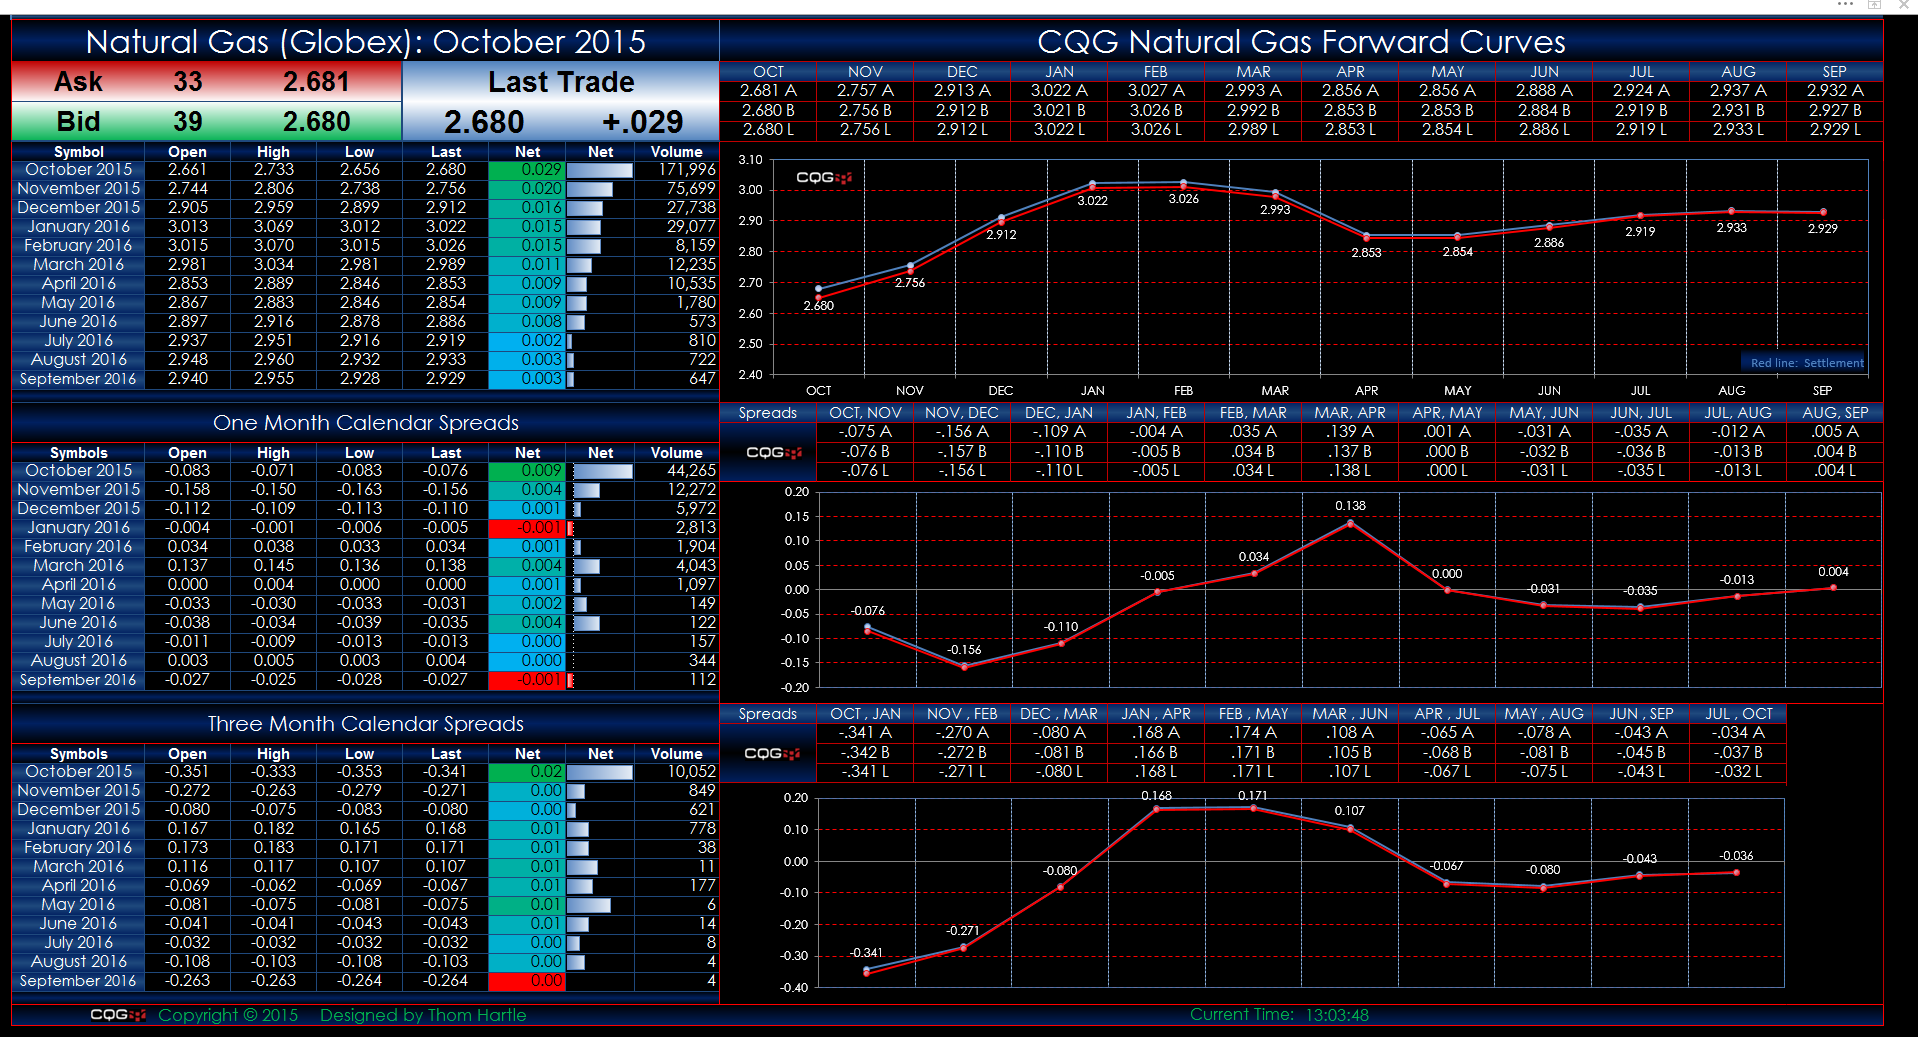
This Microsoft Excel® spreadsheet uses the CQG Toolkit to pull in market data for natural gas traded on CME Globex.
Twelve months of outrights, one-month, and three-month calendar spreads… more