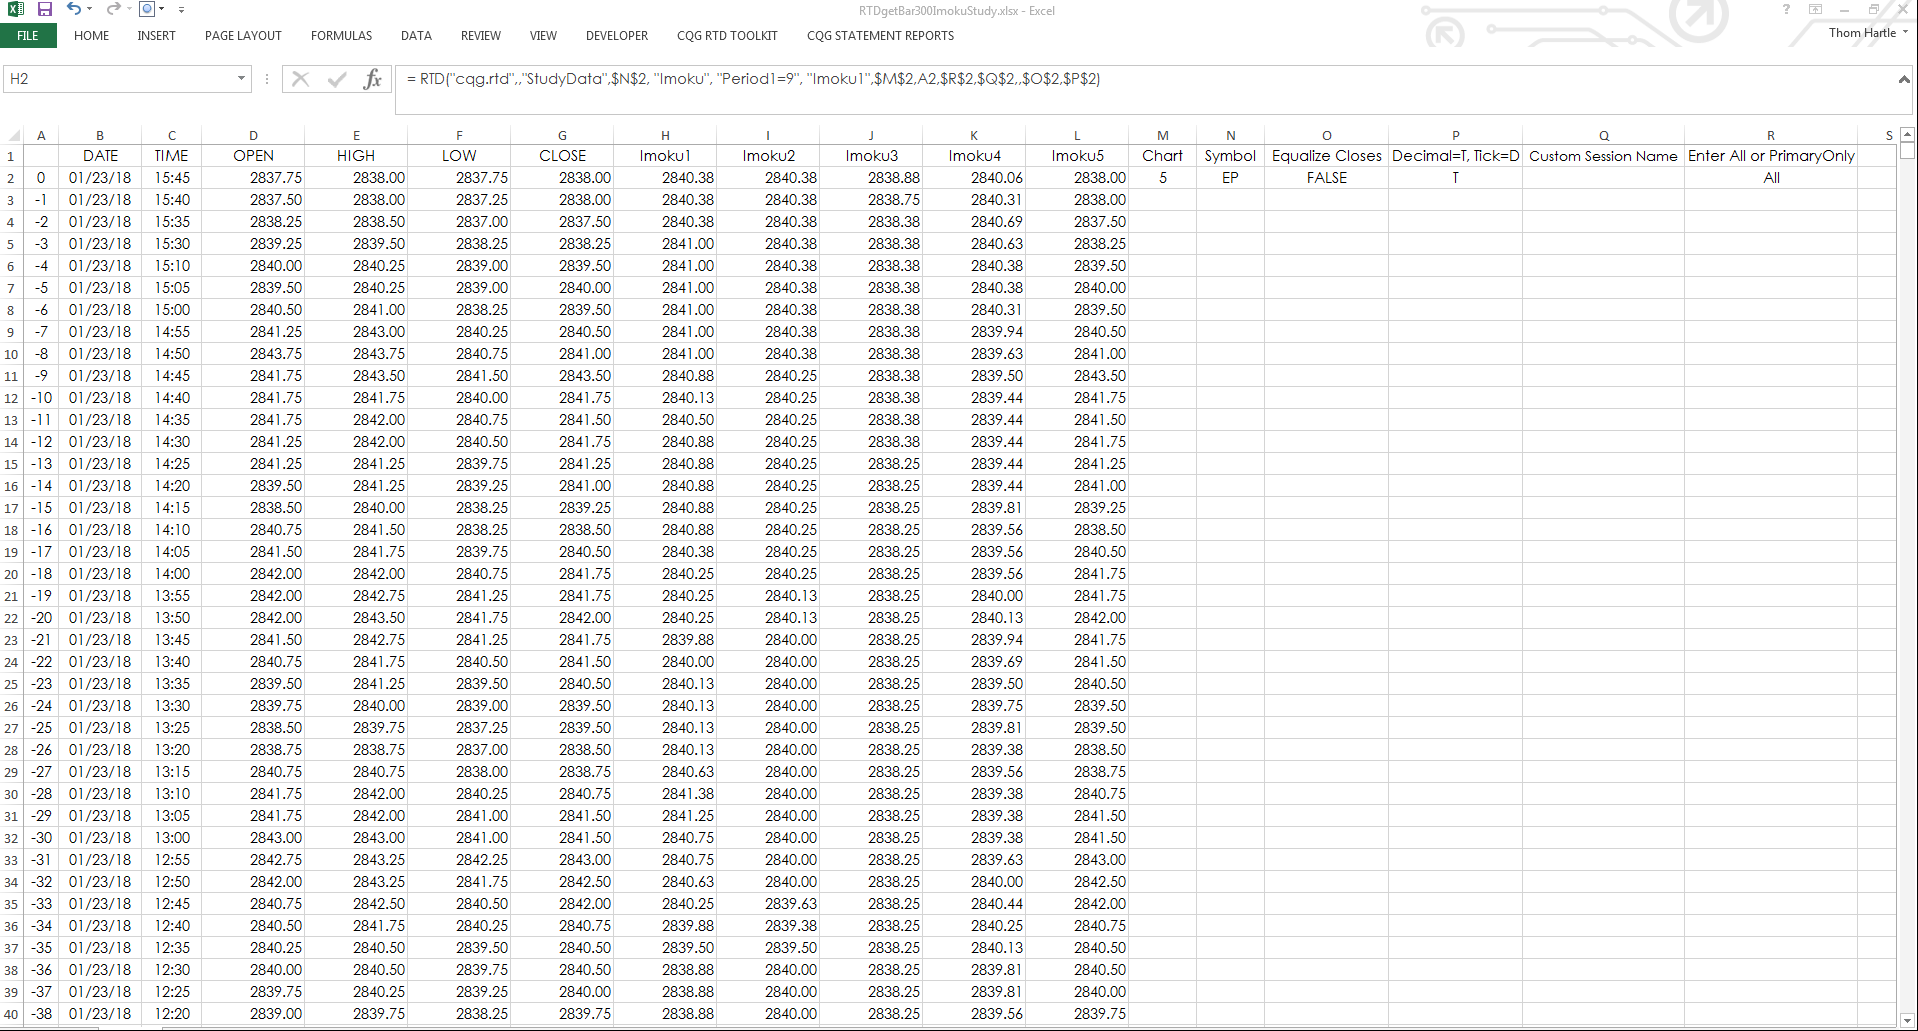
This Microsoft Excel® spreadsheet pulls in five Imoku studies along with open, high, low, and close bar values. You can change the symbol and the time frame. You can retrieve up to 300 daily… more
Workspaces
Customers using our flagship product, CQG Integrated Client (CQG IC), have access to a new study called Algo Orders. Using a proprietary algorithm, this indicator of trading activity detects and… more
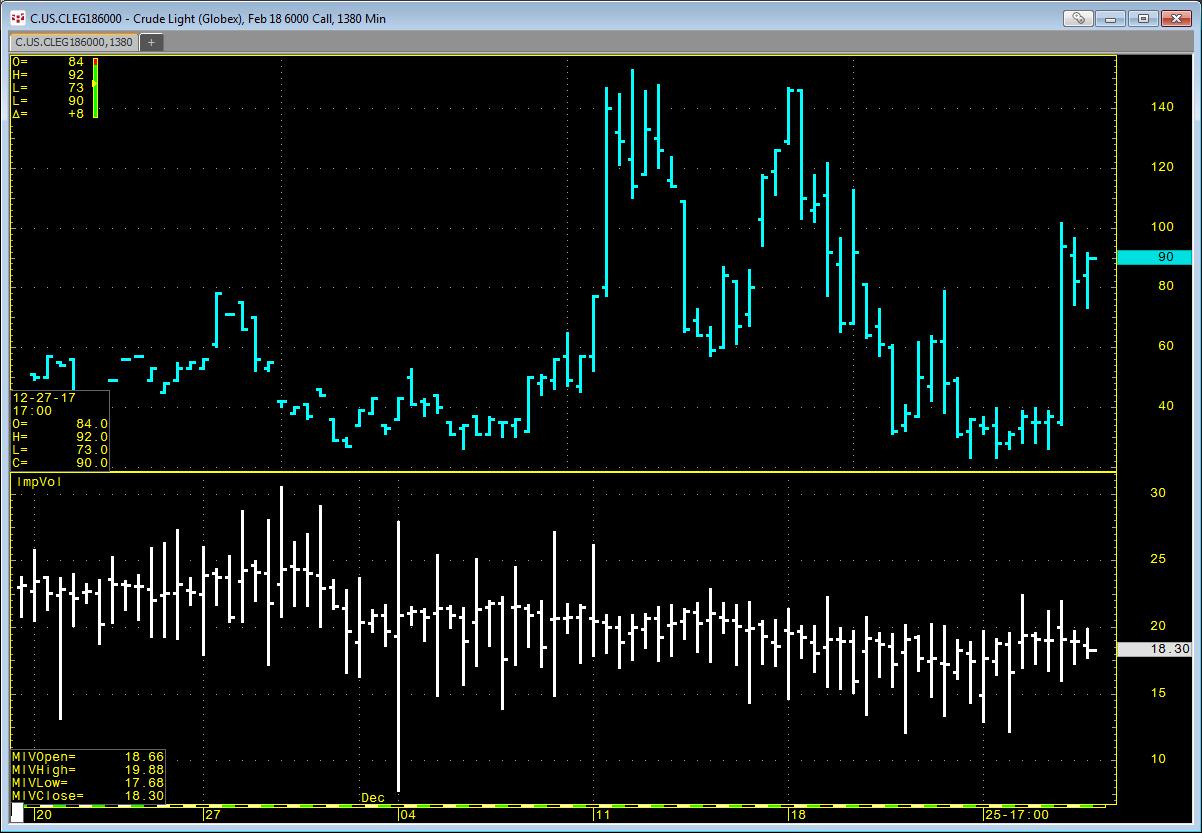
CQG offers an Implied Volatility (ImpVol) study that allows you to pull in historical implied volatility data onto a chart. ImpVol is not the implied volatility of one particular option.… more
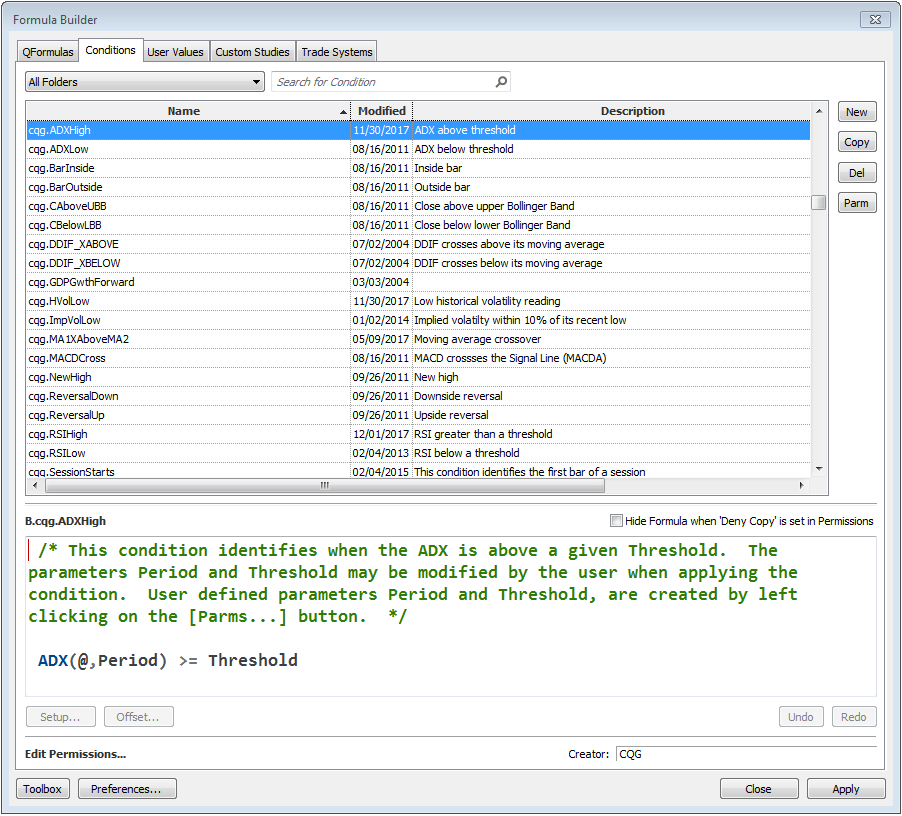
CQG offers a collection of conditions you can use to mark points on a chart when the condition is met. In addition, you can create your own custom conditions. You can easily bring conditions… more
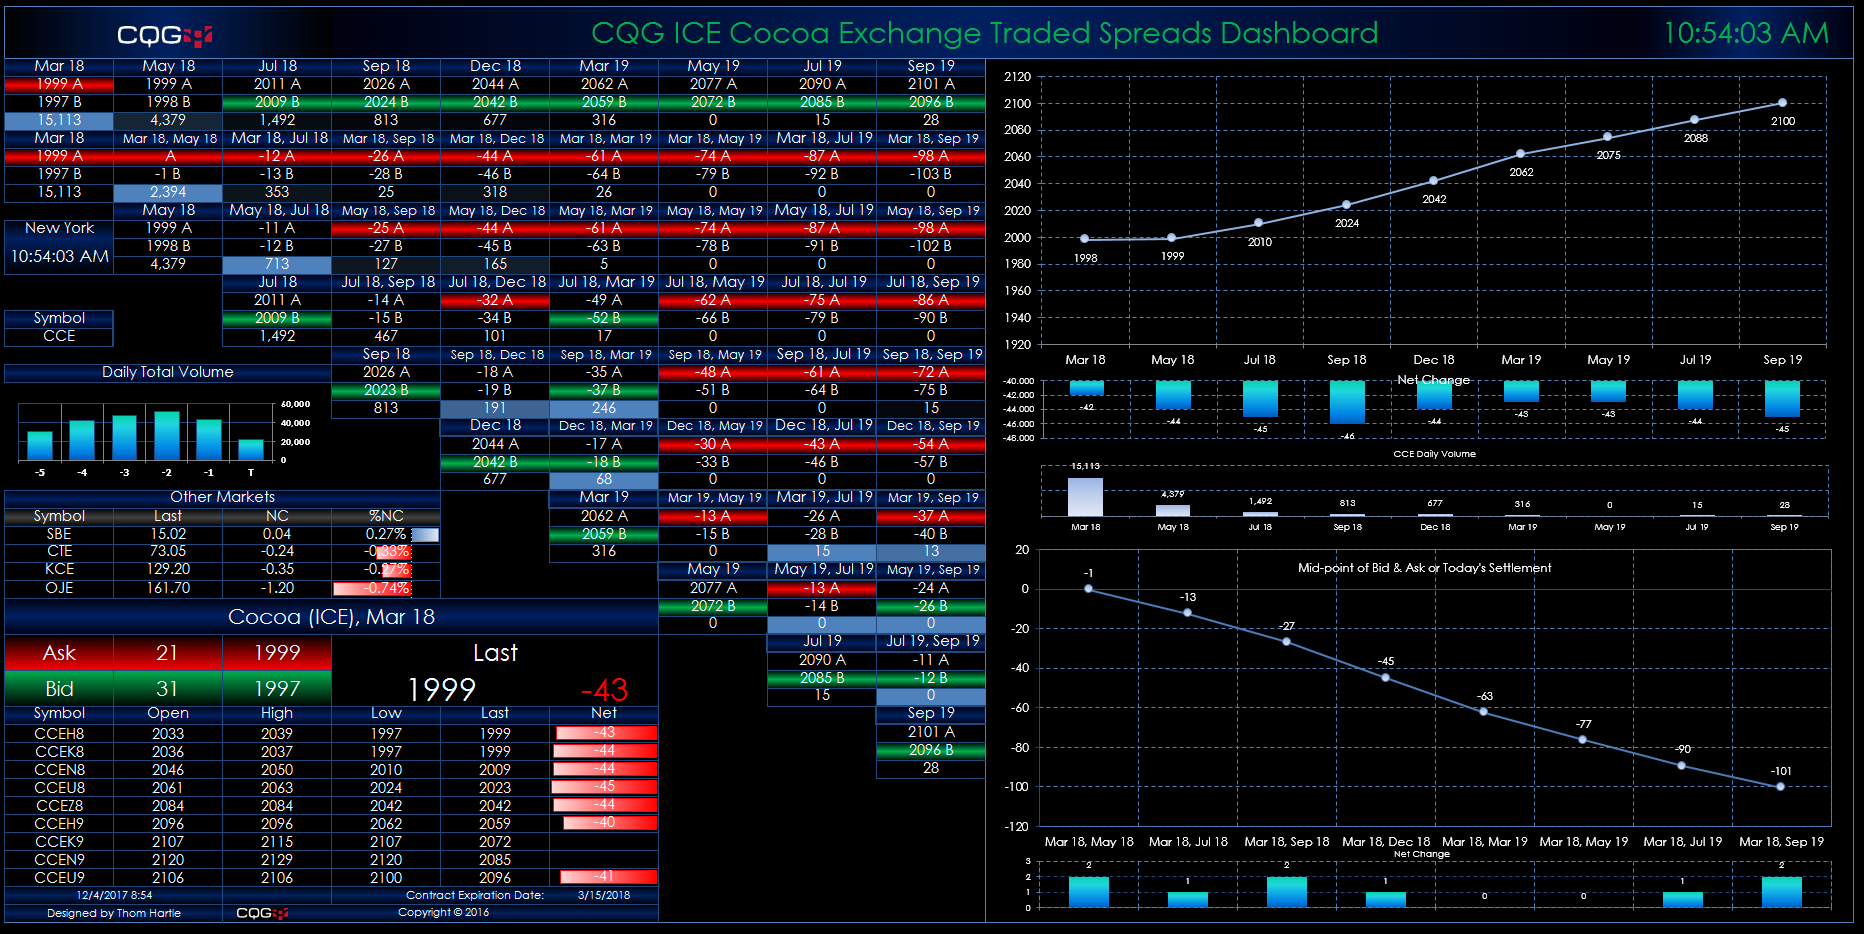
This Microsoft Excel® dashboard displays market data for cocoa spreads traded on the ICE platform using a matrix-style format. The outrights are along the top row and at the start of each row. The… more
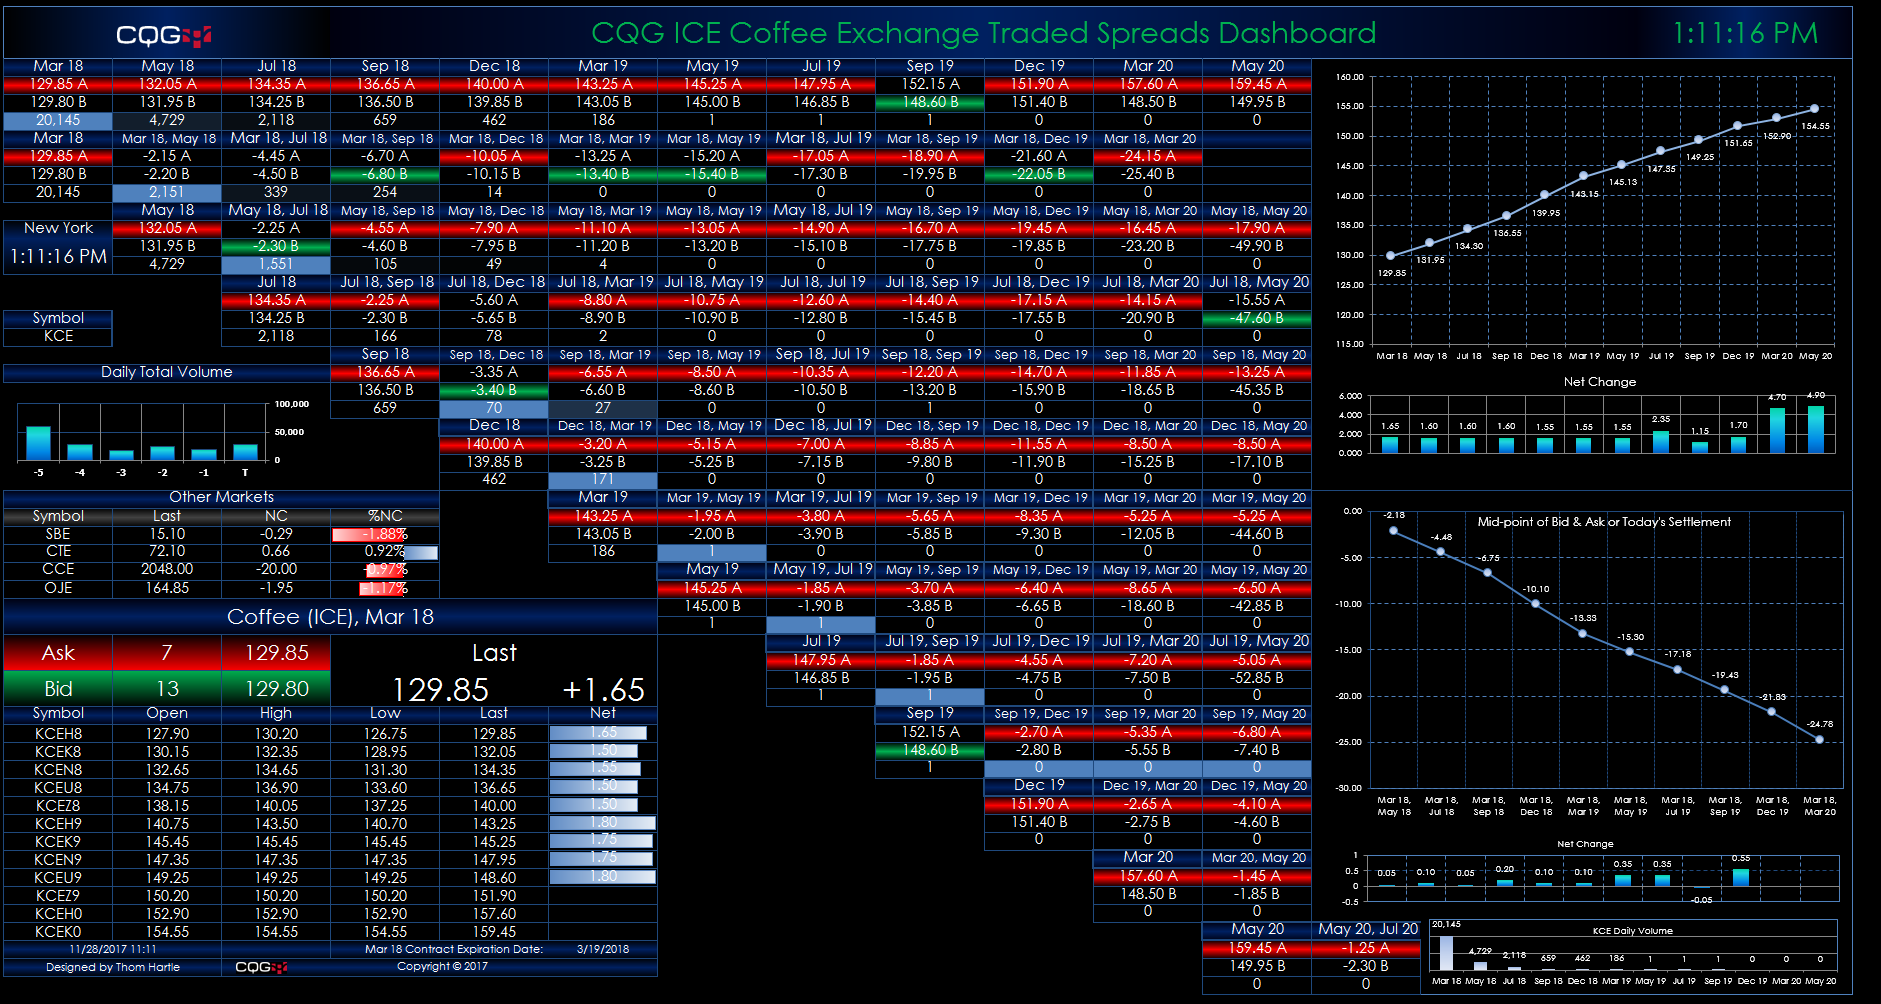
This Microsoft Excel® dashboard displays market data for coffee spreads traded on the ICE platform using a matrix-style format. The outrights are along the top row and at the start of each row.… more
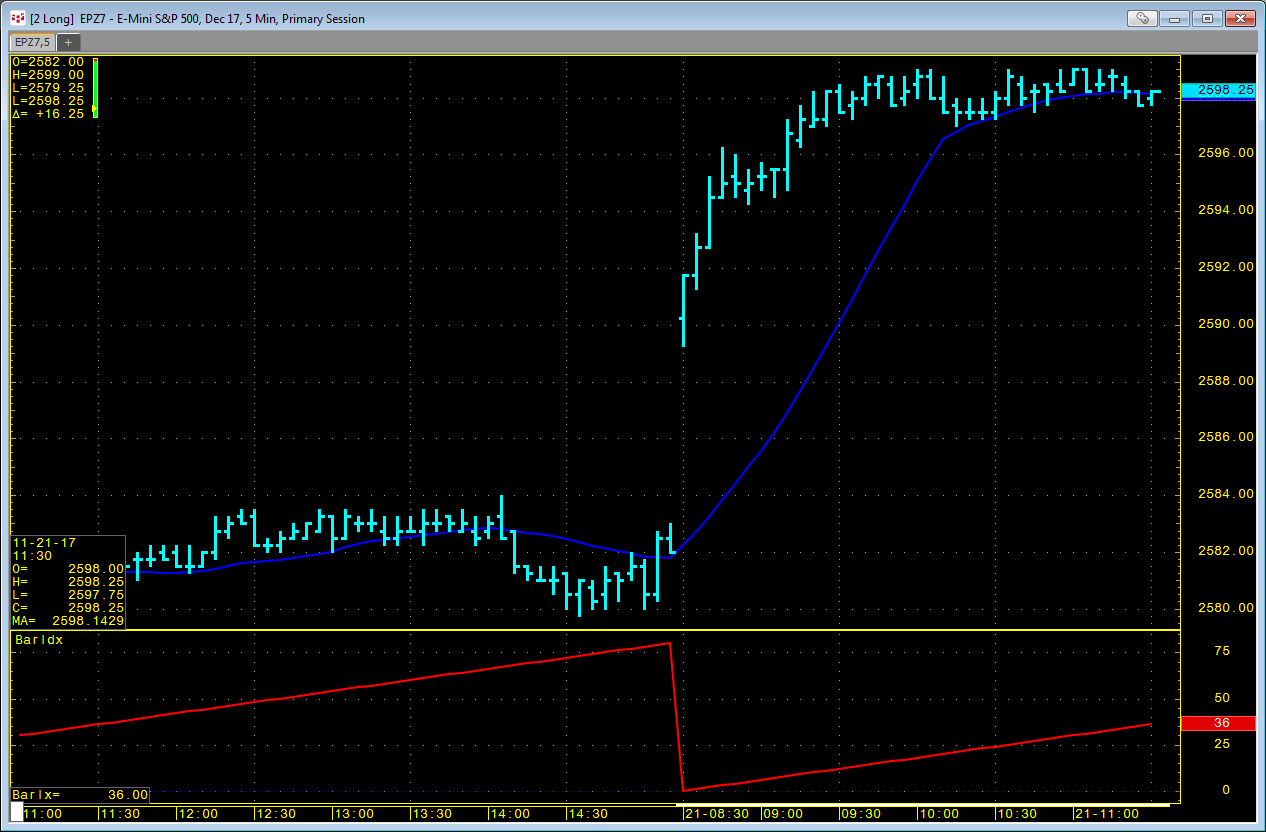
You can use LocalHour and LocalMinute functions in the RTD formula to pull in the open price for a market using a 5-minute bar at 12:00. This technique was detailed in a previous article here.… more
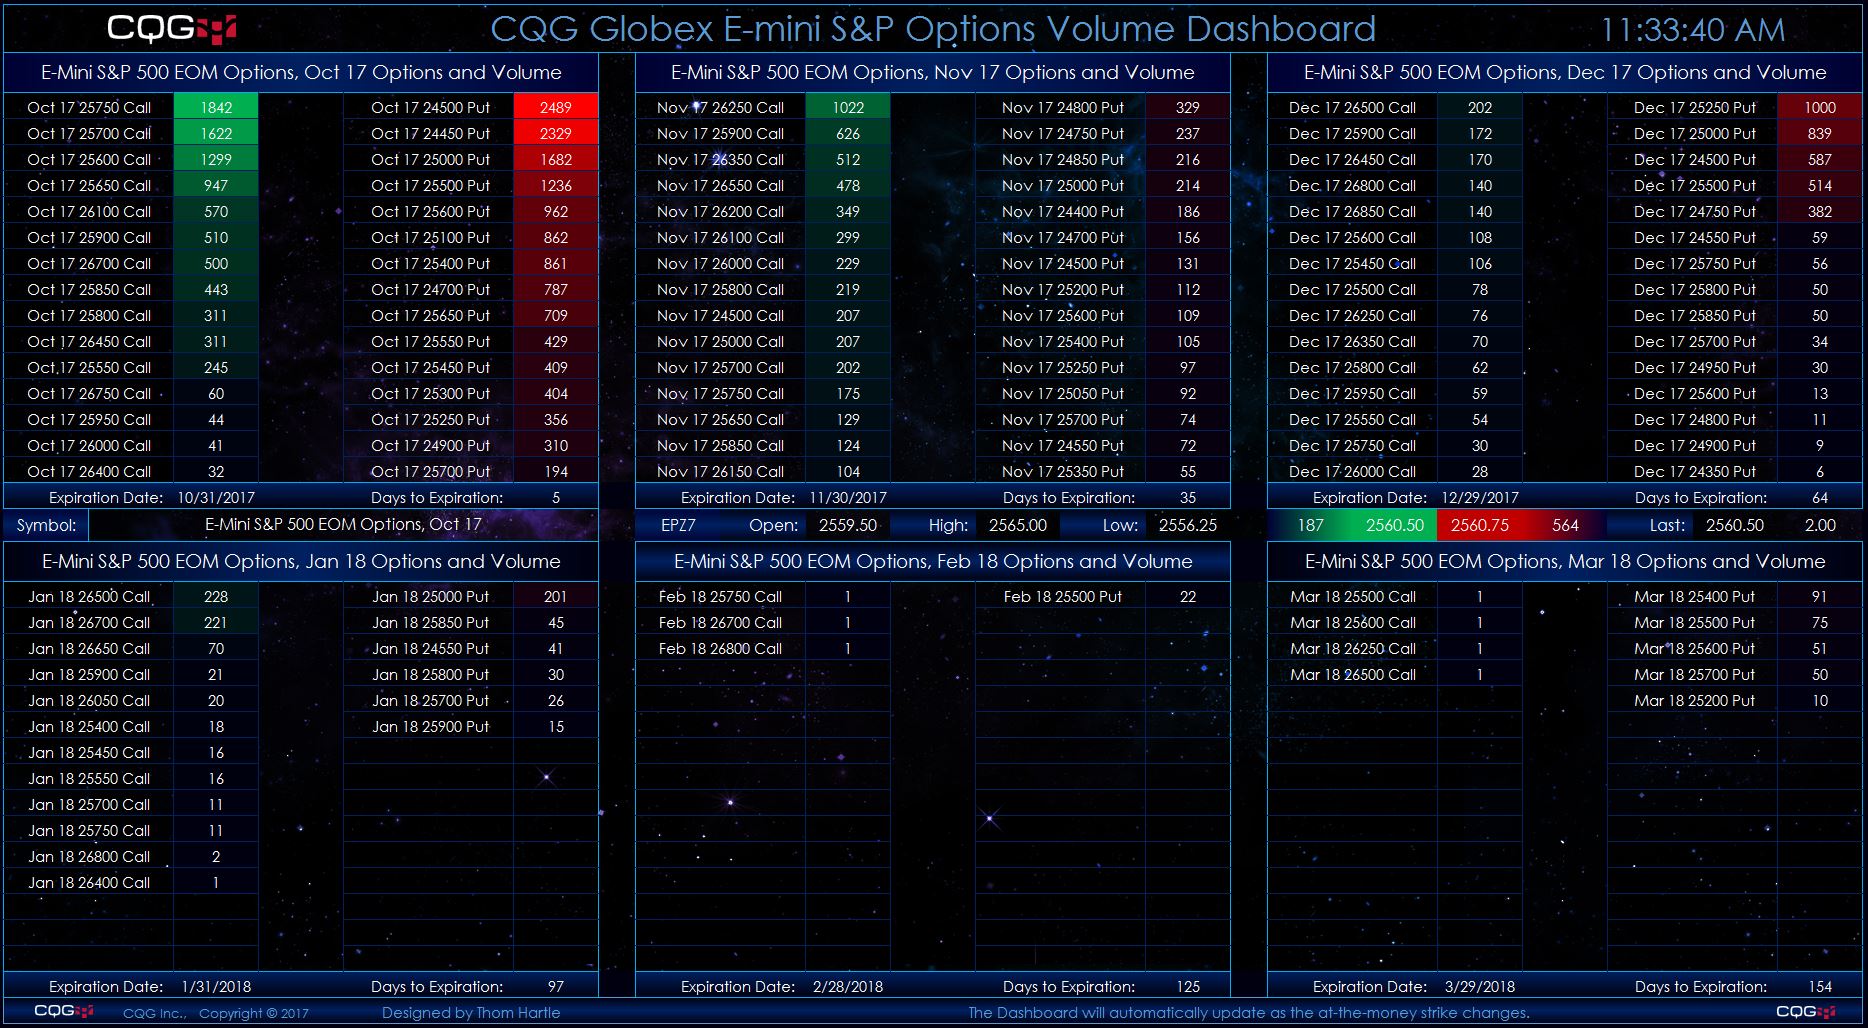
This Microsoft Excel® dashboard scans options on the E-mini S&P 500 futures market using the CQG RTD Toolkit for volume and displays strikes ranked by the volume traded for each listed expiry… more
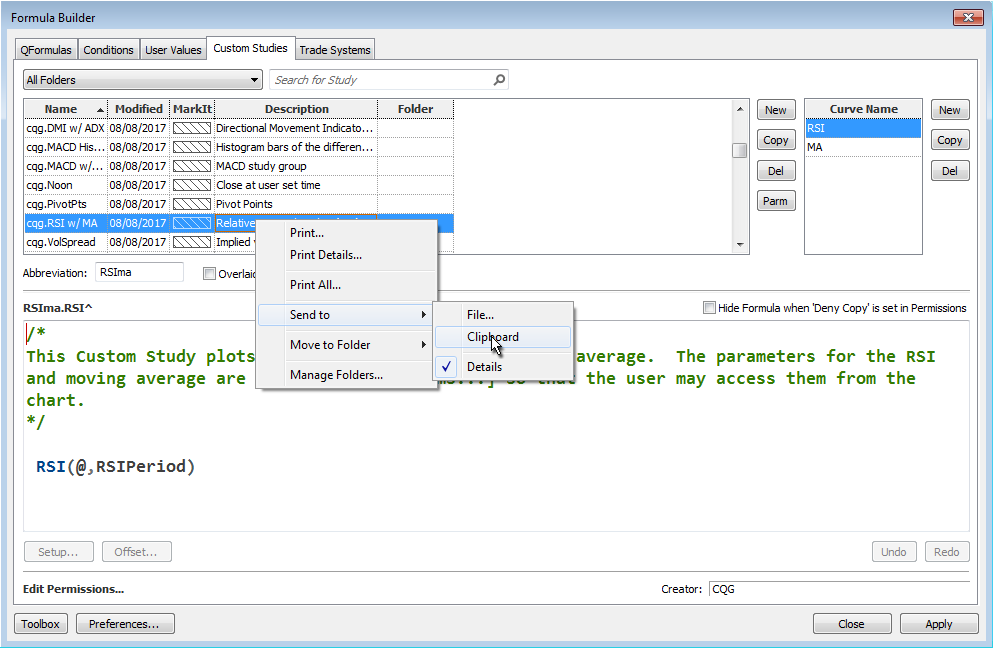
There are numerous Excel samples that walk you through bringing various market data into Excel using RTD formulas. However, there is a lot to look through. One solution is to use the CQG Formula… more
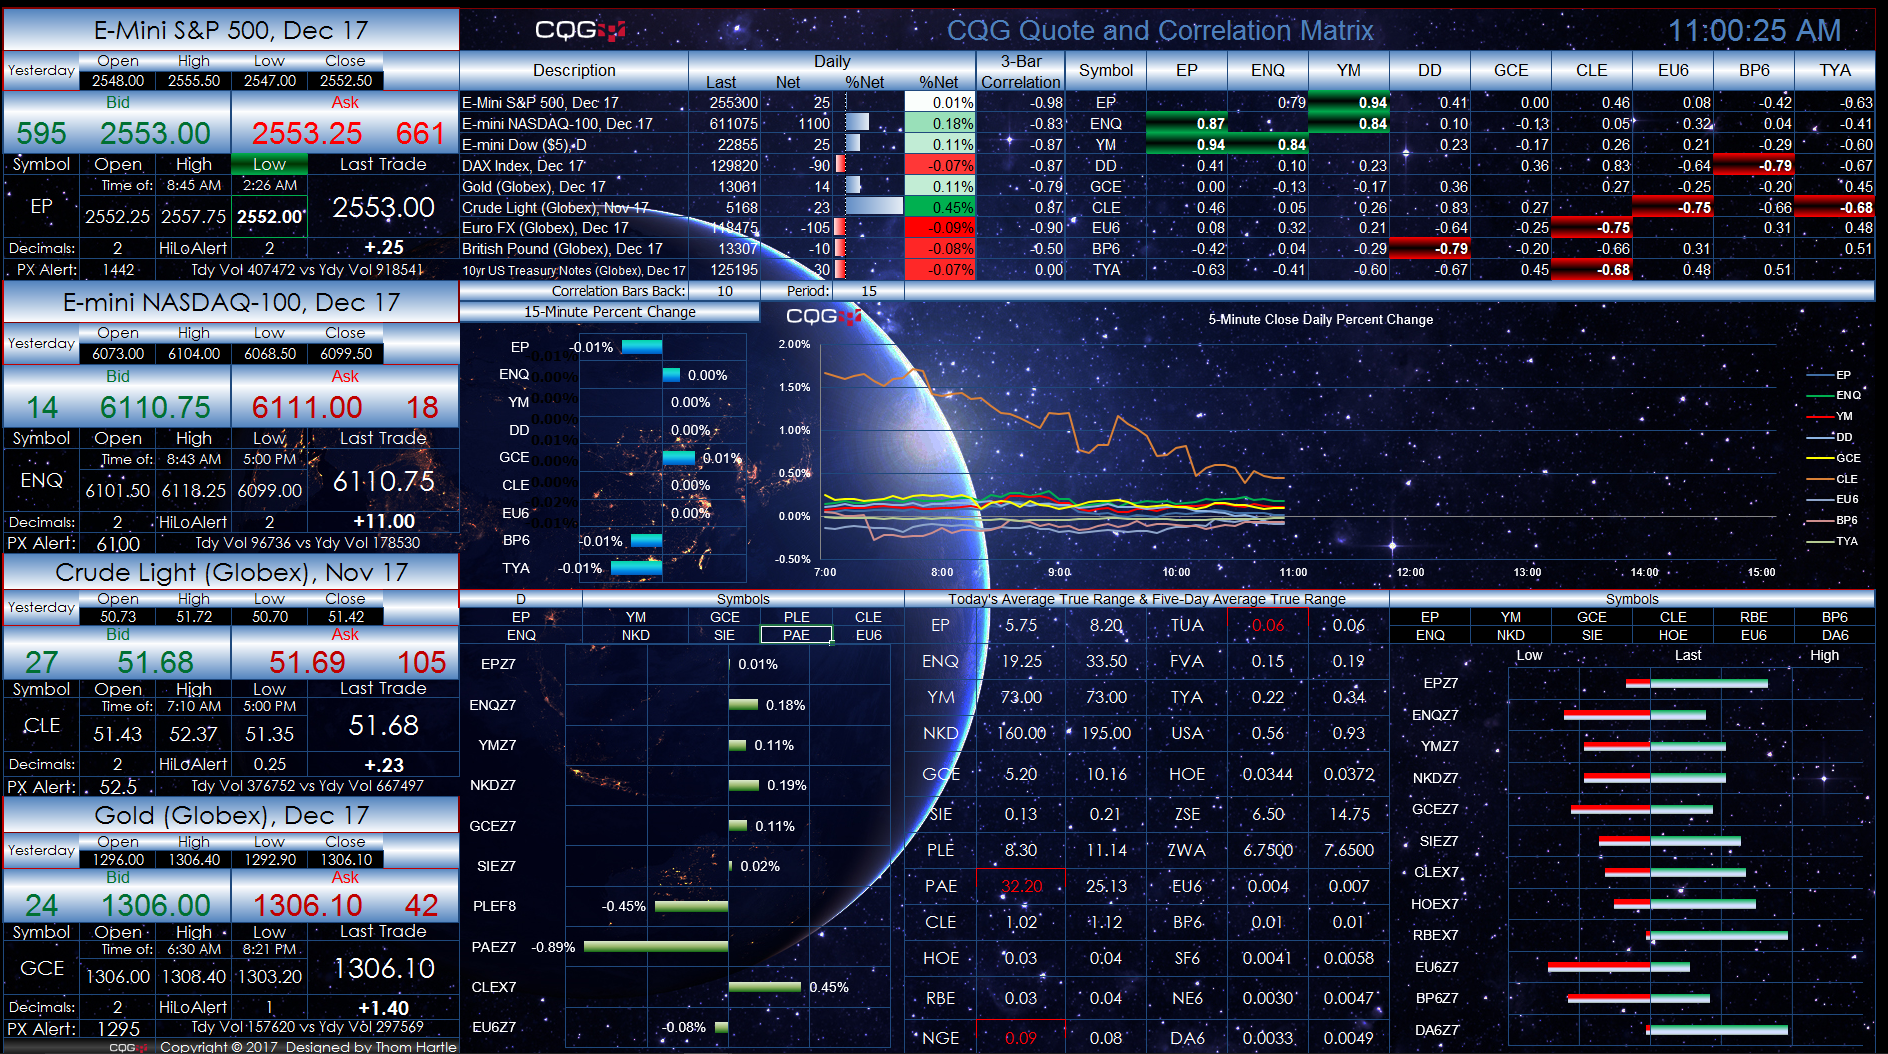
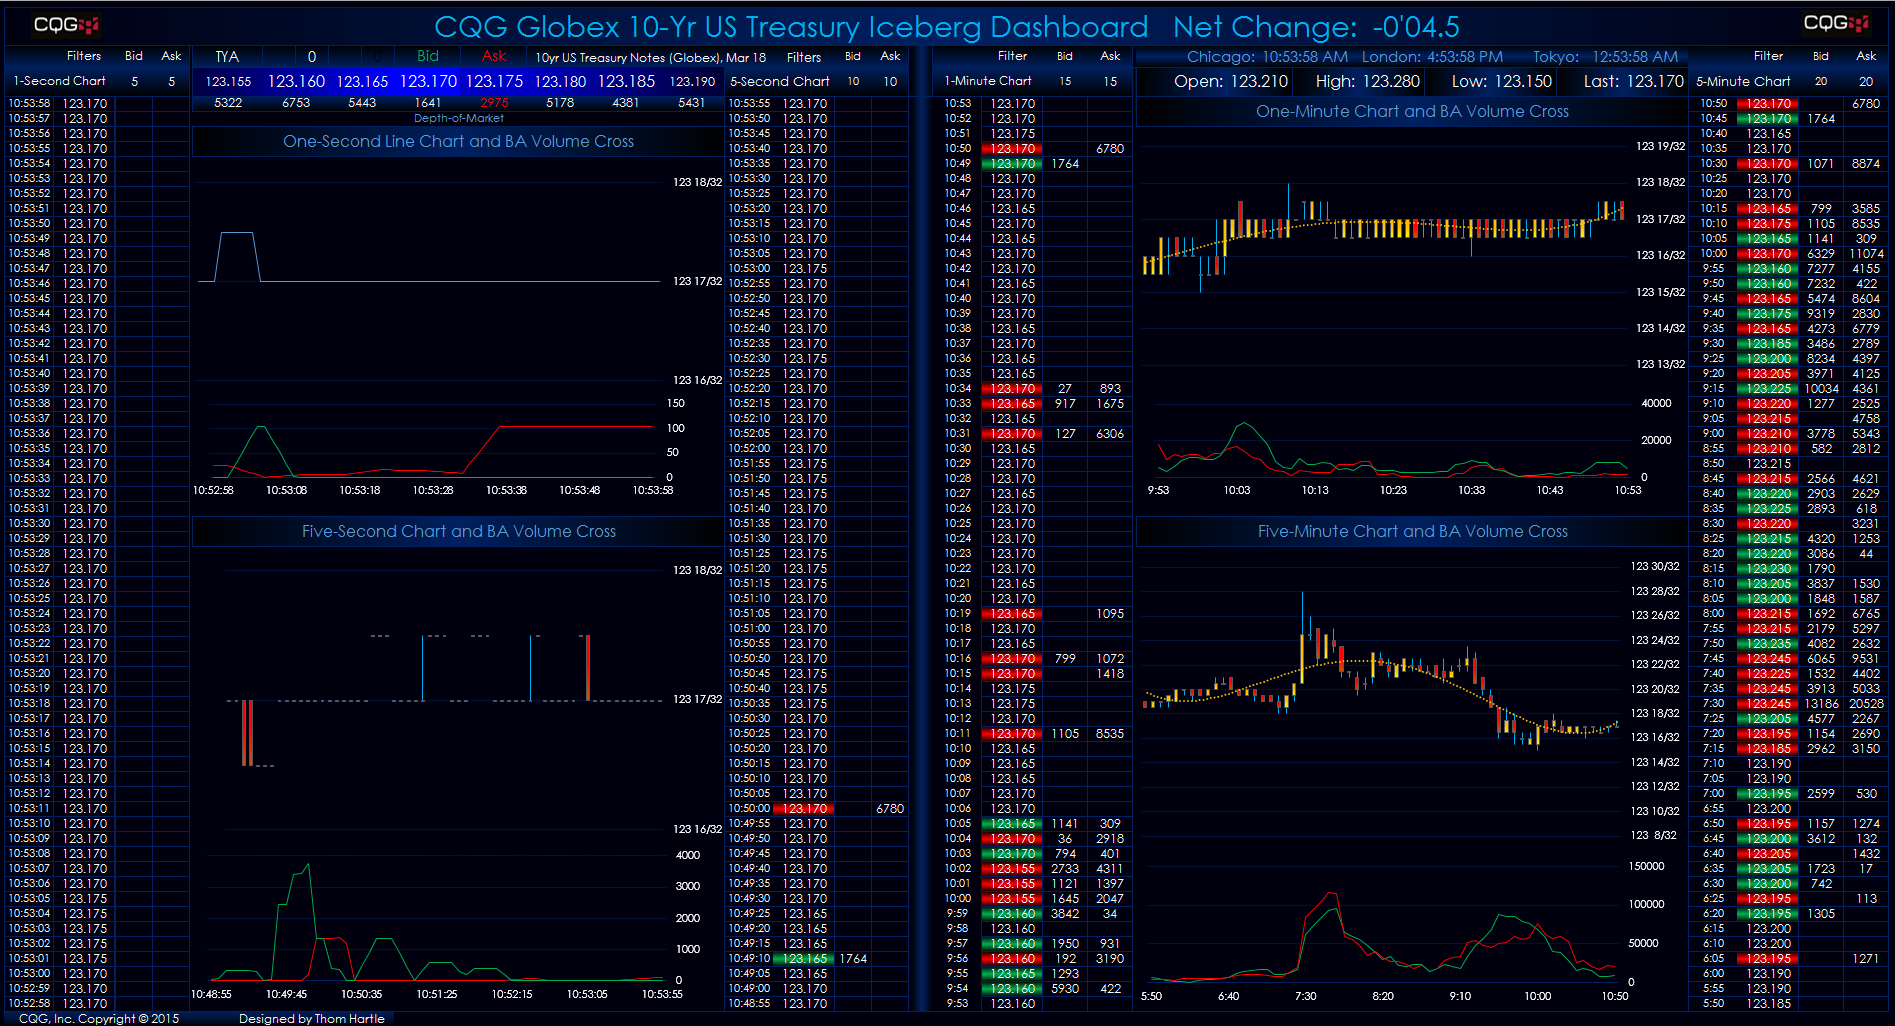
This Microsoft Excel® dashboard presents different styles of viewing market and study information. The left-hand side is today's current market data. You can enter symbols and set the number of… more