
This Microsoft Excel® spreadsheet presents Globex crude oil market data and forward curves. The data includes outrights, exchange-traded calendar spreads, and butterfly spreads. The exchange-… more
Workspaces
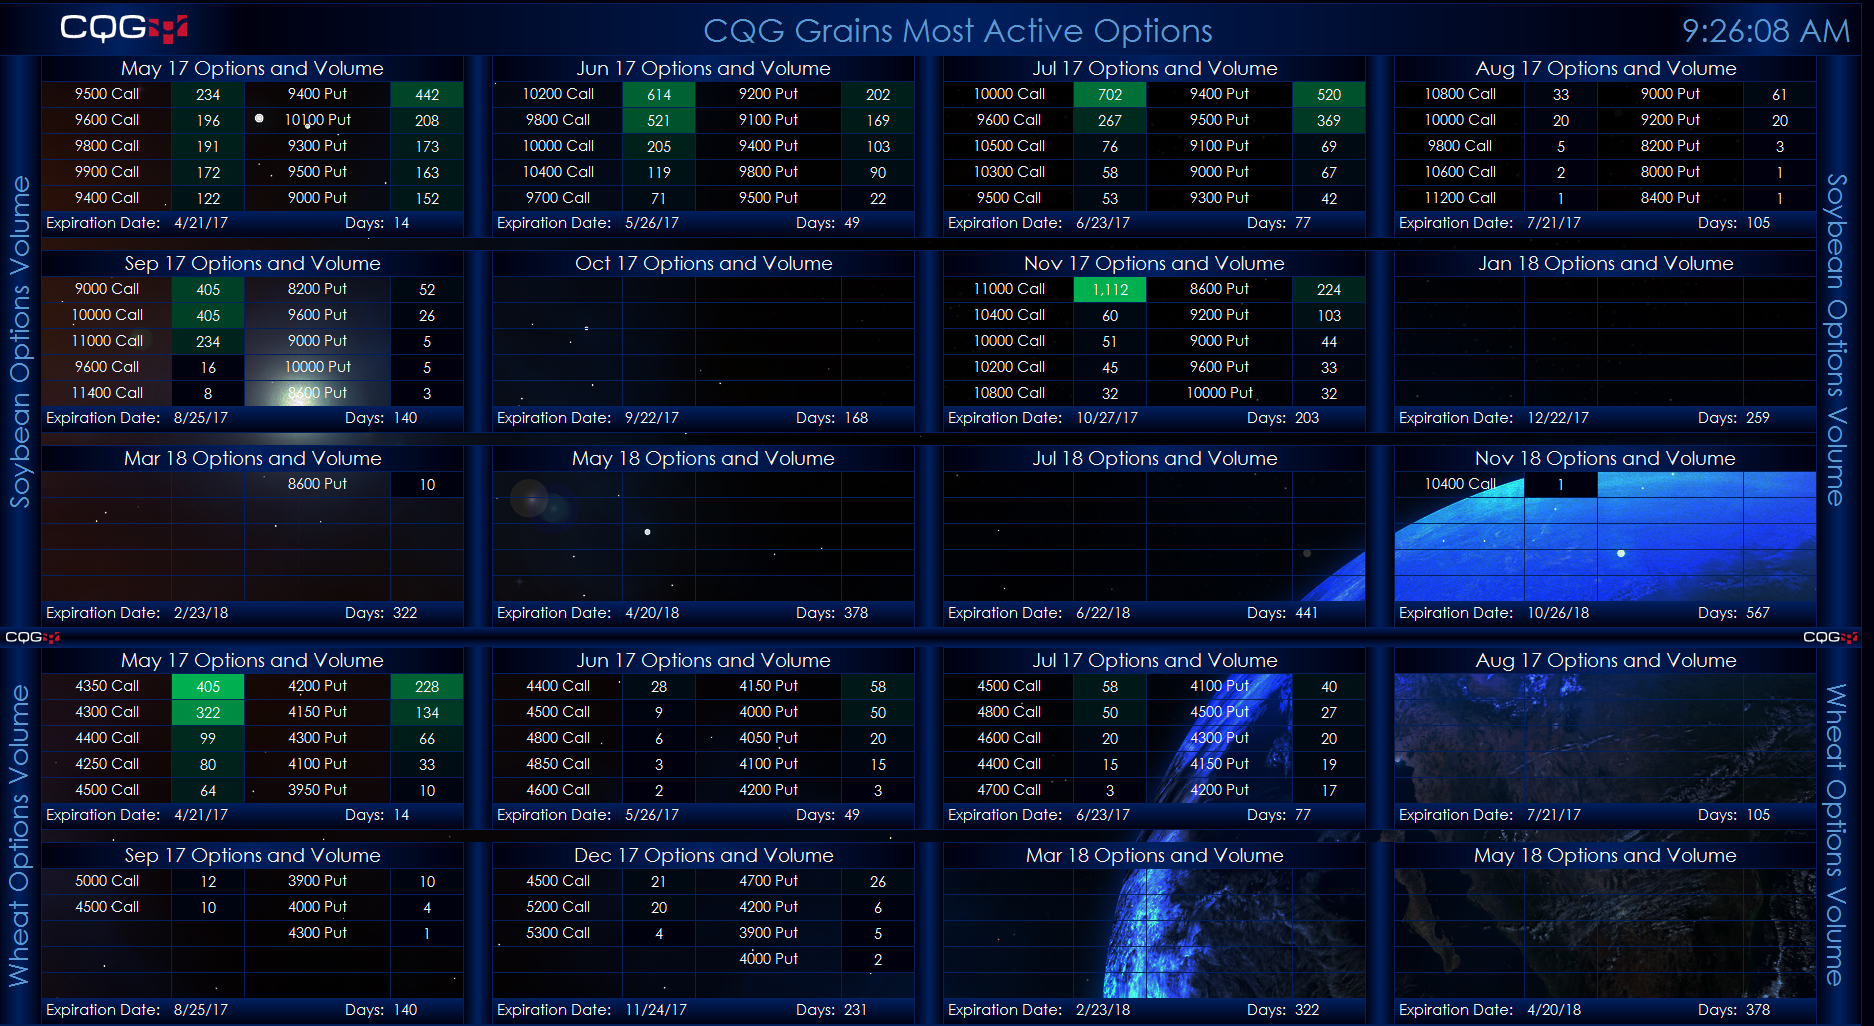
This Microsoft Excel® dashboard scans the options on soybeans, wheat, and corn (Globex) futures markets for volume. It displays strikes ranked by the volume traded for each expiry listed… more
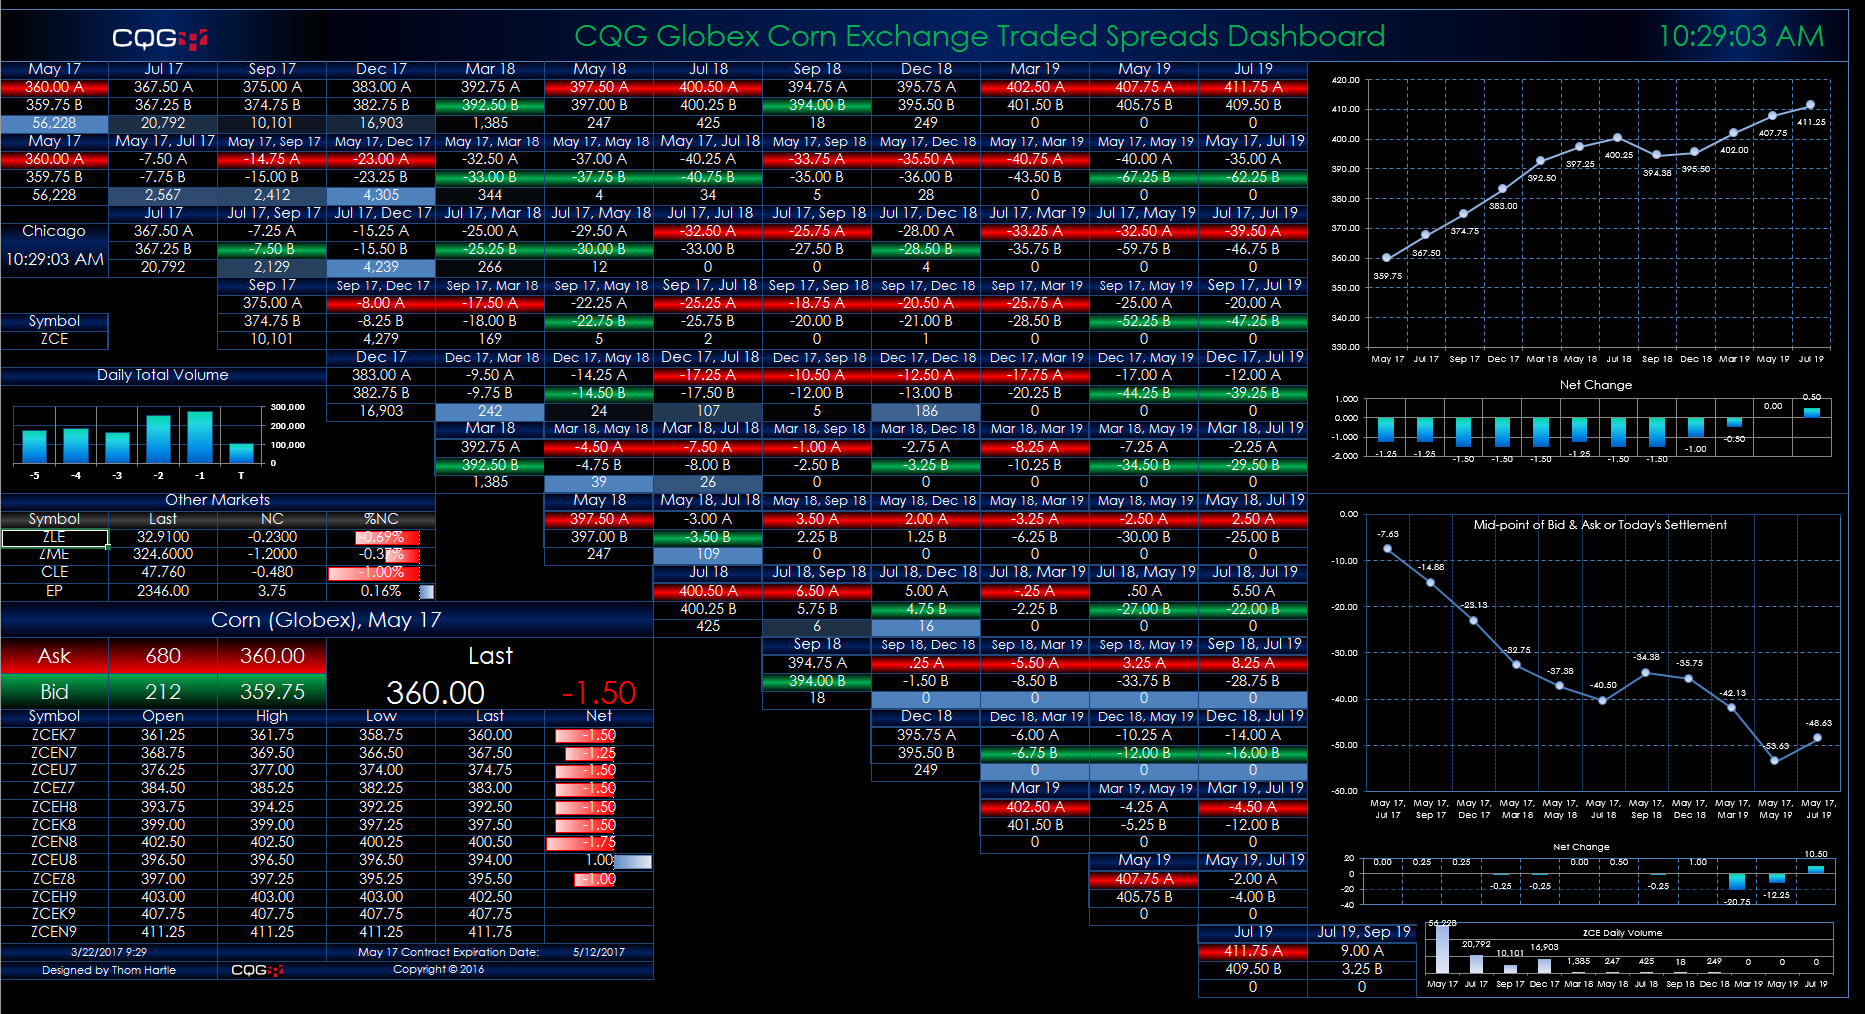
This Microsoft Excel® dashboard displays market data for grain spreads traded on the Globex platform using a matrix-style format. The outrights are along the top row and the start of each row. The… more

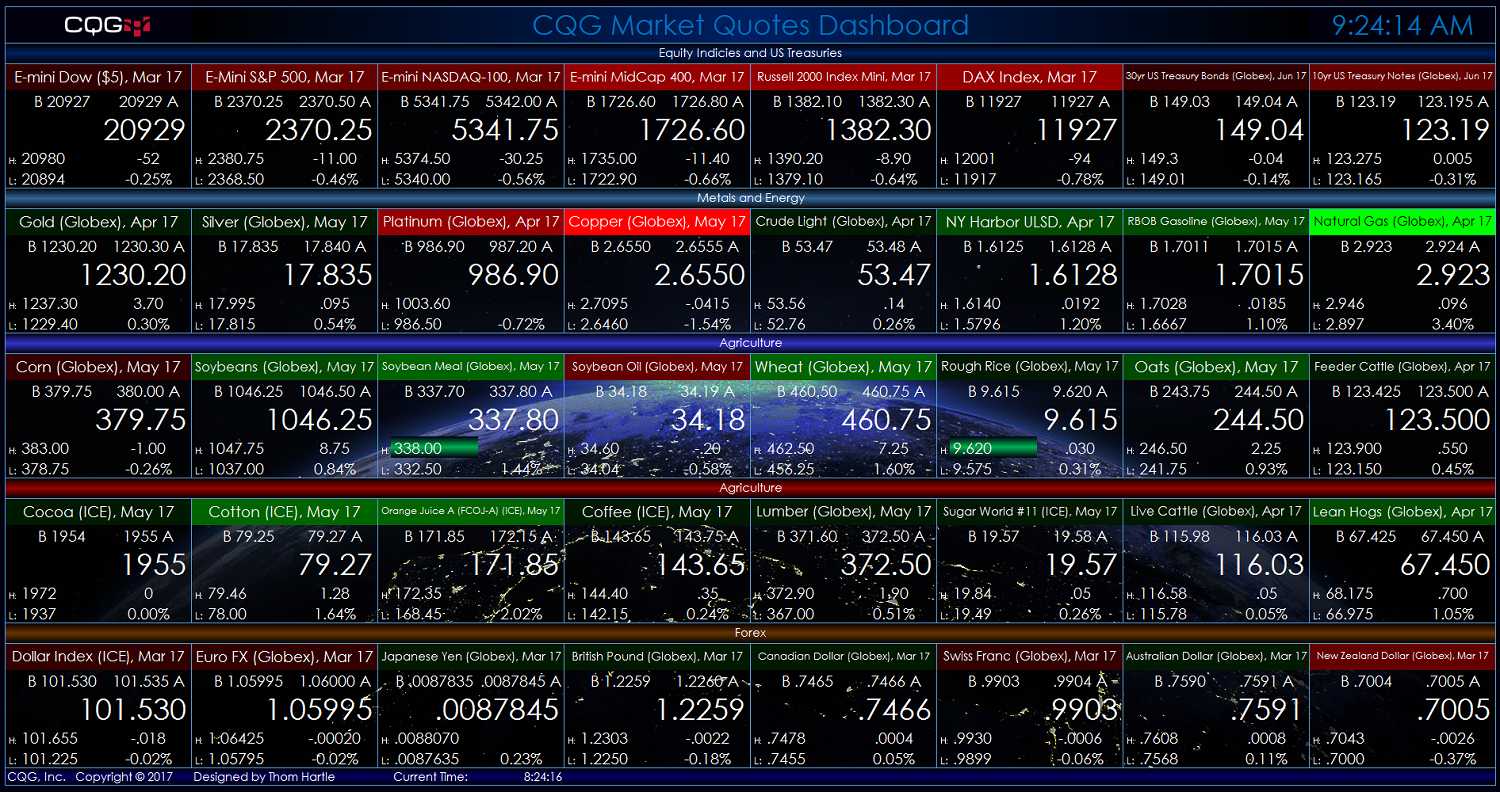
This Microsoft Excel® spreadsheet is a combination of market quotes and dynamic ranking. There is a Symbols tab where you can enter the symbols and the parameter for decimal formatting, or you can… more
This Microsoft Excel® spreadsheet pulls market data from CQG Integrated Client or CQG QTrader. There is a Symbols tab where you can enter the symbols, the parameter for decimal formatting, and the… more
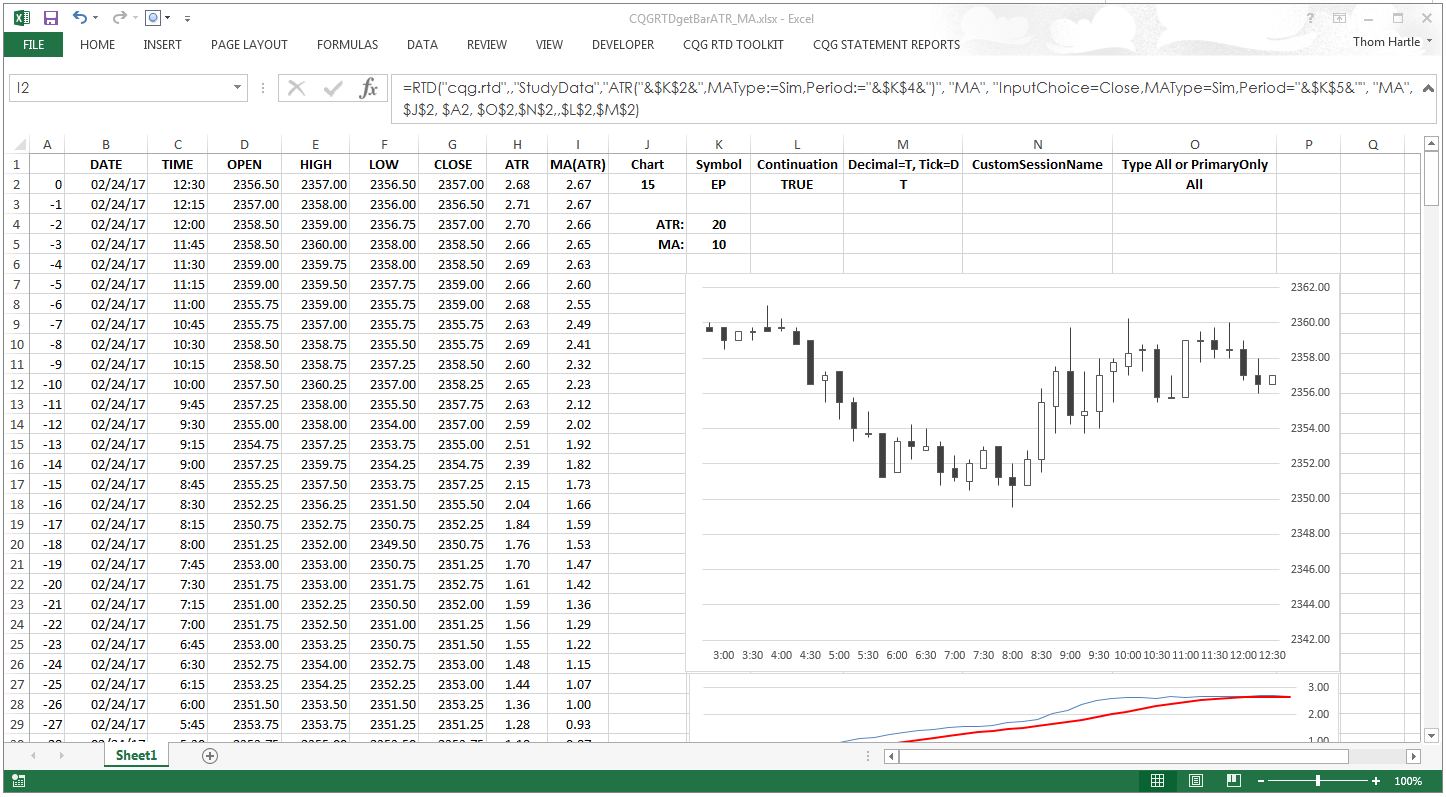
This article shows RTD formulas for pulling values into Microsoft Excel® that are a study applied to a study.
A common use of Excel with CQG is to pull in study data, such as the… more
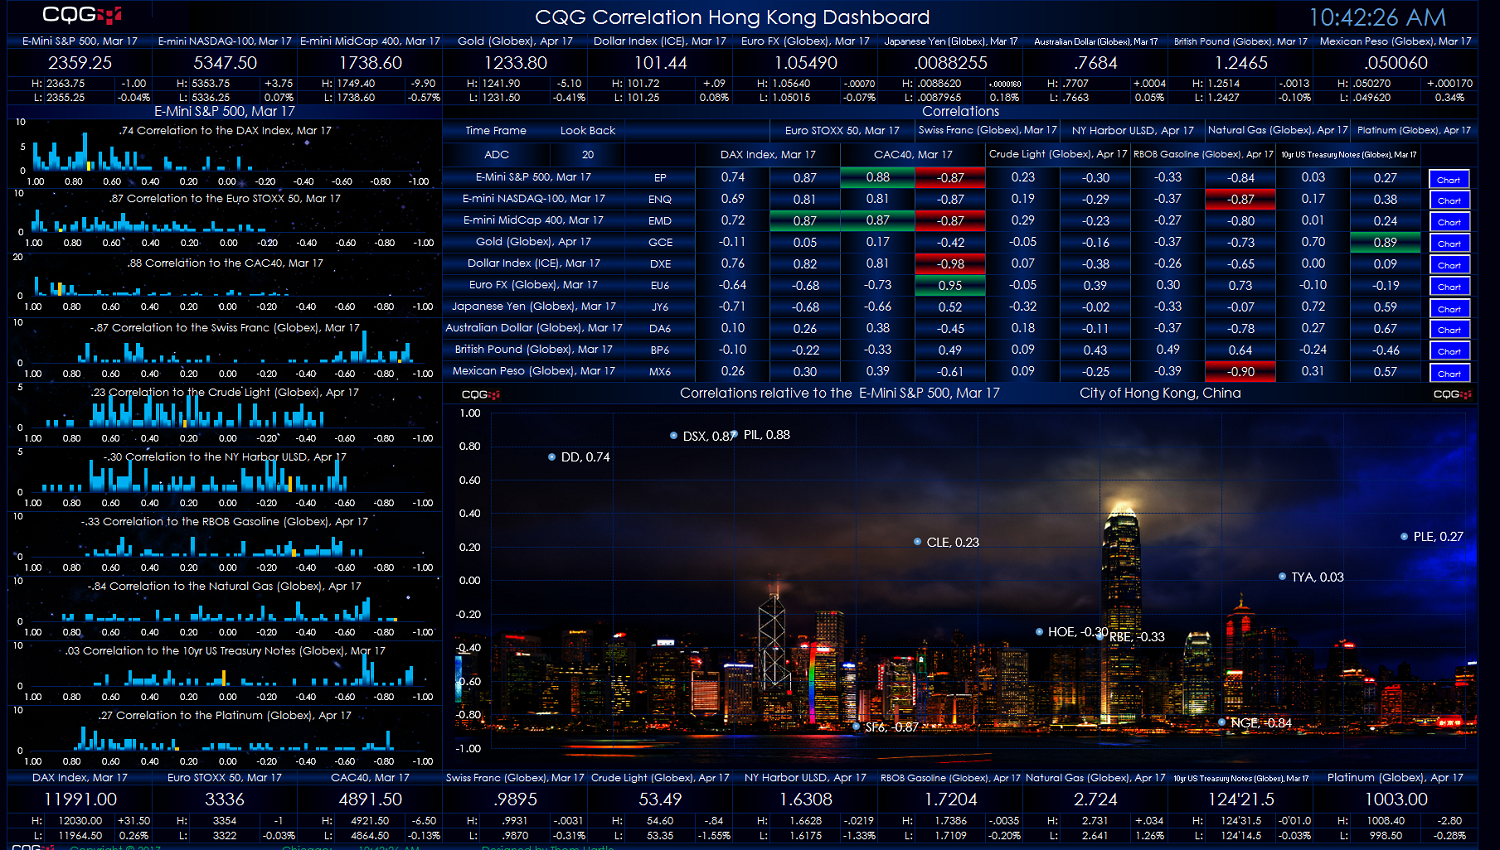
This macro-enabled Microsoft Excel® spreadsheet presents a ten-by-ten correlation matrix, a scattergram chart of the correlations by row, and frequency distribution charts of the correlations. In… more
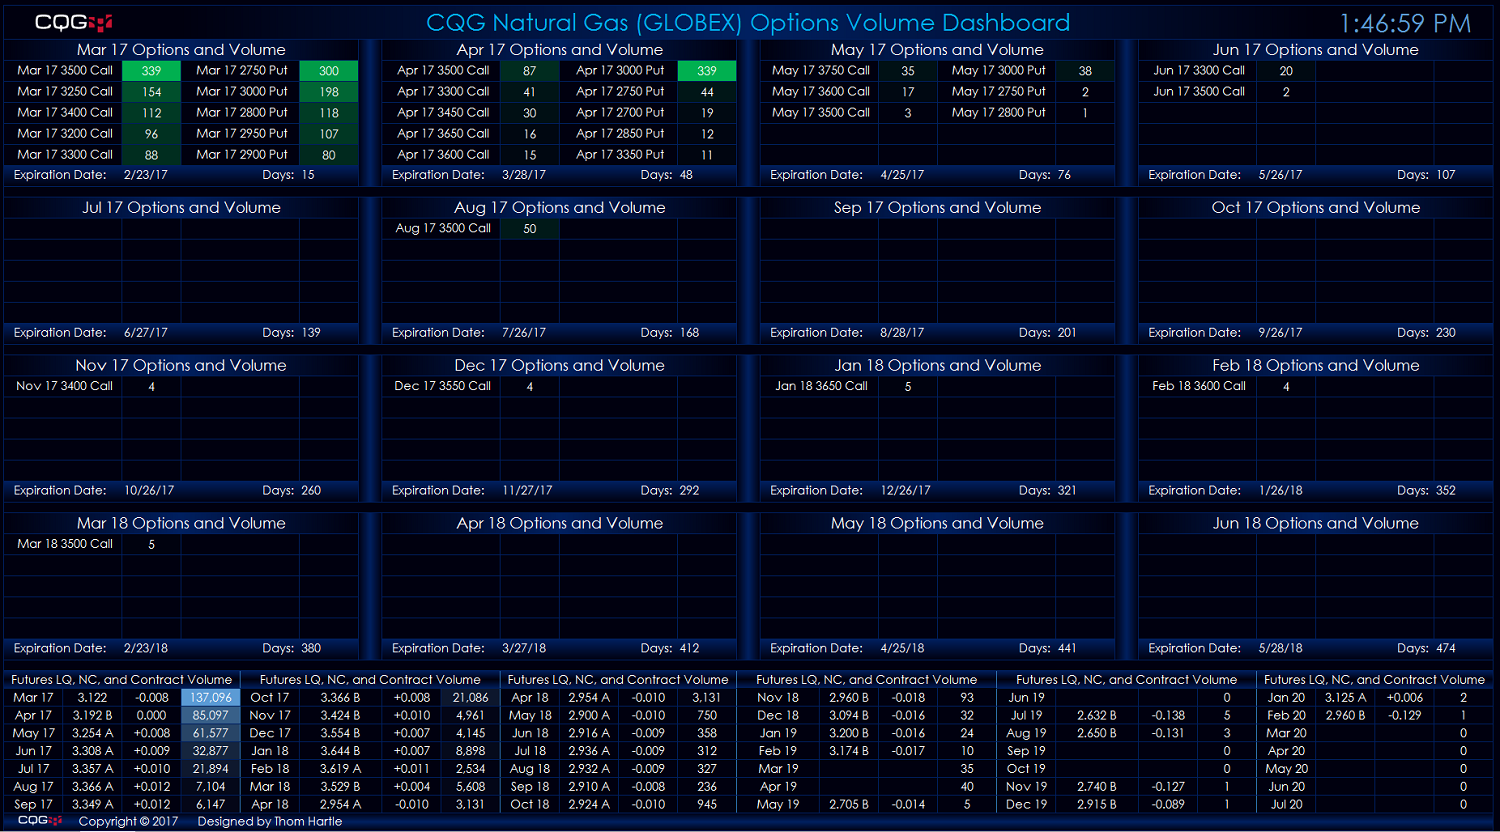
This Microsoft Excel® dashboard scans the options on the natural gas (Globex) futures market for volume and ranks the volume traded for each expiry out sixteen months. The scan covers options… more
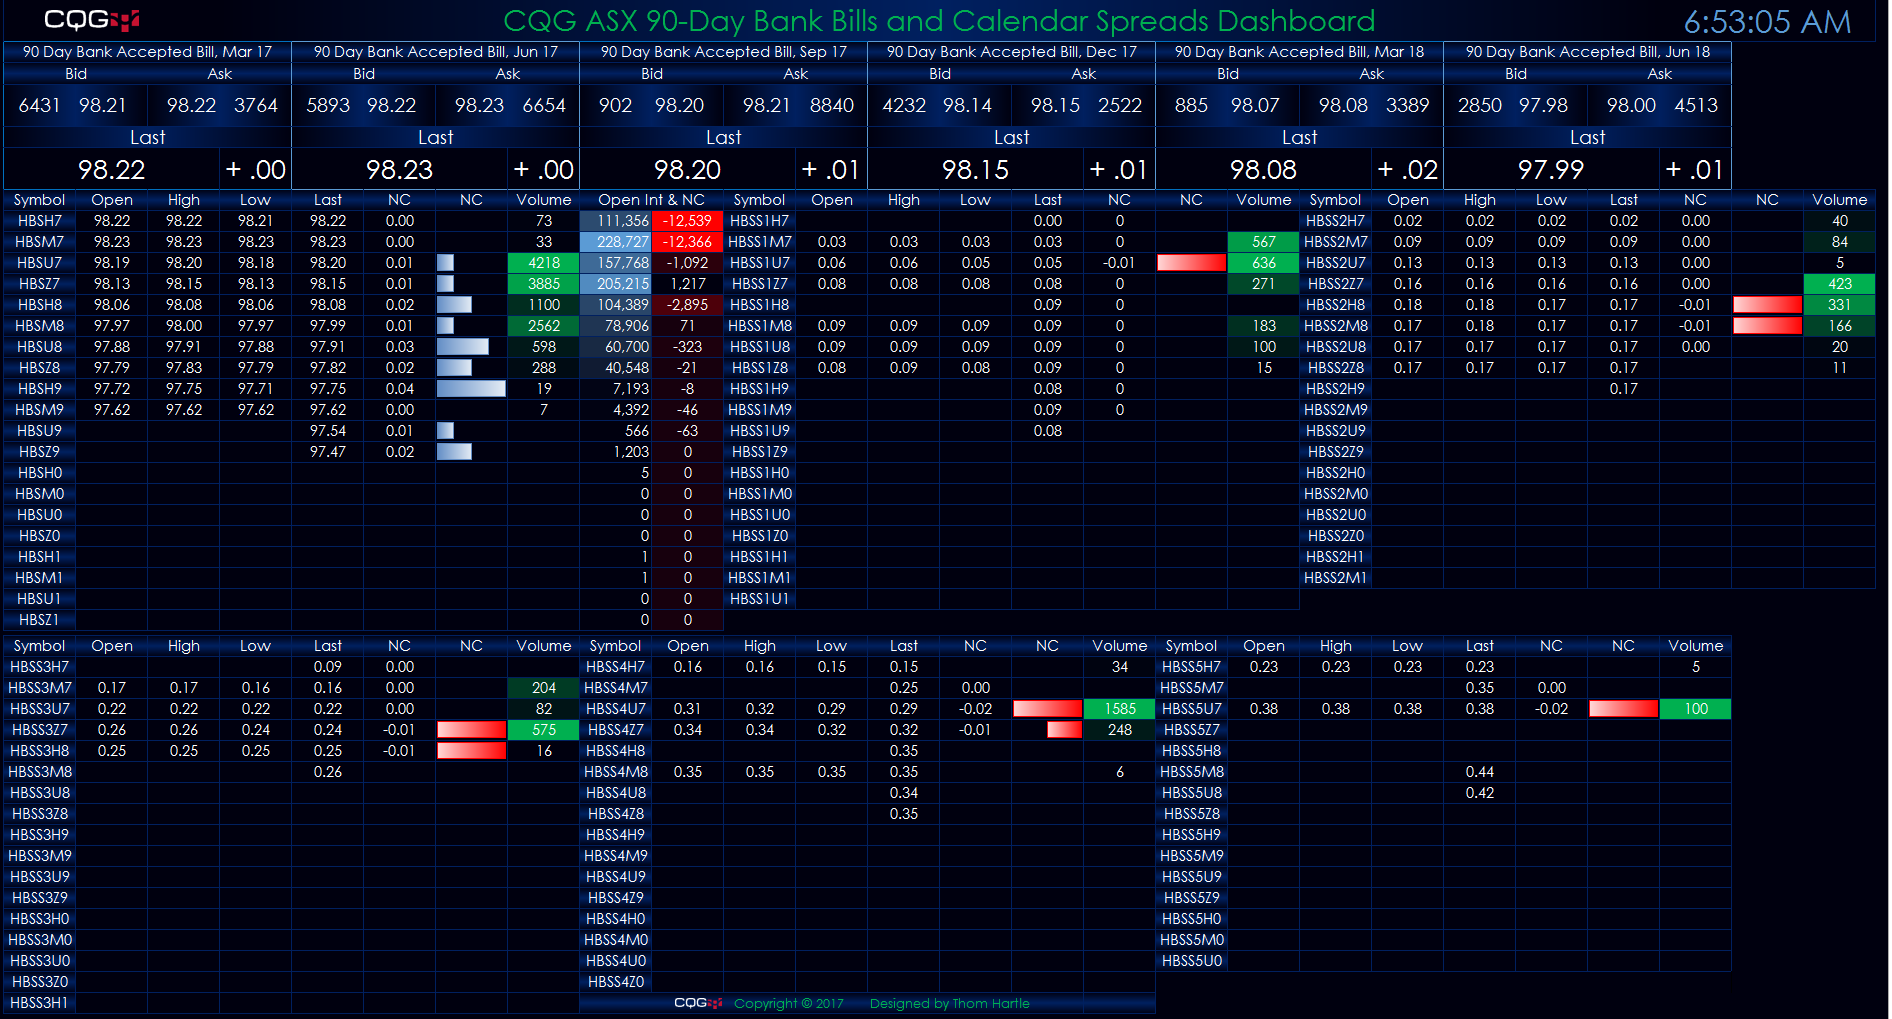
This Microsoft Excel® dashboard displays 90-day bank bills and exchange-traded spreads traded on ASX. The inside market for the front six contracts is detailed along the top. The open, high, low,… more
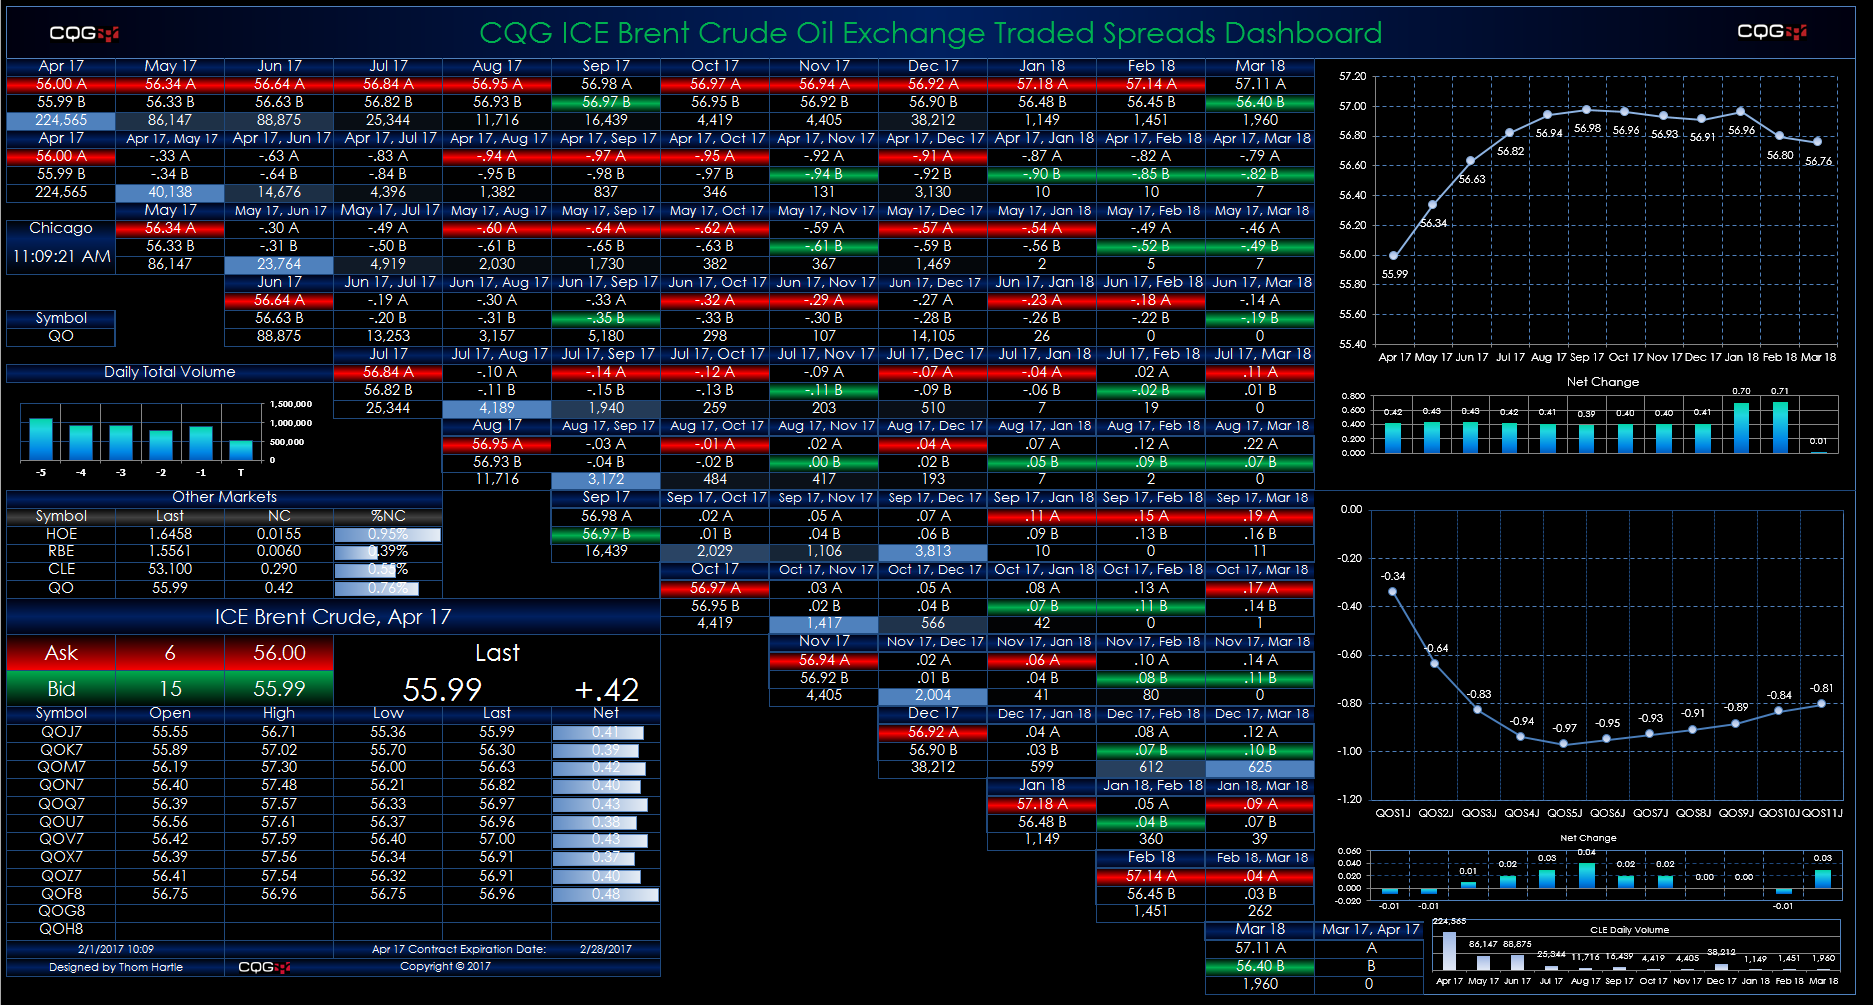
This Microsoft Excel® dashboard displays market data for crude oil spreads traded on the ICE platform using a matrix-style format. The outrights are along the top row and the start of each… more