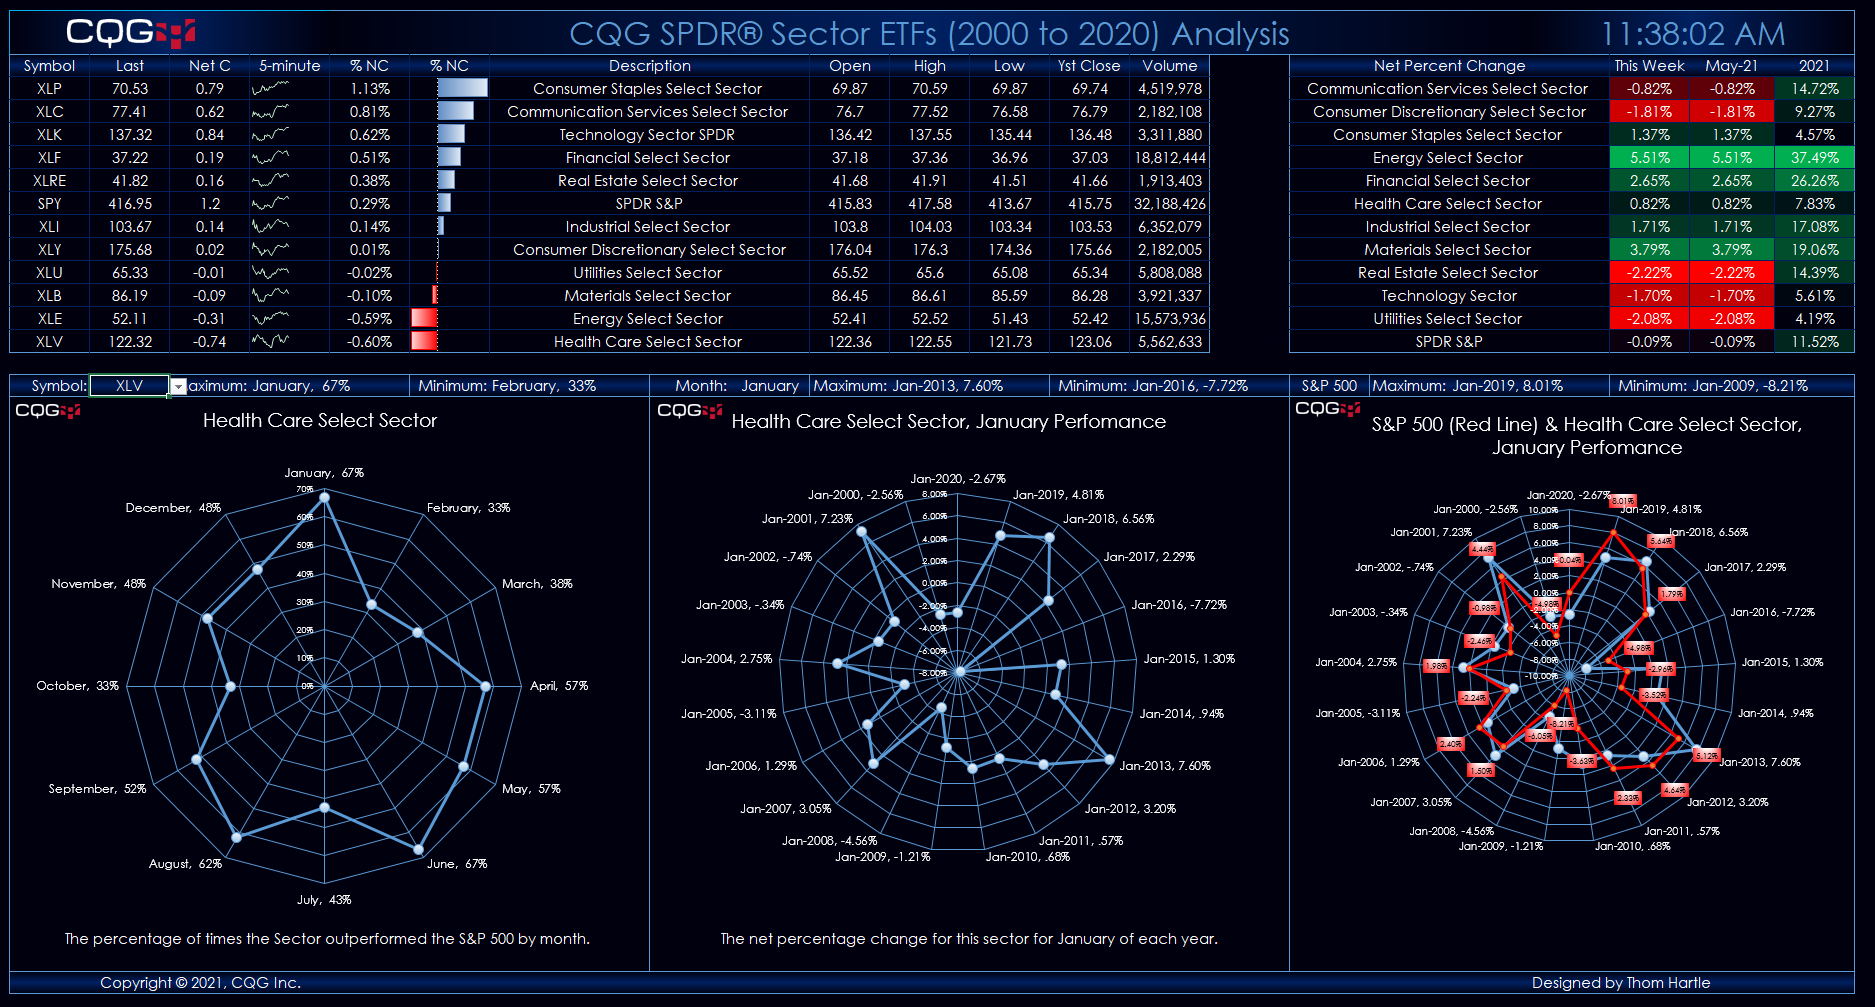
SPDR® Sector ETFs Analysis Dashboard This Microsoft® Excel dashboard provides analysis of S&P Sectors based on ETFs. The collection of ETFs are:
Symbol Description XLC Communication… moreWorkspaces
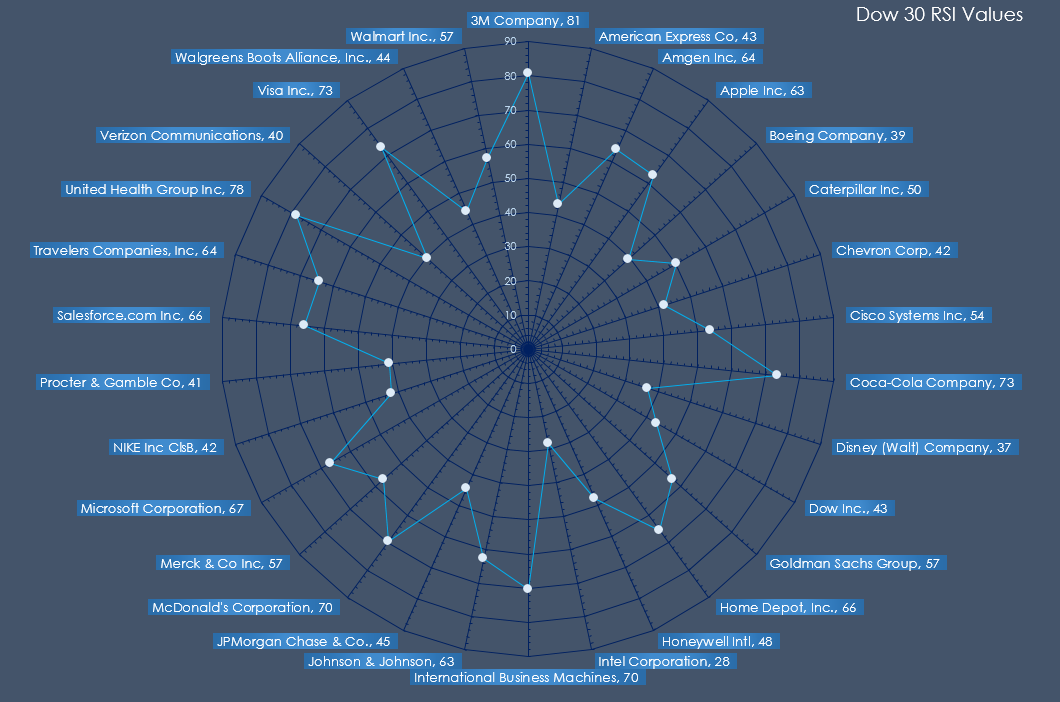
Microsoft® Excel offers the Radar Chart. This chart does not use the typical X-axis versus Y-axis. Instead, the radar chart is a graphic display of multivariate data in the form of a two-… more
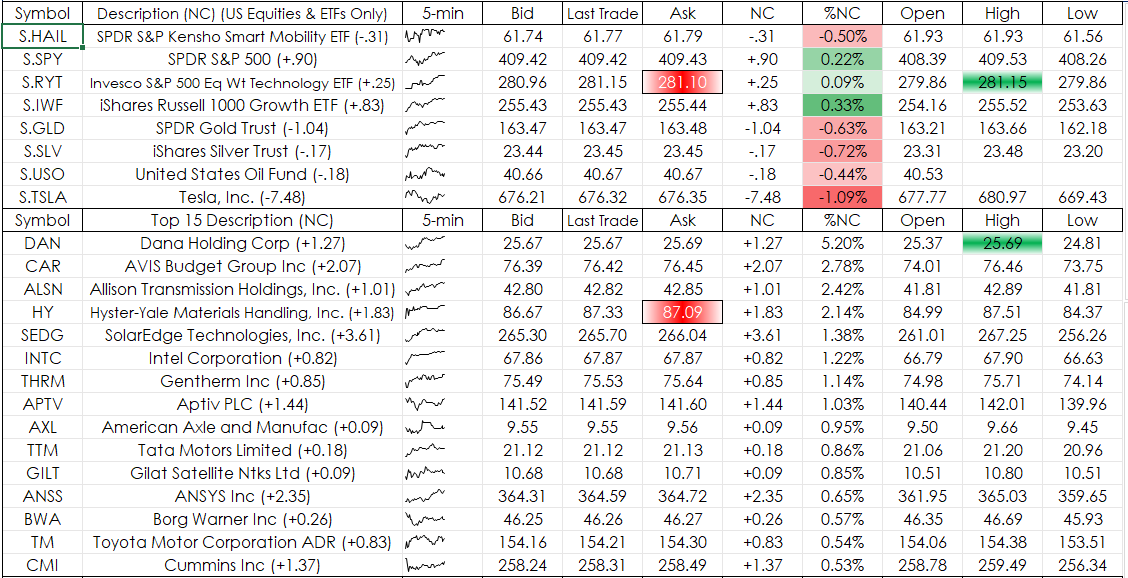
Sparklines have been available beginning with Microsoft® Excel 2010. A Sparkline is a simple chart that is displayed within a cell or a group of merged cells. Sparklines are a nice addition to a… more
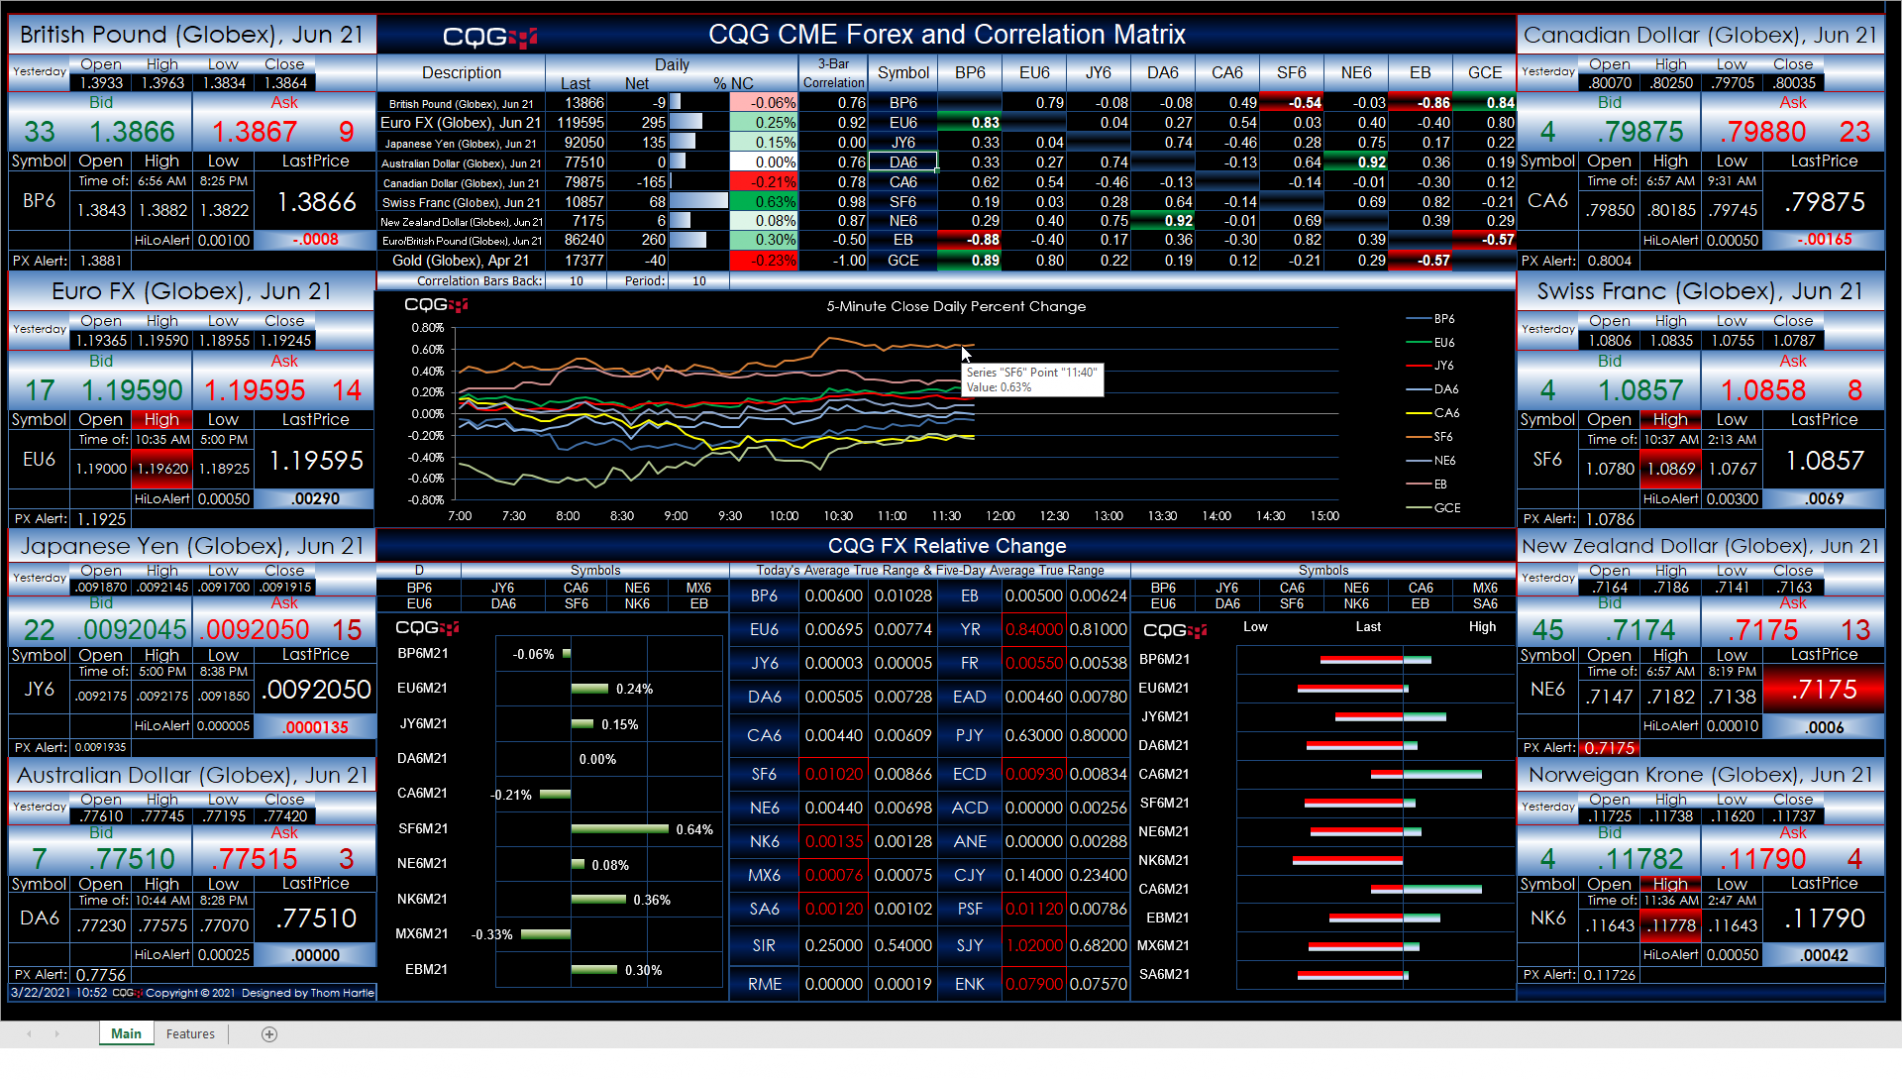
This Microsoft® Excel dashboard presents a range of market data using CME Forex Symbols. However, you can enter in your own symbols.
Always use upper case for symbols. Enter into the Symbol… more
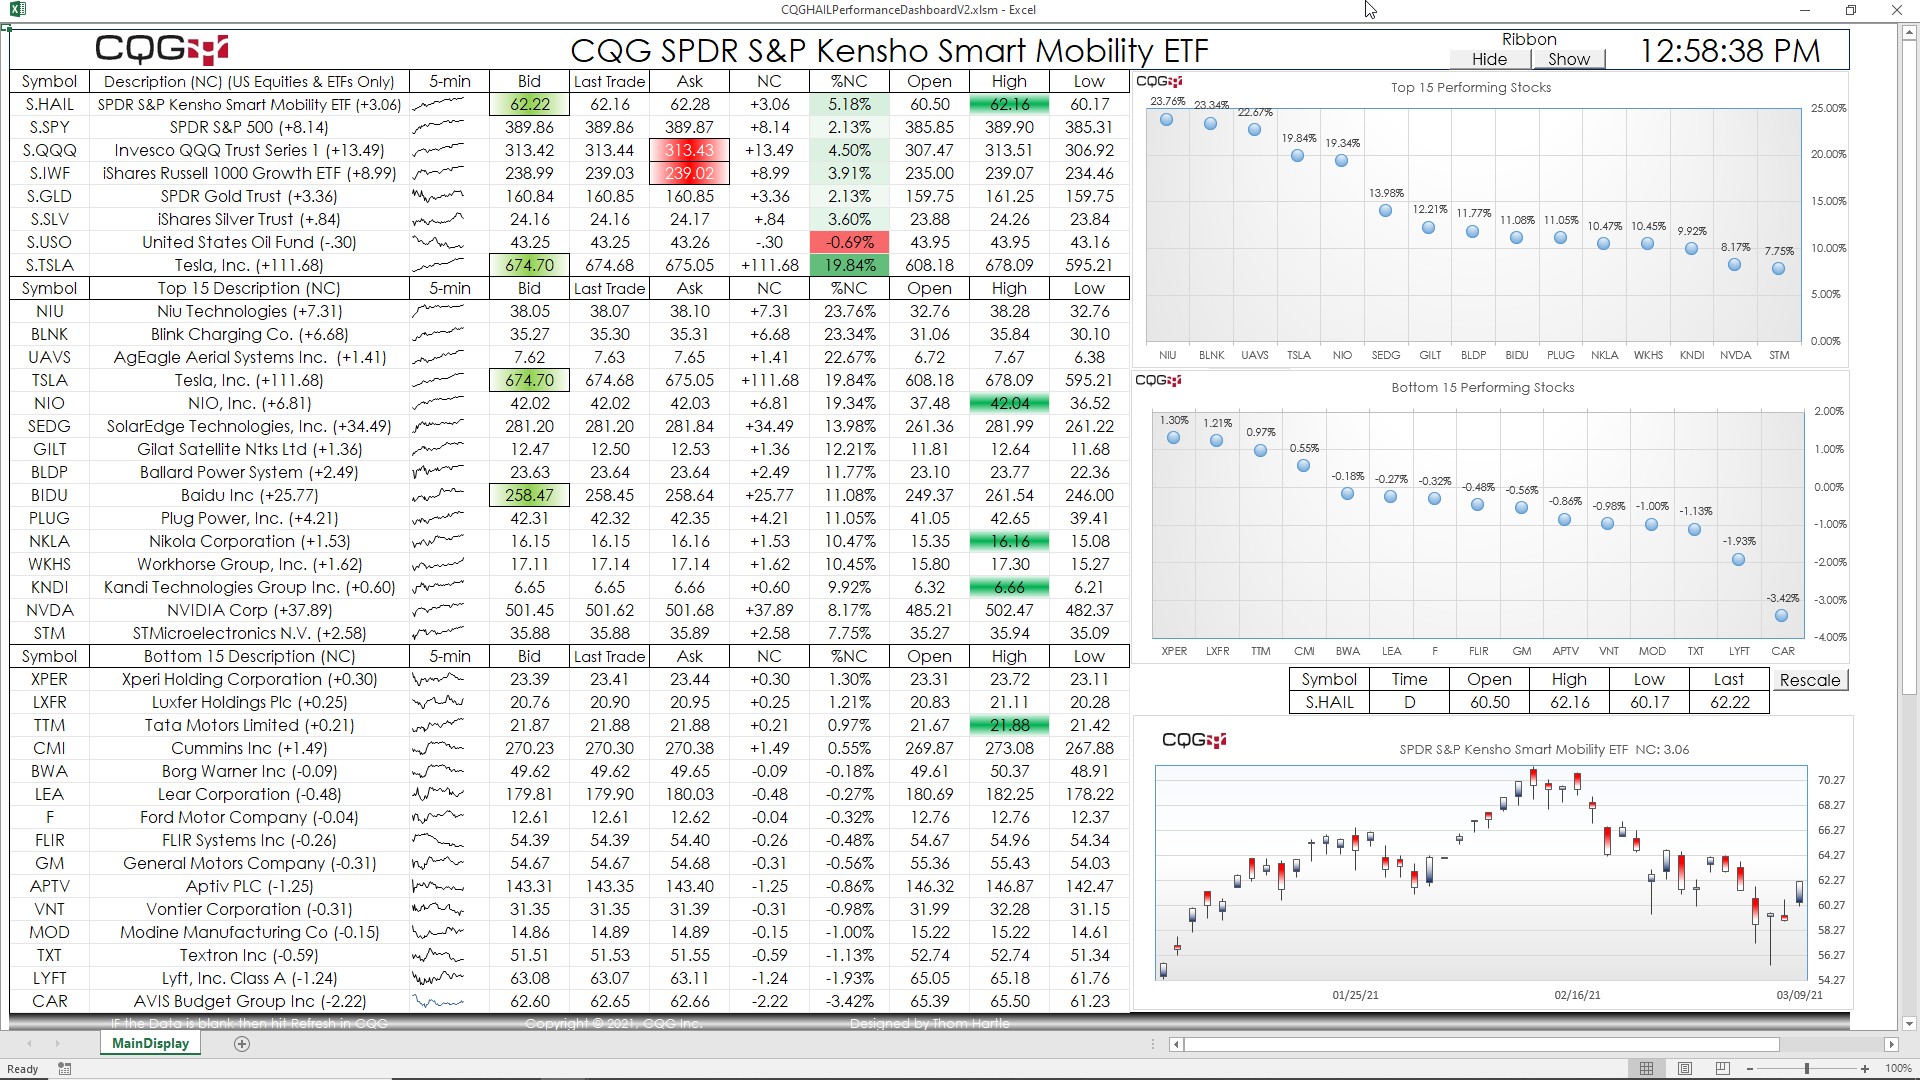
Traders and investors have a multitude of opportunities for theme investing. That is, ETFs are structured to invest in companies that are part of an industry, such as Biotech, Internet, Aerospace… more
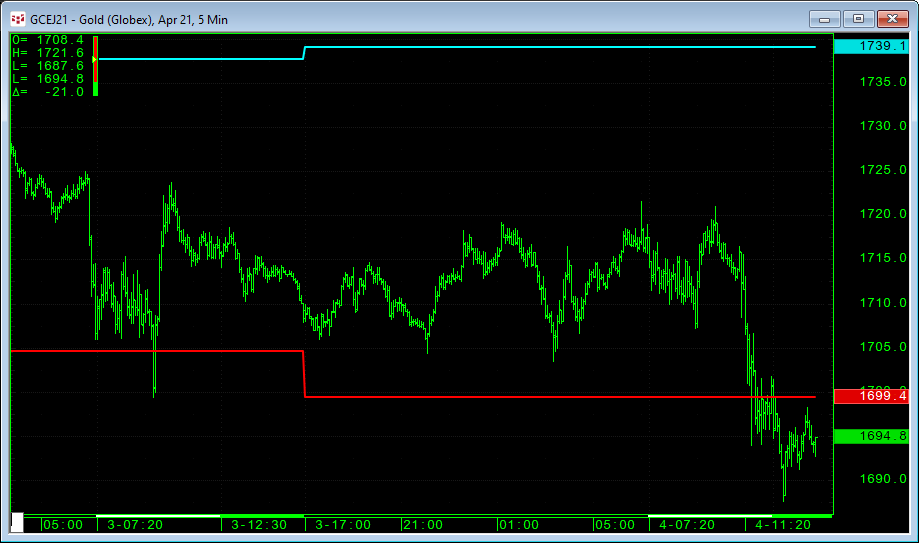
The BarInt function can be useful when creating Custom Studies or Conditions which can be applied to different timeframe but where a point of reference may be different whether you are looking at… more
One of the simplest examples for this function is to find out whether a value is an even number.
Modulus (Close(@),2) = 0In other words, the result of the formula above would give us the… more
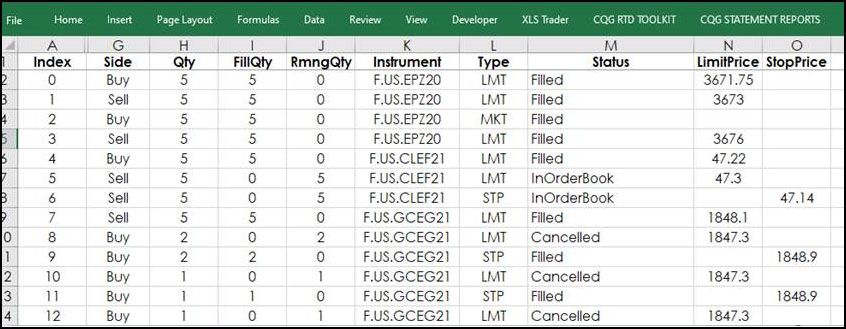
The CQG RTD Toolkit Add-in has been updated. This updated Excel add-in is automatically installed with CQG IC 21-12-8042 Beta and higher. The updates are to the Orders and Positions tabs. New… more
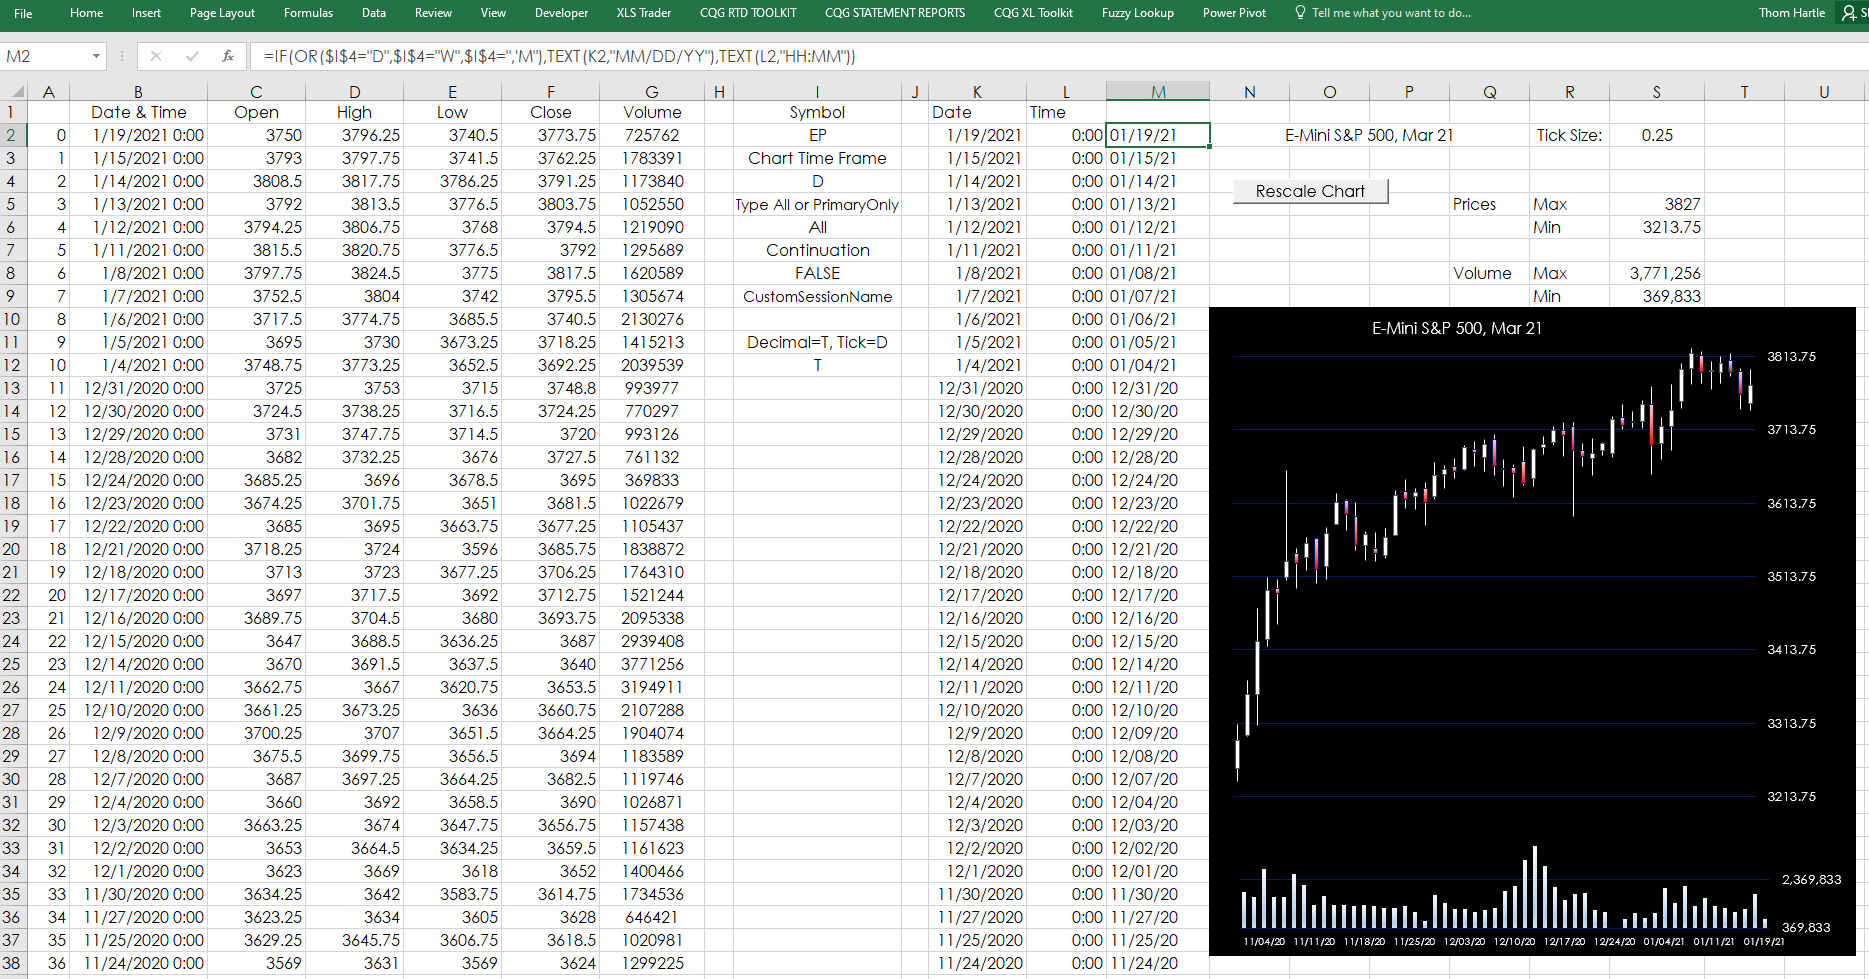
Perhaps you are pulling market data into Microsoft Excel using RTD functions from CQG and you would like to chart the data in Excel. When you setup the chart you would likely use “Auto” for the… more
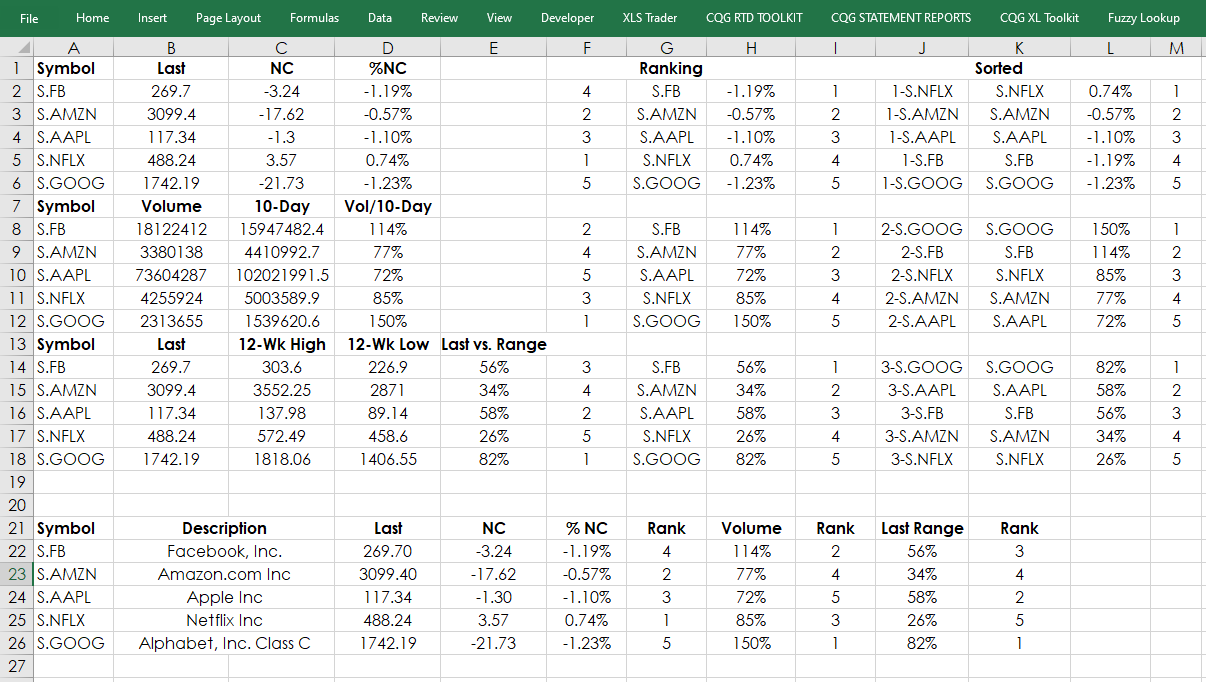
This post expands on the use of Microsoft® Excel function “CountIF.” The CountIF functions was detailed in the post “Dynamic Ranking in Excel” as a method for dealing with ties when ranking… more