
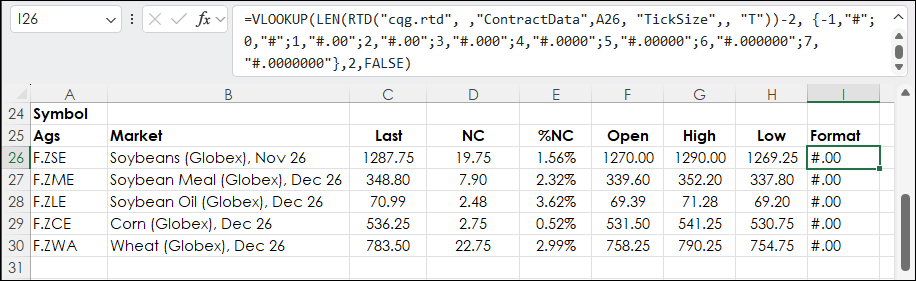
In legacy Excel if a function required the data to be returned to be an array then you had to press Ctrl + Shift + Enter following entering the function. You would see curly brackets surrounding… more
How To
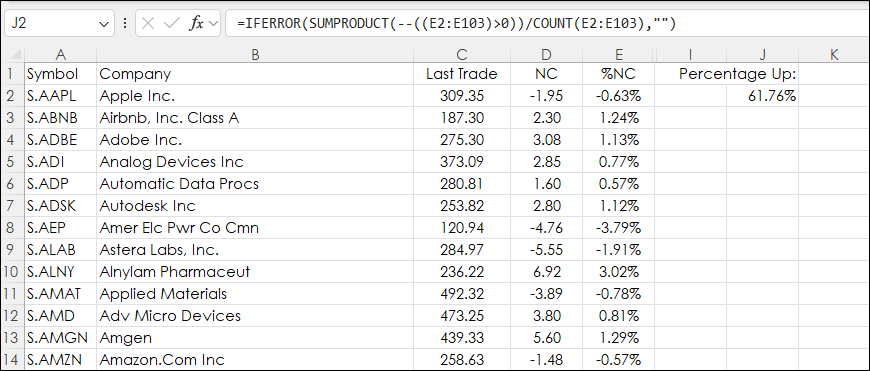
The Double Dash Operator (--) is formally known as the double unary operator. It is used in Excel to convert non-numeric data like TRUE/FALSE statements or text-based numbers into actual integers… more
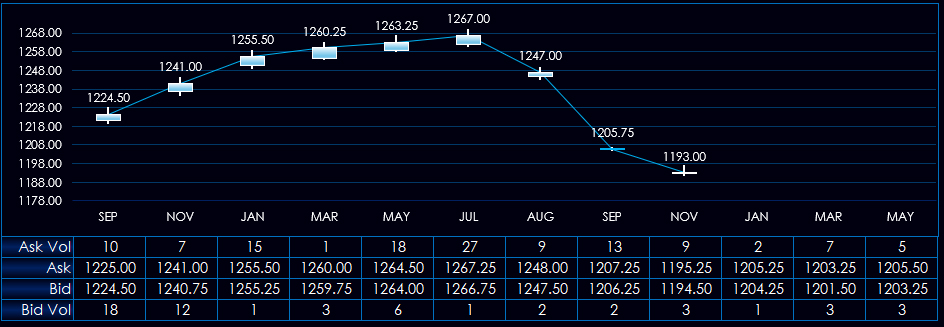
This post details a macro-enabled Excel Dashboard for monitoring Soybeans, Soybean Meal, and Soybean Oil contracts. The macro is a feature for managing the price axis on the charts. Excel may use… more
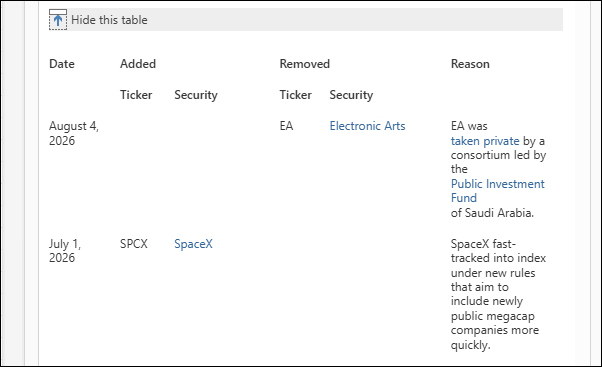
If Microsoft Excel is an app that you utilize for building market screening dashboards then you might periodically require updating the symbols used in the dashboards. For example, using an Excel… more
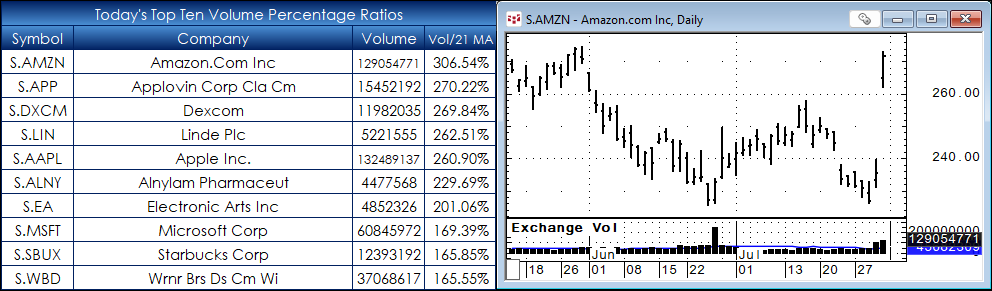
This post is another example of using Excel functions and RTD calls to screen a large portfolio. The sample dashboard tracks the holdings of the NASDAQ 100® Index (as of 8/02/2026). The screening… more
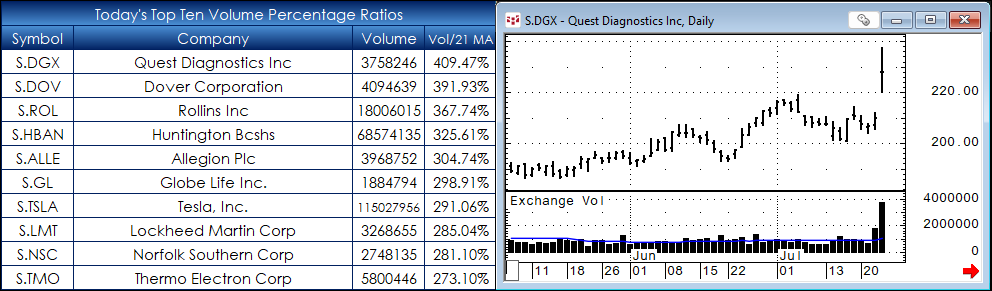
This post is another example of using Excel functions and RTD calls to screen a large portfolio. The sample dashboard is the holdings of the S&P 500® Index (as of 7/20/2026). The screening is… more
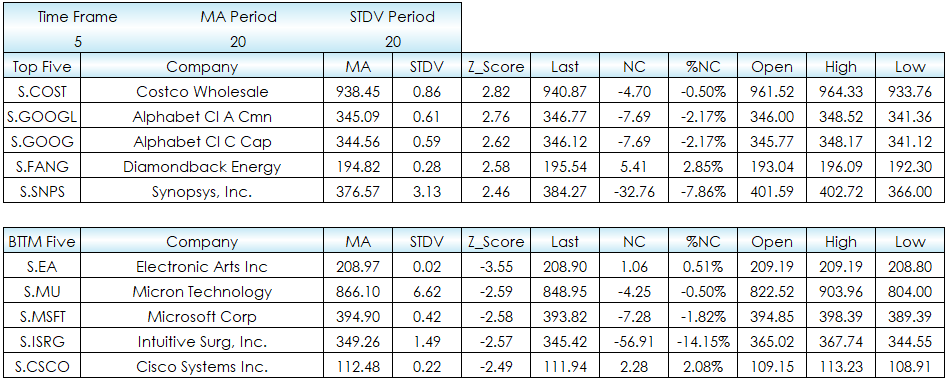
This post details an Excel dashboard for measuring the Z-Score of stocks from the NASDAQ 100. The dashboard sets the parameters as user defined inputs for the time frame, the average lookback… more
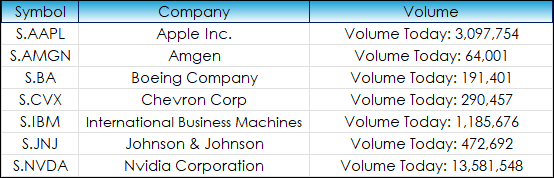
Excel has some very useful functions for screening market performance data and filtering large amounts of data to highlight particular user defined results for further analysis.
This post… more
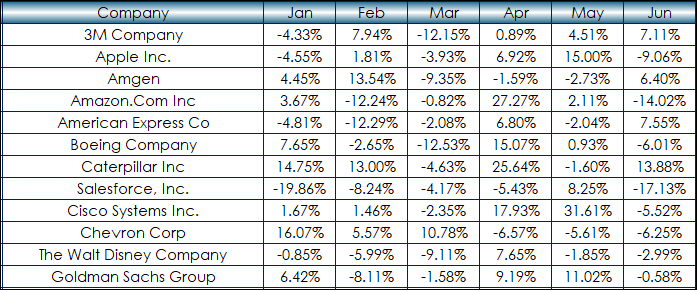
This post details using a nested XLOOKUP function to pull data from a matrix. The matrix displays the monthly percentage net change using a column for the symbols and a row for the months. The RTD… more
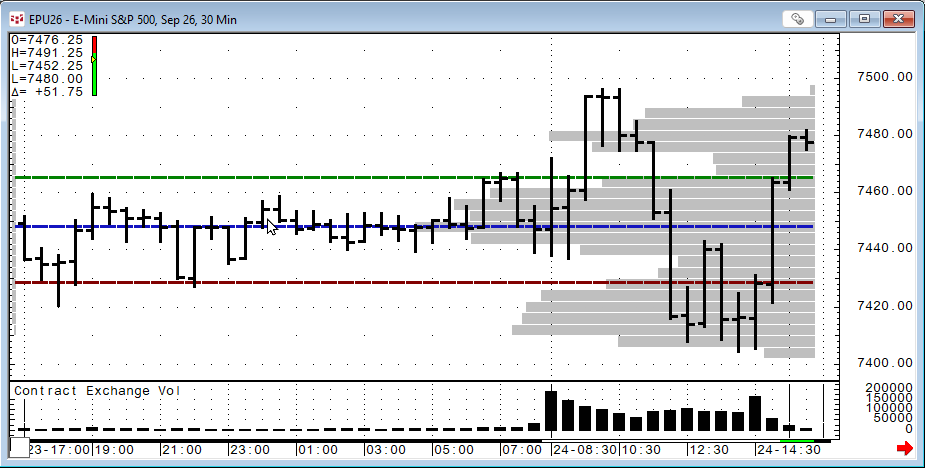
This post details the Market Profile Value Areas (MPVA) study, as well as providing a downloadable Excel sample for pulling MPVA study data into a spreadsheet.
When applied to a chart, the… more