
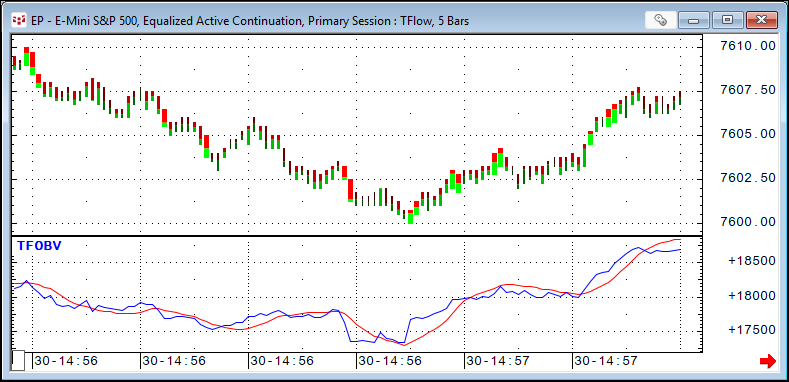
TFlow On Balance Volume is the running sum of the differences between bid and ask volume for each TFlow bar. The starting point of this sum is set via the study parameters. This study only works… more
Studies
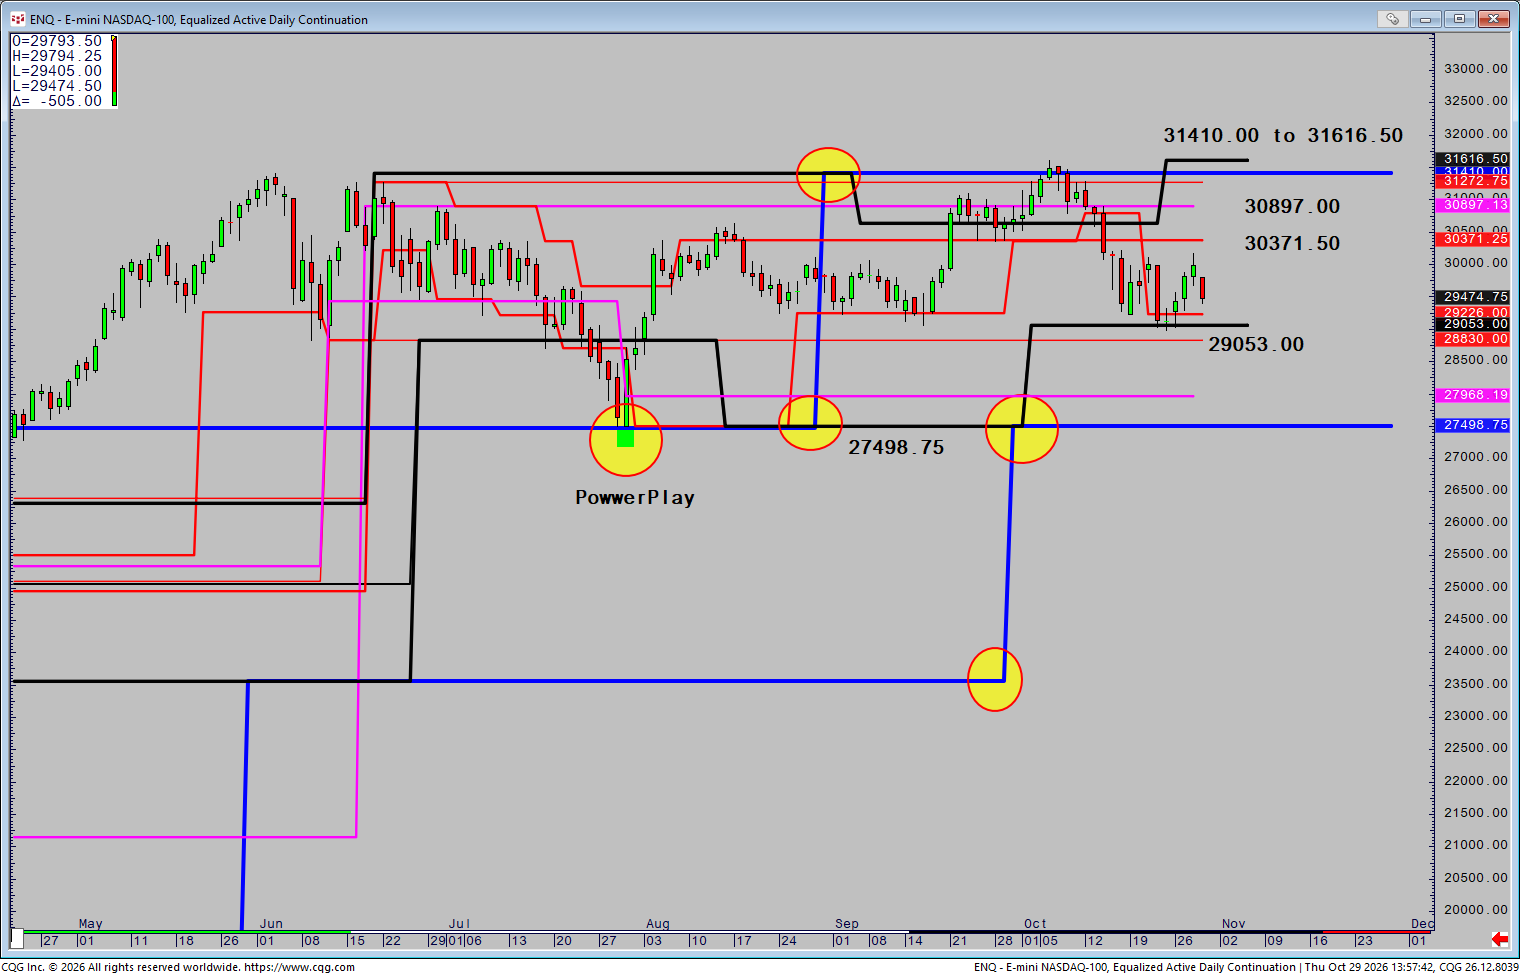
As mentioned previously, Range Deviation Pivots provide the core to other studies and patterns and is covered extensively in my first book New Methods in Technical Analysis. One of these is what… more
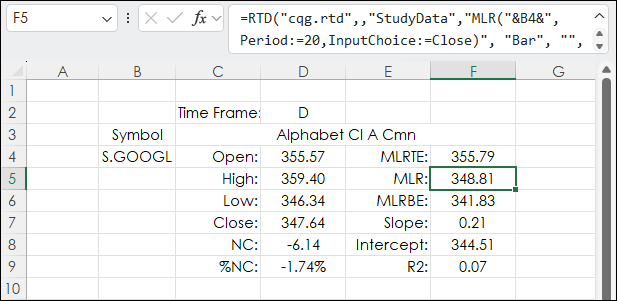
CQG offers the Moving Linear Regression Line study. When plotted on a chart the line (blue line below) is the endpoint of a best fit line using the least squares technique. This technique finds… more
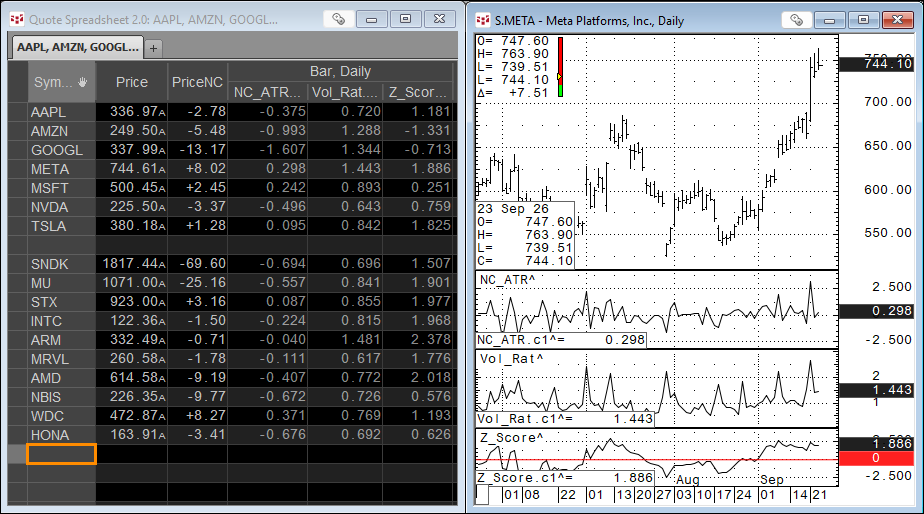
Technical studies are used to analyze markets and are often the basis for trading decisions. The studies all take market data and apply mathematical steps that result in a single value.
An… more
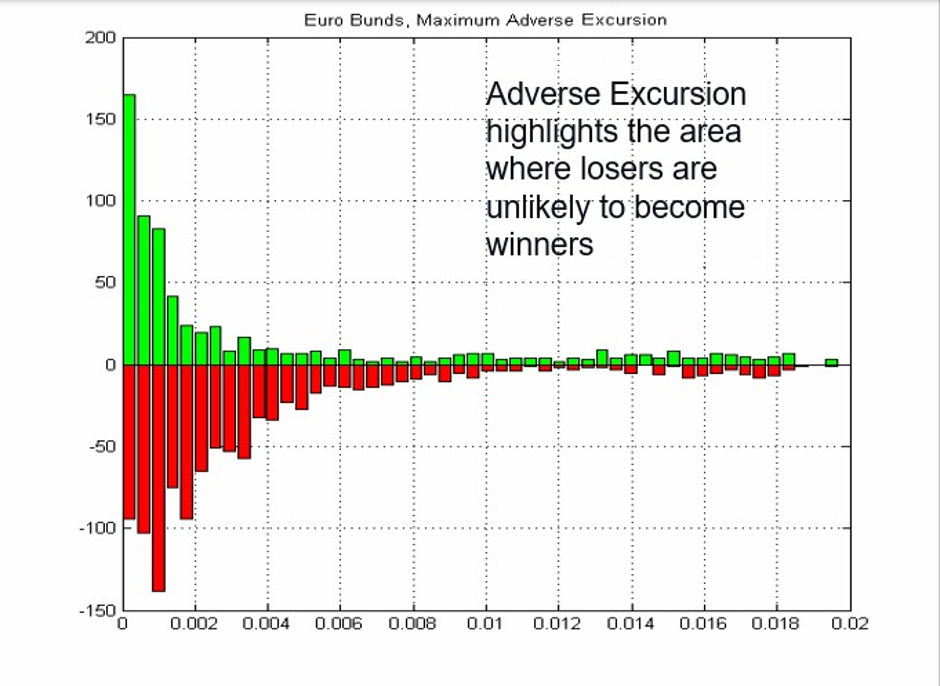
Maximum Adverse Excursion by John Sweeney is one of the few technical books that I've got something from, and I would thoroughly recommend it. Adverse excursion computes both optimum stop… more
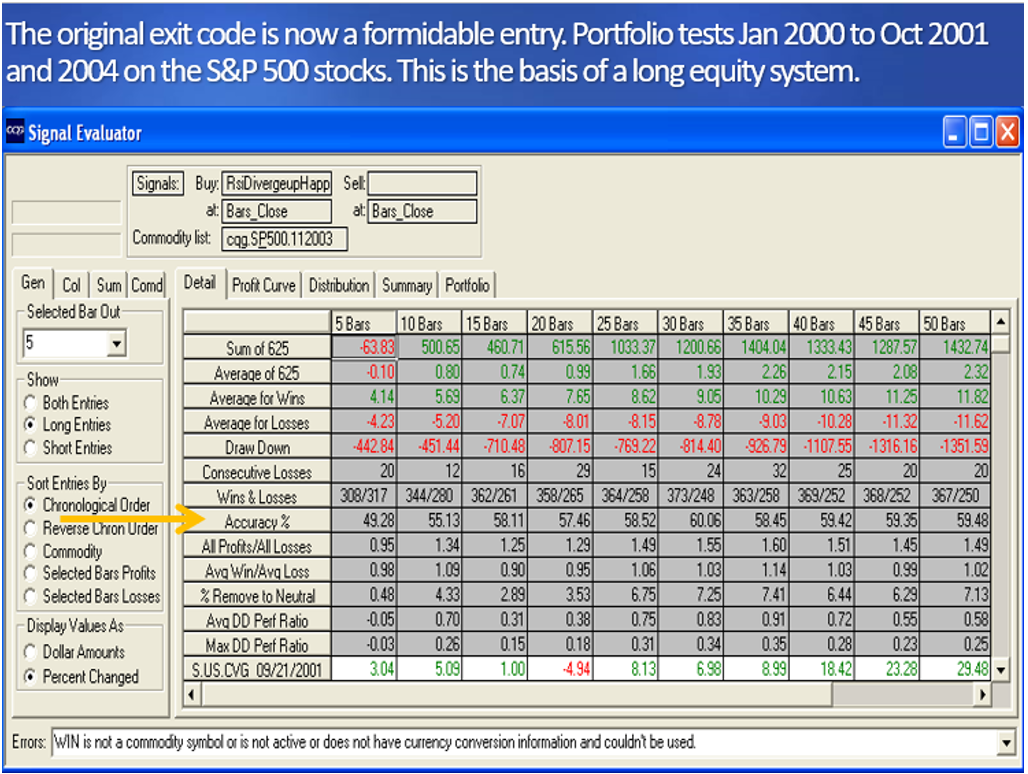
When building trading models a common error is to focus mainly on entry signals. Experience told me that exit methodology and sound money management will have far more effect on individual model… more
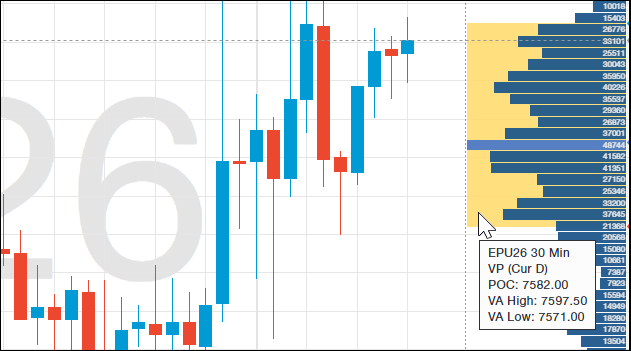
This post details CQG One's Volume Profile Study.
Once applied to a chart, the study calculates the Profile's Value Area and Point of Control (POC).
The value area begins calculating… more
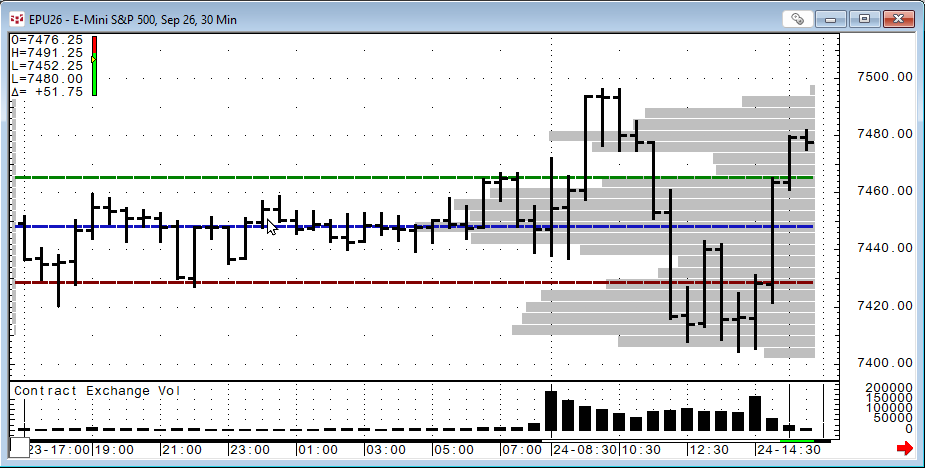
This post details the Market Profile Value Areas (MPVA) study, as well as providing a downloadable Excel sample for pulling MPVA study data into a spreadsheet.
When applied to a chart, the… more
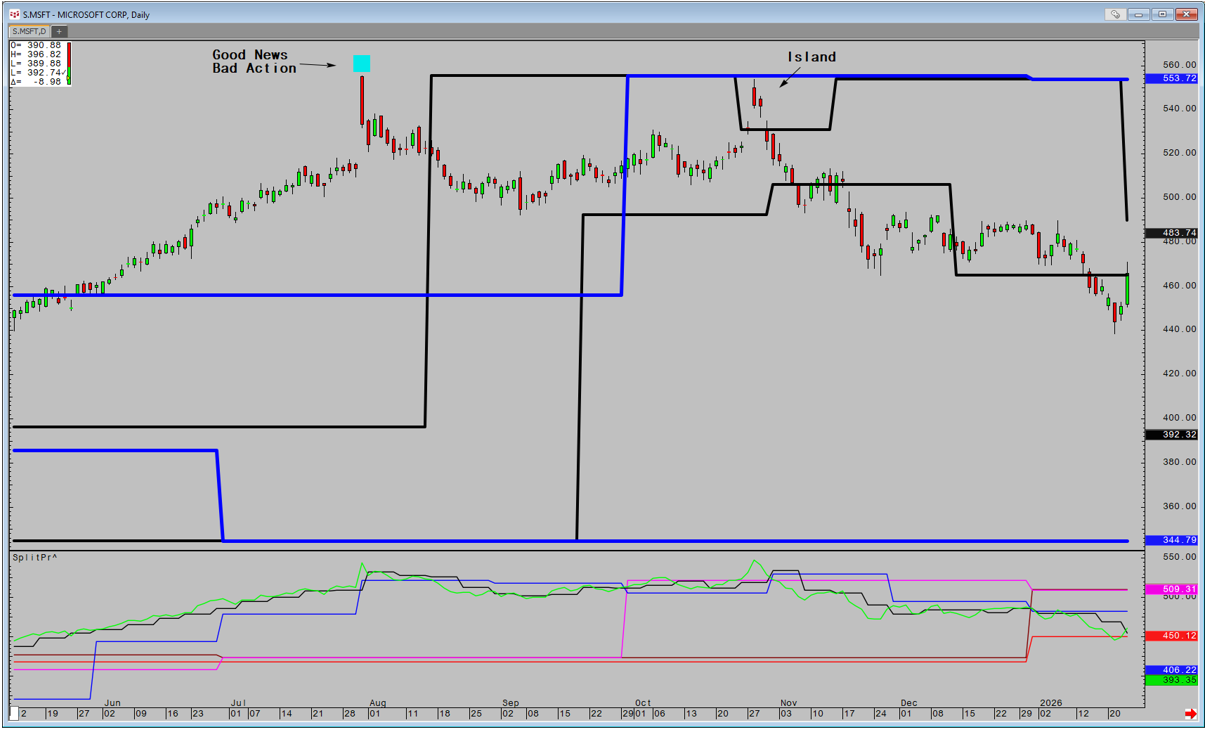
The switch from my haven of Futures and Fx, to the world on USA equities and ETF's to run a Hedge Fund, presented a new set of challenges. My world had moved from 80 instruments to focus on to… more
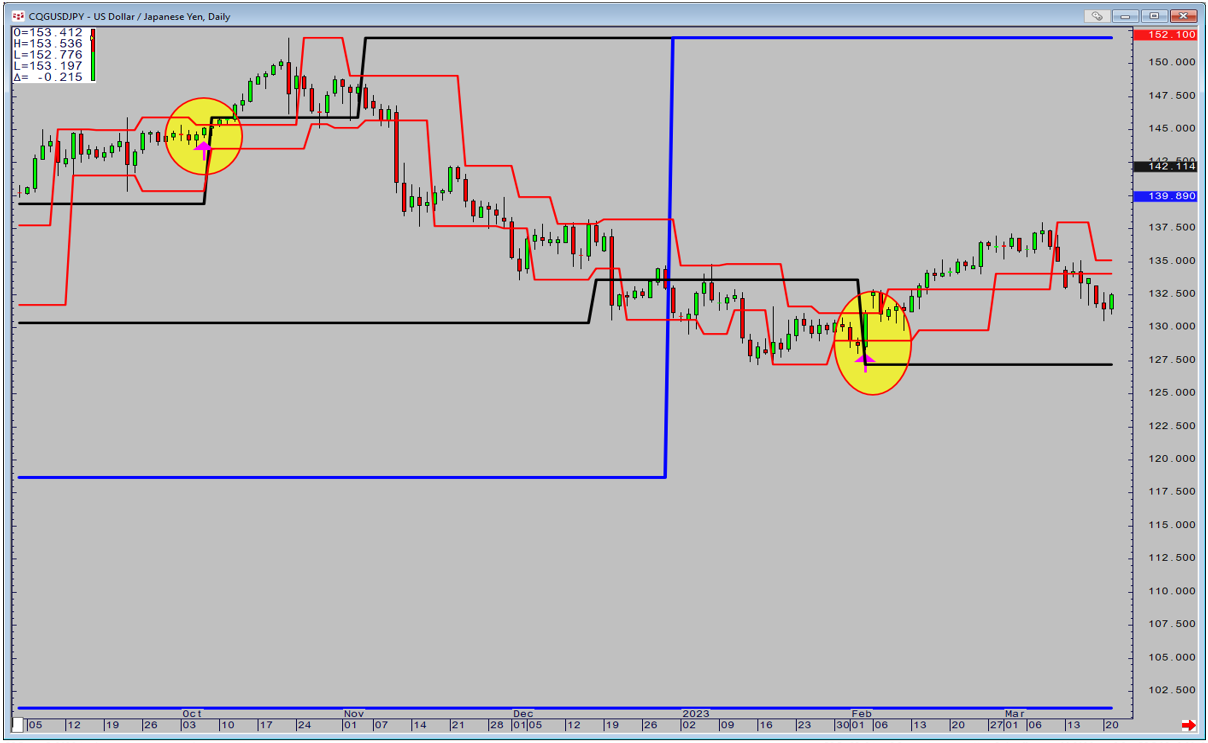
Read Quantifying Divergence Part 1Read Quantifying Divergence Part 2
Traditionally, divergence is quantified by taking the relationship between the high in an uptrend and low in a downtrend and… more