
This midweek snapshot shows a predominantly positive performance for the Equity Index futures markets. The best performer in the Japanese market is the Nikkei 225 (Osaka), Jun 24 contract… more
Thom Hartle
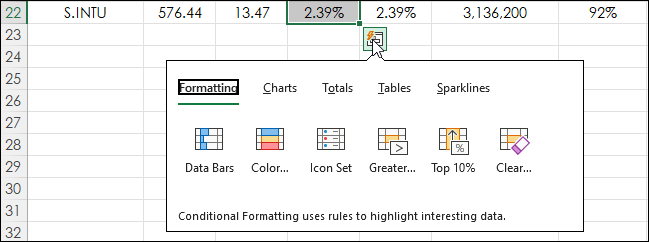
This post introduces using Excel's Quick Analysis Tool. First, a walkthrough of a typical application of one of Excel's data visualization features (heatmapping). In the image below heatmapping… more

This midweek snapshot shows a predominantly negative performance for the Equity Index futures markets. The best performer in the Japanese market is the TOPIX, Jun 24 with a -0.58% loss. The… more
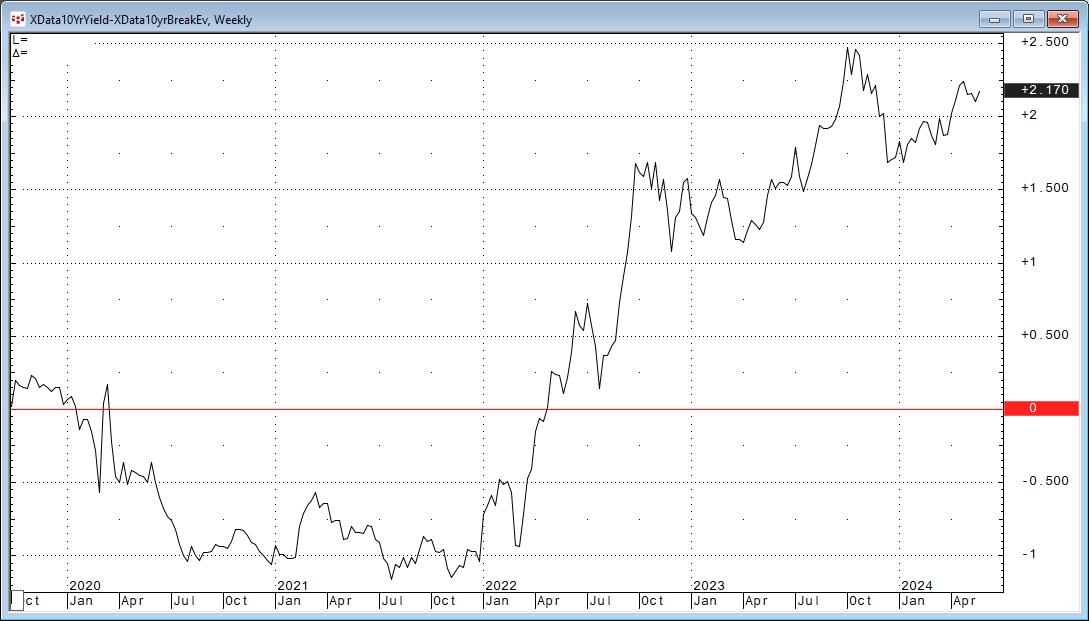
This post offers two topics: An introduction to the website FRED (Federal Reserve Economic Data) maintained by the Federal Reserve Bank of St. Louis and CQG's XData functionality, which is the… more
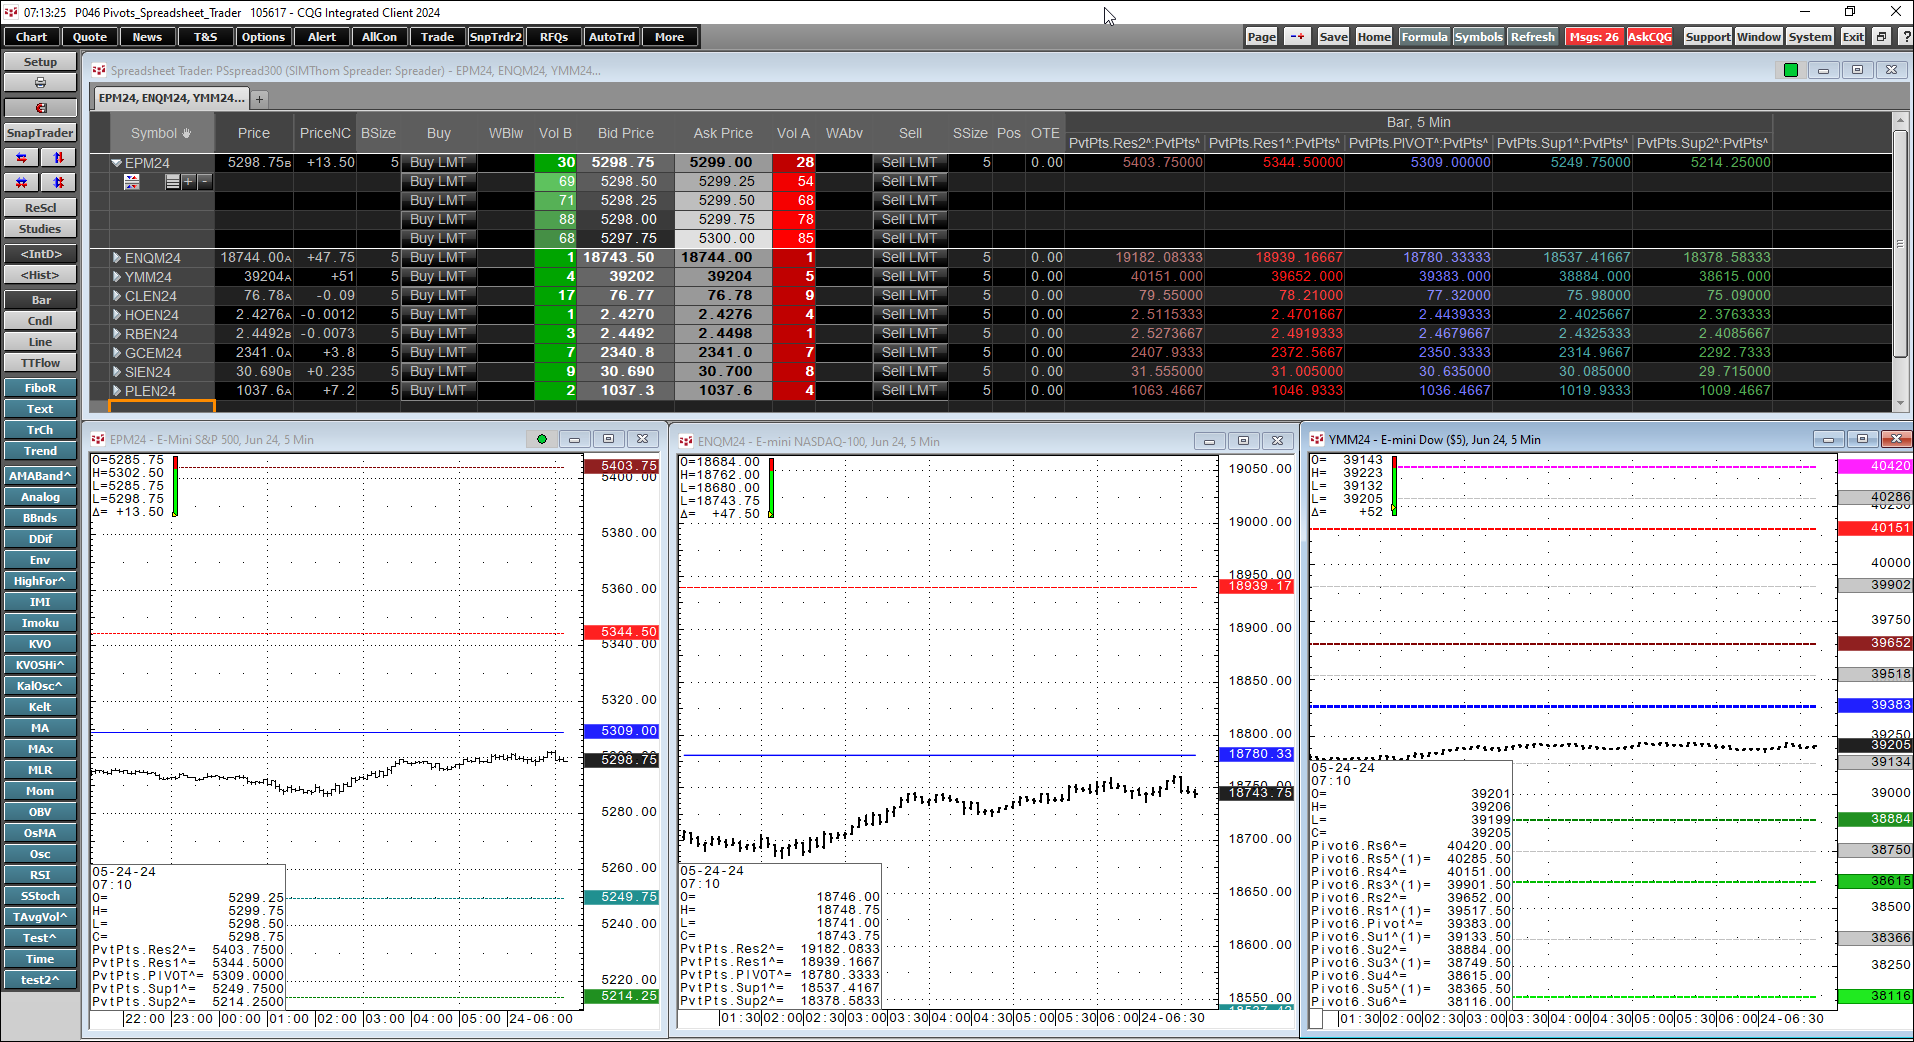
The pivot point is the arithmetic average of the high (H), low (L), and closing (C) prices of the active instrument, Pivot Point = (H+L+C)/3 or Pivot Point = HLC3. The study applied to a chart… more
This midweek snapshot shows a negative performance for most of the Equity Index futures markets. The best performer in the Japanese market is the JPX Prime 150 Index, Jun 24 with a -0.29%… more
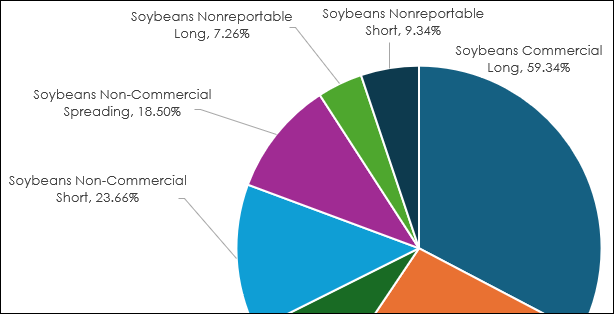
Pie charts are a popular visual presentation used by analysts for detailing a percentage of a whole, with a circle representing the whole and slices representing the categories that make up the… more
This midweek snapshot shows a positive performance for the Equity futures markets. The best performer in the Japanese market is the Nikkei 225 (Osaka), Jun 24 with a +1.23% gain following… more
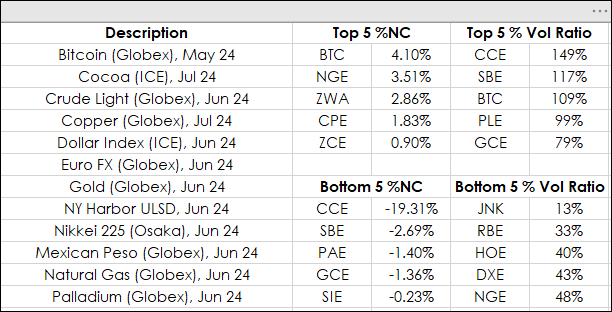
This post presents "how to" rank and sort market data using Excel's SORTBY, CHOOSECOLS, and TAKE functions. This method is a replacement for applying RANK and VLOOKUP functions for ranking and… more
This midweek snapshot shows a mixed performance for the Equity futures markets. The best performer in the Japanese market is the Nikkei 225 with a +0.60% gain following last week’s +0.77%… more