This post details the Market Profile Value Areas (MPVA) study, as well as providing a downloadable Excel sample for pulling MPVA study data into a spreadsheet.
When applied to a chart, the… more

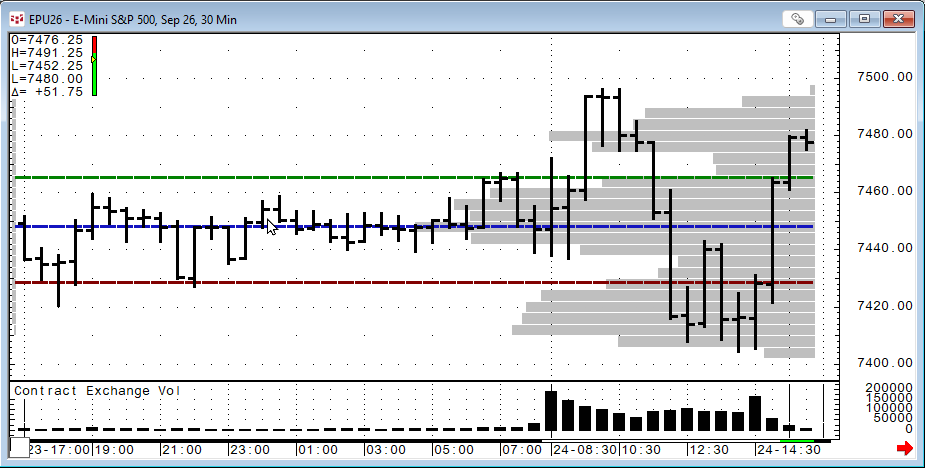
This post details the Market Profile Value Areas (MPVA) study, as well as providing a downloadable Excel sample for pulling MPVA study data into a spreadsheet.
When applied to a chart, the… more

This midweek look shows the Nikkei 225 (Osaka), Sep 26 contract, with a loss of -3.55%. The best performer in the US market is the E-mini Dow, Sep 26 contract showing a gain of +0.38%. The… more
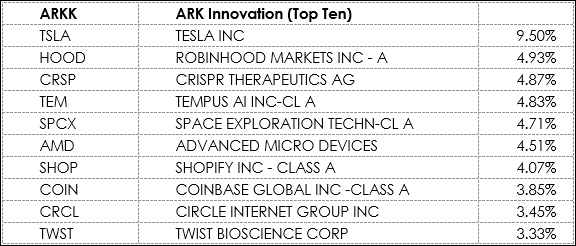
On Workspaces there are four Excel Dashboard for tracking the current session’s performance of four ARK ETFs. The four ETFs added the recent SpaceX IPO: Space Exploration Technologies Corp. Class… more
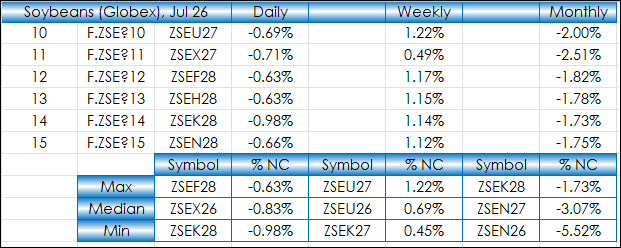
This post walks through using Excel's XLOOKUP with Min, Median, and Max Functions to create a summary table of market performance for the forward curves of Soybeans, Soybean Meal, Soybean Oil,… more
This midweek look shows the Nikkei 225 (Osaka), Sep 26 contract, with a gain of +6.90%. The best performer in the US market is the E-mini Dow, Sep 26 contract showing a gain of +1.78%. The… more
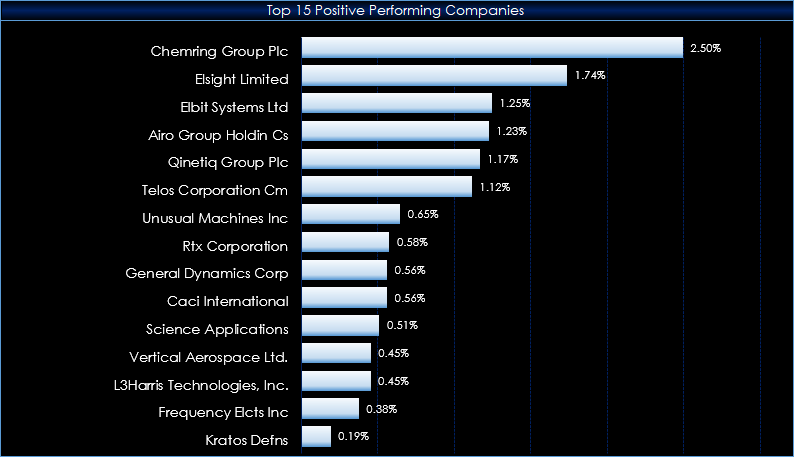
This Excel Dashboard tracks the holdings of the Defiance Drone & Modern Warfare ETF.
From their Web Site:
Modern defense is being reshaped by drones, autonomous systems, and AI-… more
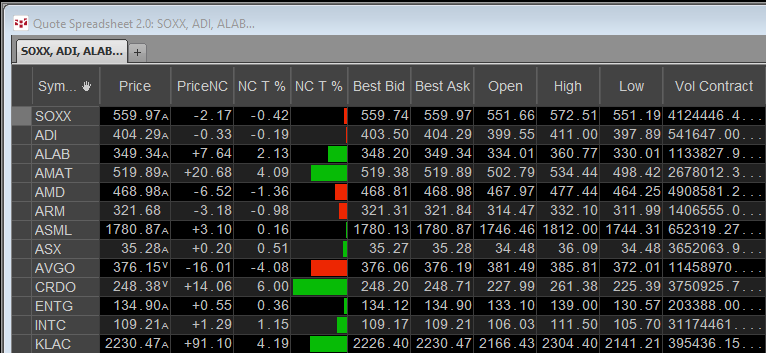
From their website:
The iShares Semiconductor ETF seeks to track an U.S. equity index of companies in the semiconductor sector. The fund offers a way to invest in companies across the… more
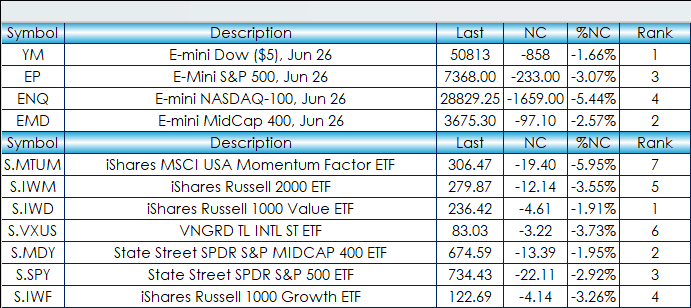
This midweek look shows the Nikkei 225 (Osaka), Jun 26 contract, with a loss of -4.72%. The best performer in the US market is the E-mini Midcap, Jun 26 contract showing a gain of -0.23%.… more
This post offers a sample spreadsheet with typical RTD formulas used for building a market quotes dashboard. You can download the dashboard and enter in symbols. All capital letters are required.… more
This midweek look shows the Nikkei 225 (Osaka), Jun 26 contract, with a gain of +2.89%. The best performer in the US market is the E-mini NASDAQ 100, Jun 26 contract showing a gain of +0.80… more