
This post details CQG One's Volume Profile Study.
Once applied to a chart, the study calculates the Profile's Value Area and Point of Control (POC).
The value area begins calculating at the POC. The system expands the value area one price at a time in either direction until the value area represents 70% of the TPOs (Time Price Opportunities, which is the traded volume for the session at that price).
In the image below the Value area is highlighted in yellow. The histogram bars display the total traded volume at each price. The actual total volume can be displayed next to the vertical axis.
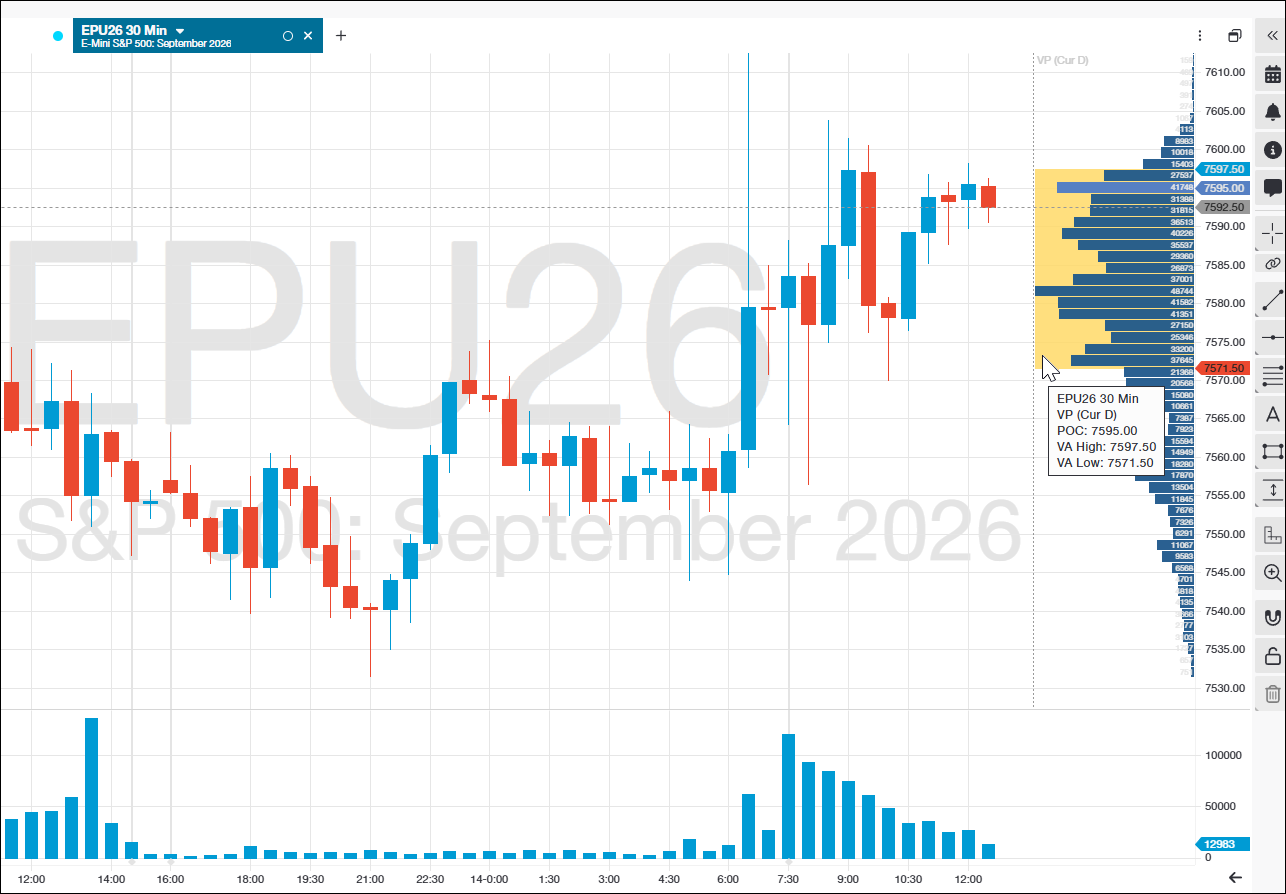
The POC is the price level where the most trading occurred during the session.
The study has the following Setup Study Parameters.
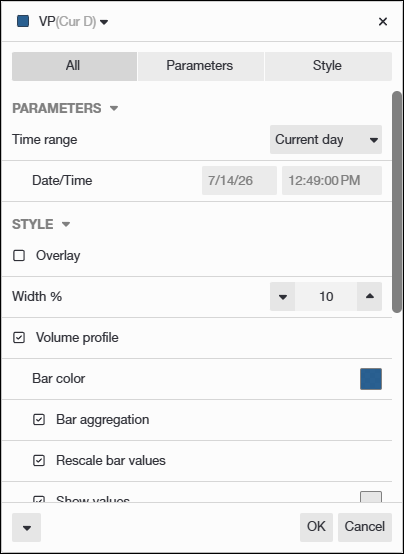
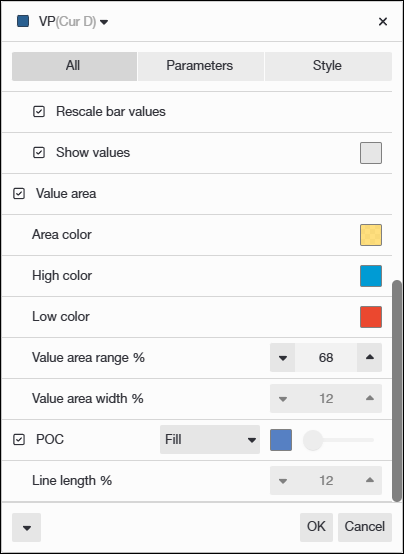
Regarding setting the Time Range, there are three choices: Current day, Current Session or Custom date and time. Other settings include setting colors, selecting the Value Area range, and setting the color of the POC.
Market Profile is essentially an auction-market framework. The POC tells you where the auction was most successful, and the Value Area tells you where most participants agreed on value.
A general guideline for using this study:
- VP POC = Fair price
- Value Area (VA) = Fair value range
- Above VA High = Potentially expensive
- Below VA Low = Potentially cheap
A possible approach could be to use an oscillator to signal a reversal if the current price is above the VA High or below the VA Low.
Requires CQG One.