This midweek look shows the Nikkei 225 (Osaka), Sep 26 contract, with a gain of +3.97%. The best performer in the US market is the E-mini NASDAQ 100, Sep 26 contract showing a gain of +1.67… more
Thom Hartle
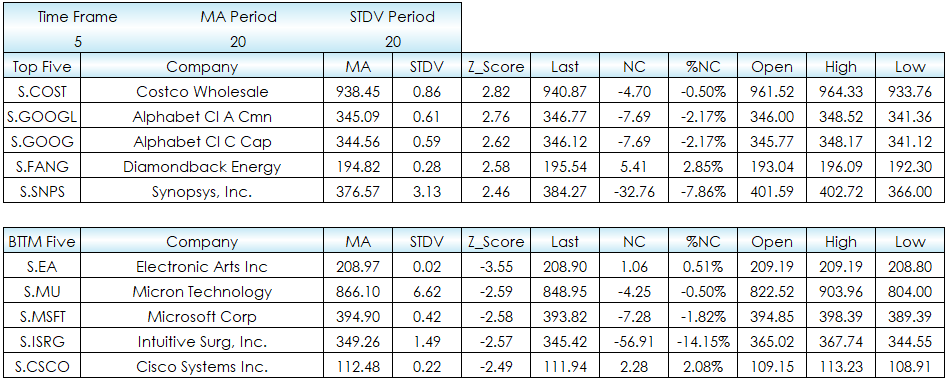
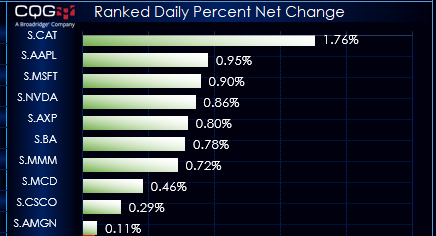
This post details an Excel dashboard for measuring the Z-Score of stocks from the NASDAQ 100. The dashboard sets the parameters as user defined inputs for the time frame, the average lookback… more
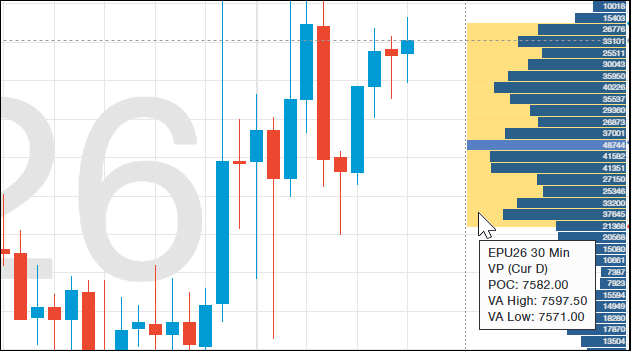
This post details CQG One's Volume Profile Study.
Once applied to a chart, the study calculates the Profile's Value Area and Point of Control (POC).
The value area begins calculating… more

This midweek look shows the Nikkei 225 (Osaka), Sep 26 contract, with a loss of -1.48%. The best performer in the US market is the E-mini Dow, Sep 26 contract showing a gain of +0.02%. The… more
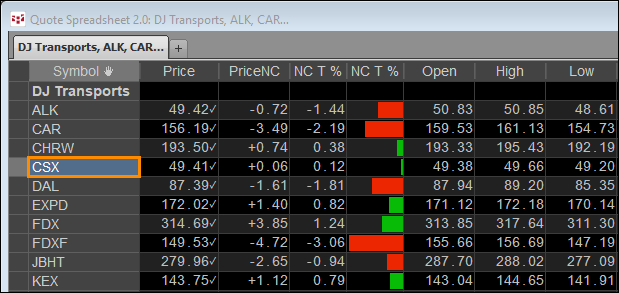
This post offers a downloadable CQG PAC for installing the DJT and DJU Page in CQG IC or QTrader. The page details the current session's market performance of the constituents of the two averages… more
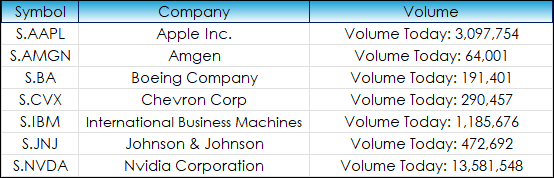
Excel has some very useful functions for screening market performance data and filtering large amounts of data to highlight particular user defined results for further analysis.
This post… more
This midweek look shows the Nikkei 225 (Osaka), Sep 26 contract, with a loss of -3.48%. The best performer in the US market is the E-mini S&P 500, Sep 26 contract showing a loss of -0.… more
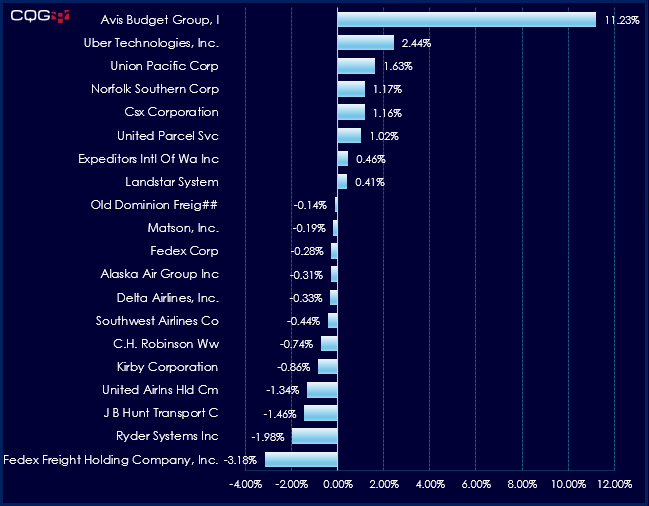
This post offers a downloadable Excel Dashboard that details the current session's market performance of the constituents of the two averages.
The top block of the dashboard is the Dow Jones… more
This midweek look shows the Nikkei 225 (Osaka), Sep 26 contract, with a gain of +0.14%. The best performer in the US market is the NASDAQ 100, Sep 26 contract showing a gain of +2.62%. The… more
Updated 06/30/2026 to add ALPHABET CL A CMN (Symbol: S.GOOGL) and remove Verizon Communications (Symbol: S.VZ)
This Microsoft Excel® spreadsheet tracks the constituents of the DJIA Index (… more