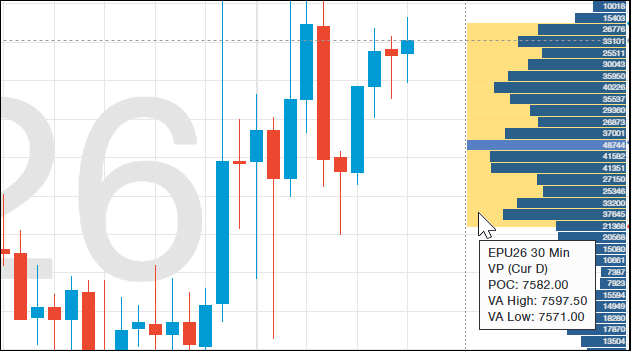
This post details CQG One's Volume Profile Study.
Once applied to a chart, the study calculates the Profile's Value Area and Point of Control (POC).
The value area begins calculating… more
This post details CQG One's Volume Profile Study.
Once applied to a chart, the study calculates the Profile's Value Area and Point of Control (POC).
The value area begins calculating… more
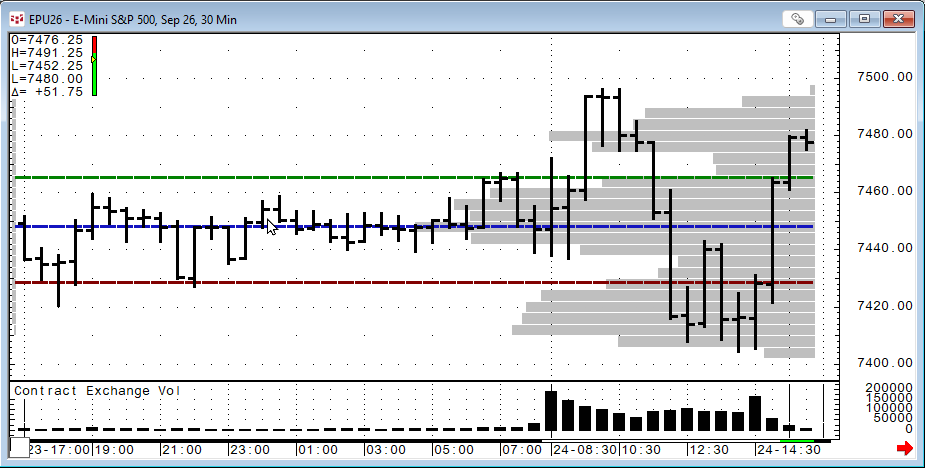
This post details the Market Profile Value Areas (MPVA) study, as well as providing a downloadable Excel sample for pulling MPVA study data into a spreadsheet.
When applied to a chart, the… more
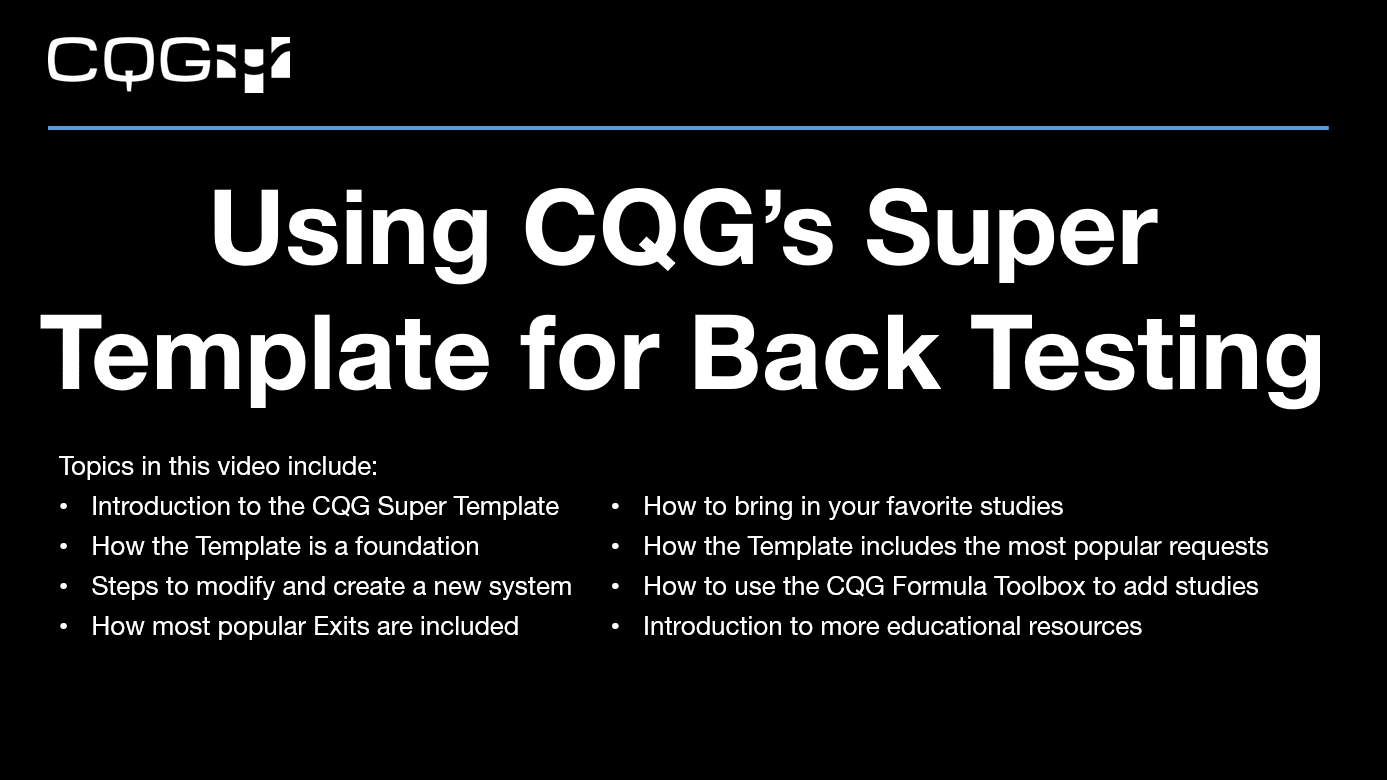
This video, presented by CQG Product Specialist Helmut Mueller, walks you through using his Super Template for developing and testing a trading system.
The Super Template is installed in CQG… more
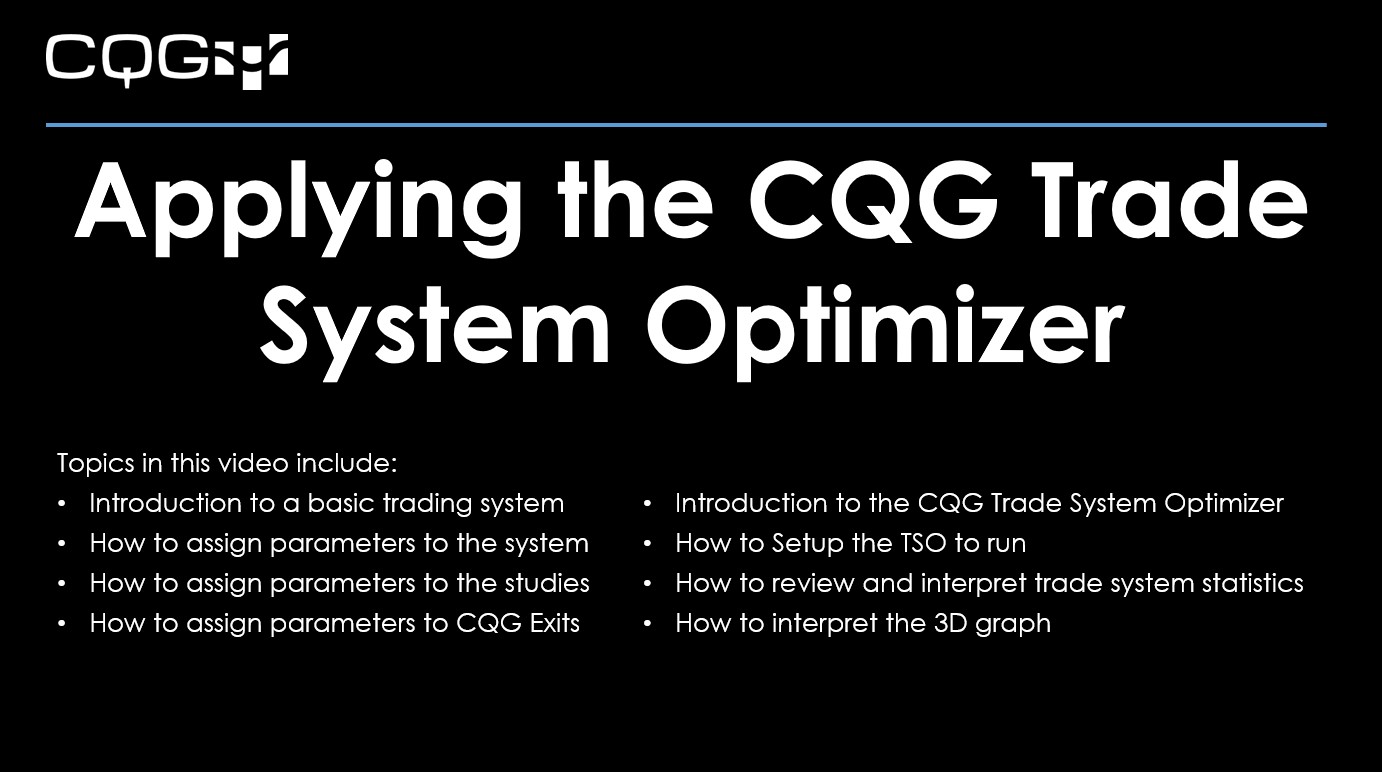
This video, presented by CQG Product Specialist Helmut Mueller, walks you through applying the CQG Trade System Optimizer (TSO) to a basic system programmed in CQG IC. This video is a follow up to… more
This video walks you through the basic steps to building your first trading system in CQG IC.
For best viewing, click "Watch on YouTube" and then full screen.
Topics in this video… more
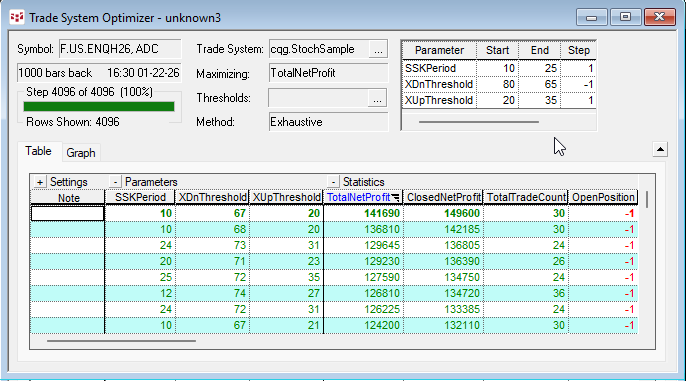
The CQG Trade System Optimizer (TSO) is a module that offers you a tool for testing different parameters of a trade systems and cataloging the results. All combinations of the parameters are… more
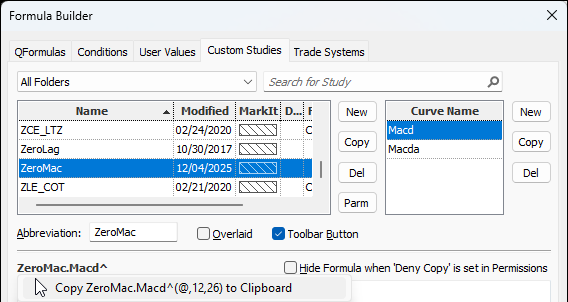
This post details the steps to pulling custom study values into Excel using RTD formulas. First, an overview of RTD formulas and parameters.
When CQG IC or QTrader are installed, a DLL… more
John Ehlers developed the Ultimate Smoother study. https://www.mesasoftware.com/TechnicalArticles.htm The study is a two-pole low-pass digital filter designed to smooth price data while… more
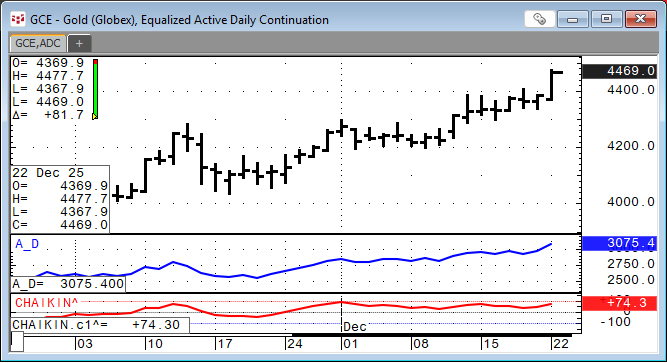
Developed by Marc Chaikin, the Chaikin Oscillator is a technical analysis tool traders and investors use to confirm trends and indicate possible trend reversals. The oscillator uses the… more
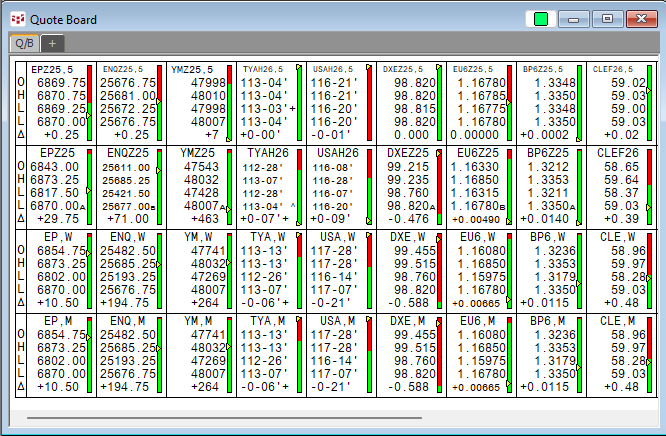
The CQG Quote Board is a classic quote display providing the open, high, low, last, and net change from the prior close.
One feature unique to the CQG Quote Board is a symbol entered… more