Overview
CQG Signal Evaluator (SigEval) allows you to quickly assess the validity of a trading signal before spending valuable time creating fully-fledged trading systems that may be based on invalid signals.
The module takes in any technical condition (e.g., a buy or a sell signal) and evaluates its performance against historical market data. Its analytical and graphical outputs allow you to evaluate your ideas' profit potential, identify presence of any statistical bias, and assist in deciding whether the results fit your trading horizon and risk parameters. SigEval does not include any risk management or trade execution considerations; it simply gives you a view into the best and worst case scenarios over the selected time horizon.
Example
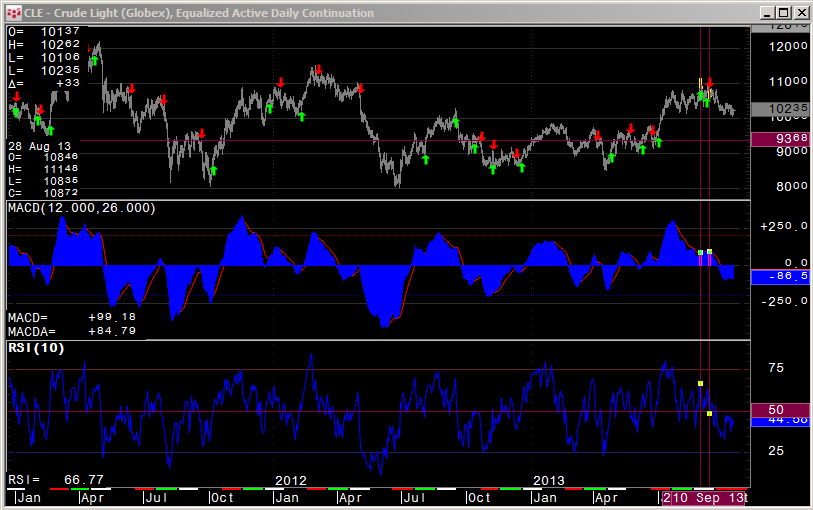
In the example here, we will test the quality of SigEval_Buy and SigEval_Sell conditions on Crude Light (CLE) daily continuation data between January 1, 2008 and August 31, 2013. In the chart below, we plot buy and sell signals denoted in green (buy) and red (sell). We are testing the conditions that would generate:
- a long signal when MACD(12, 26) Xabove MACDA(12, 26, 9) and if RSI(10) > 50 and,
- a short signal when MACD(12, 26) Xbelow MACDA(12, 26, 9) and if RSI(10) 50.
Configuring Parameters
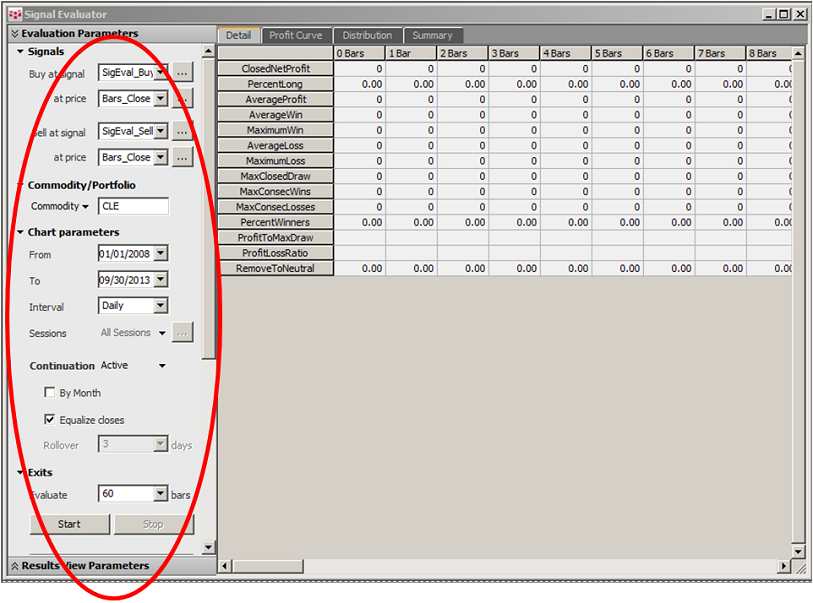
Once the input parameters (buy/sell signal, time frame, time interval, continuation preferences, and position holding period) are specified on the Evaluation Parameters window (see below), you can activate the analysis by clicking the Start button. The results are displayed on the Details, Profit Curve, Distribution, and Summary tabs at the top of the window. You can further fine-tune the results by varying the output parameters and analytics available in the Results View Parameters window. (For a detailed definition of the analytics, please refer to the online help at http://help.cqg.com/cqgic/).
Interpreting Results
The top of the Details tab shows summary statistics for the entire trading period, if each of the positions were held up to sixty bars after the long and short positions were entered. You can select which analytics you wish to see on the left panel of the Results Window Parameters window. The bottom of the Details tab shows net profit/loss for each individual position that was generated. Blue rows indicate short positions; white rows are longs. Clicking the row names brings up either a summary chart for the selected analytic or a bar chart showing the selected positions' initiation and holding period.
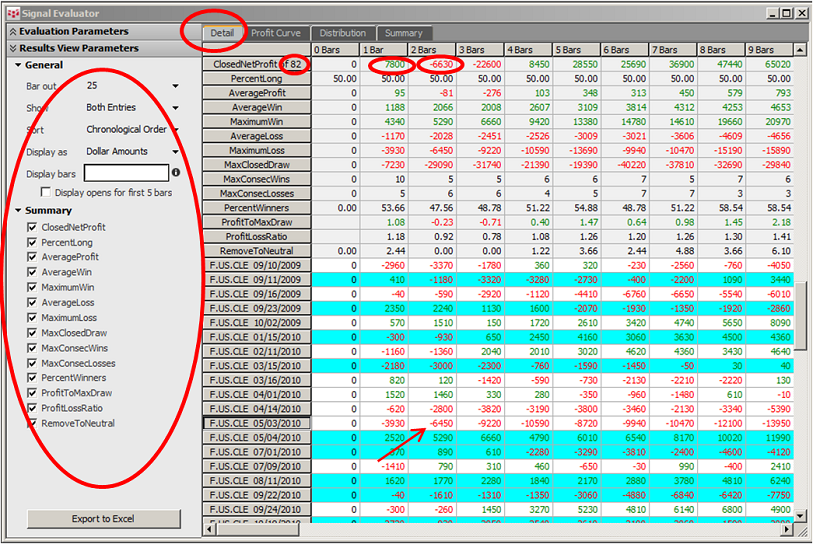
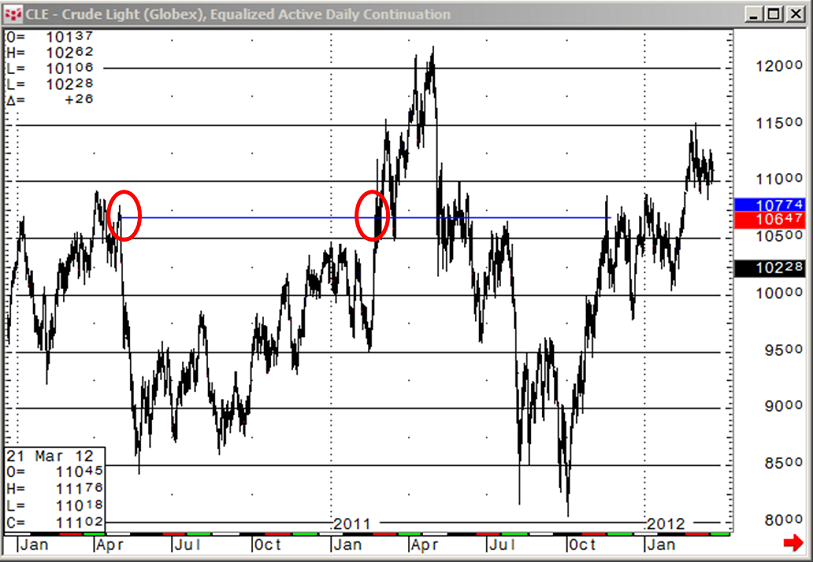
For example, from the table above we can see that the signal generated a total of eighty-two positions with the closed net profit of $7800 at the end of the first bar and a loss of $6630 at the end of the second bar. Maximum loss of $6450 for this holding period was generated by a long position on May 3, 2010. By clicking the chart for that position, we observe immediately after the position was entered a dramatic sell-off that did not recover until February 2011.
Key Metrics
The Summary tab displays dynamics of the selected analytic over the entire holding period. This tab gives you an initial indication of the optimal holding period for the strategy and its potential stability. In our example, we chose to look at the performance of the signals up to sixty bars into the future. We observe several CloseNetProfit peaks at nine, twenty-one, and forty-seven bars out, with sharp drops into negative territories in between. This may suggest that the signal is fairly sensitive to the holding period.
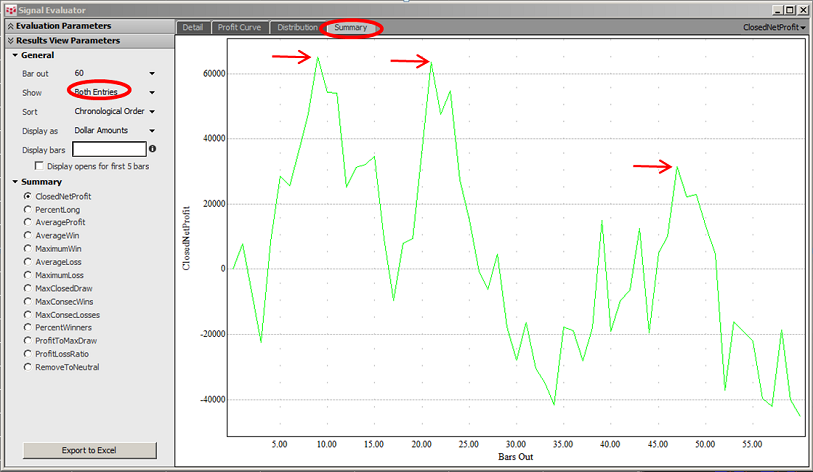
You can further investigate whether the results were driven by long or short positions by viewing them separately. In the example here, we can see that the shorts were leading in performance relative to the long positions. In fact, the nine-bars-out peak was driven by the shorts, while the twenty-one-bars-out peak was driven by the longs. We want to see profitable excursion out of the gate, which is not consistent for the signals in this example. A drawdown within the first three bars suggests that the entry signals may be generated too early.

You should carefully analyze all available statistics provided in the module; however, we would like to single out two of them: Percent Winners and Maximum Consecutive Losses. Percent Winners calculates the proportion of winning trades for a particular holding period. For the signal to have any promising value, the target value should be close to 55%. Values in the range of 45% - 49% would indicate that the signal is largely random and that net profits resulting from it cannot be statistically significant. Similarly, values higher than 75% would indicate model over-fitting or some error in the code. While Percent Winners values for both nine- and twenty-one-day holding periods are fairly high, 58.5% and 56%, respectively, the value does not appear to be particularly stable. Further backtesting would be required to determine sensitivity of the signal to the holding period. You should also make sure the average profit per trade is large enough to cover the cost of doing business.

The Maximum Consecutive Losses metric gives a maximum count of losing trades in a row for a specific holding period. This measure provides a first look at whether the signal fits into your risk profile. Depending on personal and financial risk preferences and constraints, you may accept any number of losing trades in a row. A more risky trader may tolerate up to ten losing trades in a row if a total number of expected trades is sufficiently large (e.g., 100 trades), resulting in a 10% losing trades streak. Less risky traders may only tolerate three to five losing trades in a row, setting the limit of losing trades at 5% of the total number of trades. For the signals in this example, a tolerable limit for a moderately risky trader would be three to four losing trades in a row. Again, holding periods of nine and twenty-one days would meet this restriction.

Profit Curve and Distribution Analysis
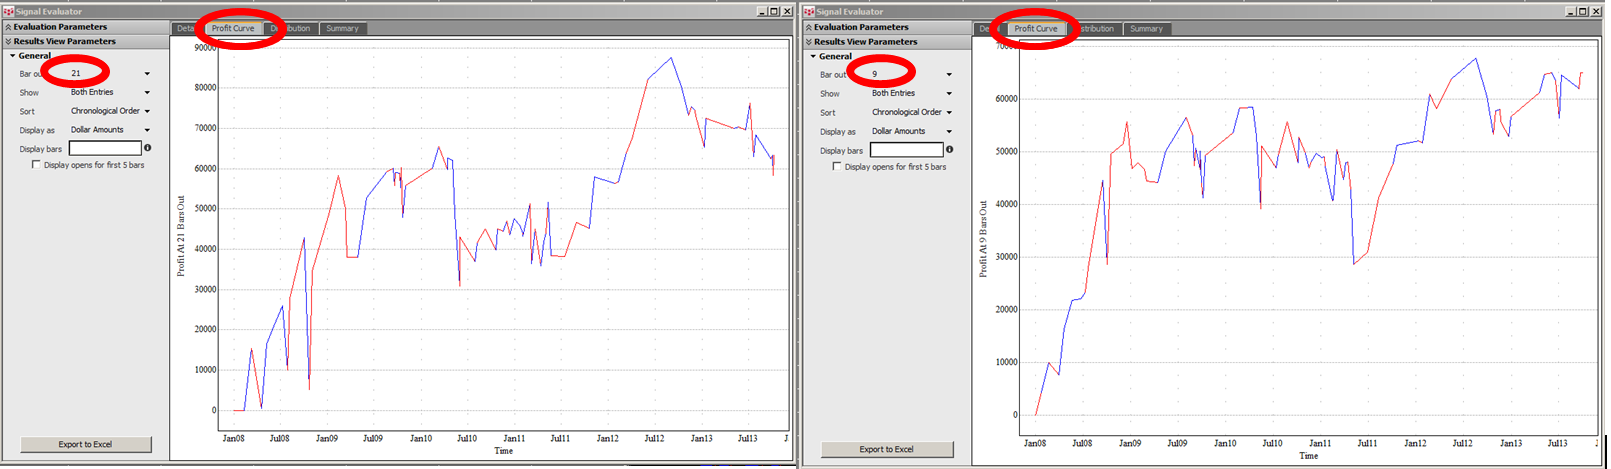
The Profit Curve tab shows dynamics of profits over time. These dynamics are conditional on the preselected holding period. Blue portions of the curve denote longs, while red portions denote shorts. Selecting a holding period of twenty-one bars shows strongly positive profits over the entire trading period, peaking near $87,500 in September 2012 and settling around $60,000 in September 2013. Similar favorable dynamics can be observed for the nine-day holding period with a slightly more consistent positive trajectory. It should be informative to analyze profit trajectories for the short and long signals separately and put the performance in the context of past market events to check for consistency.
The Distribution tab shows profit/loss distribution for the selected holding period (bars out). Blue bars denote long positions, and red bars denote short positions. You should be looking for a fairly tight and balanced bell curve with only few outliers on either side of the distribution and a positive skew. The chart should give you a good read into the bias of the results due to outliers or due to asymmetrical performance of longs vs. shorts.
Comparing nine- and twenty-one-bars-out holding periods, we observe that the nine-bars-out distribution is tighter than the twenty-one-bars-out distribution, with smaller magnitude outliers. Performance does not appear to be dominated by a few positive or negative trades, but appears to be consistent across the range of values between +/- $10000 per trade.

Summary
Based on SigEval's analysis, we would conclude that the signal is promising enough to continue with the research into incorporating the signal into a trading system with backtesting. The analysis gives us an early preview into some of the parameters we may want to look into further such as holding period and risk-reducing parameters. Finally, you have the option to output the results into Microsoft Excel® for further analysis and research.