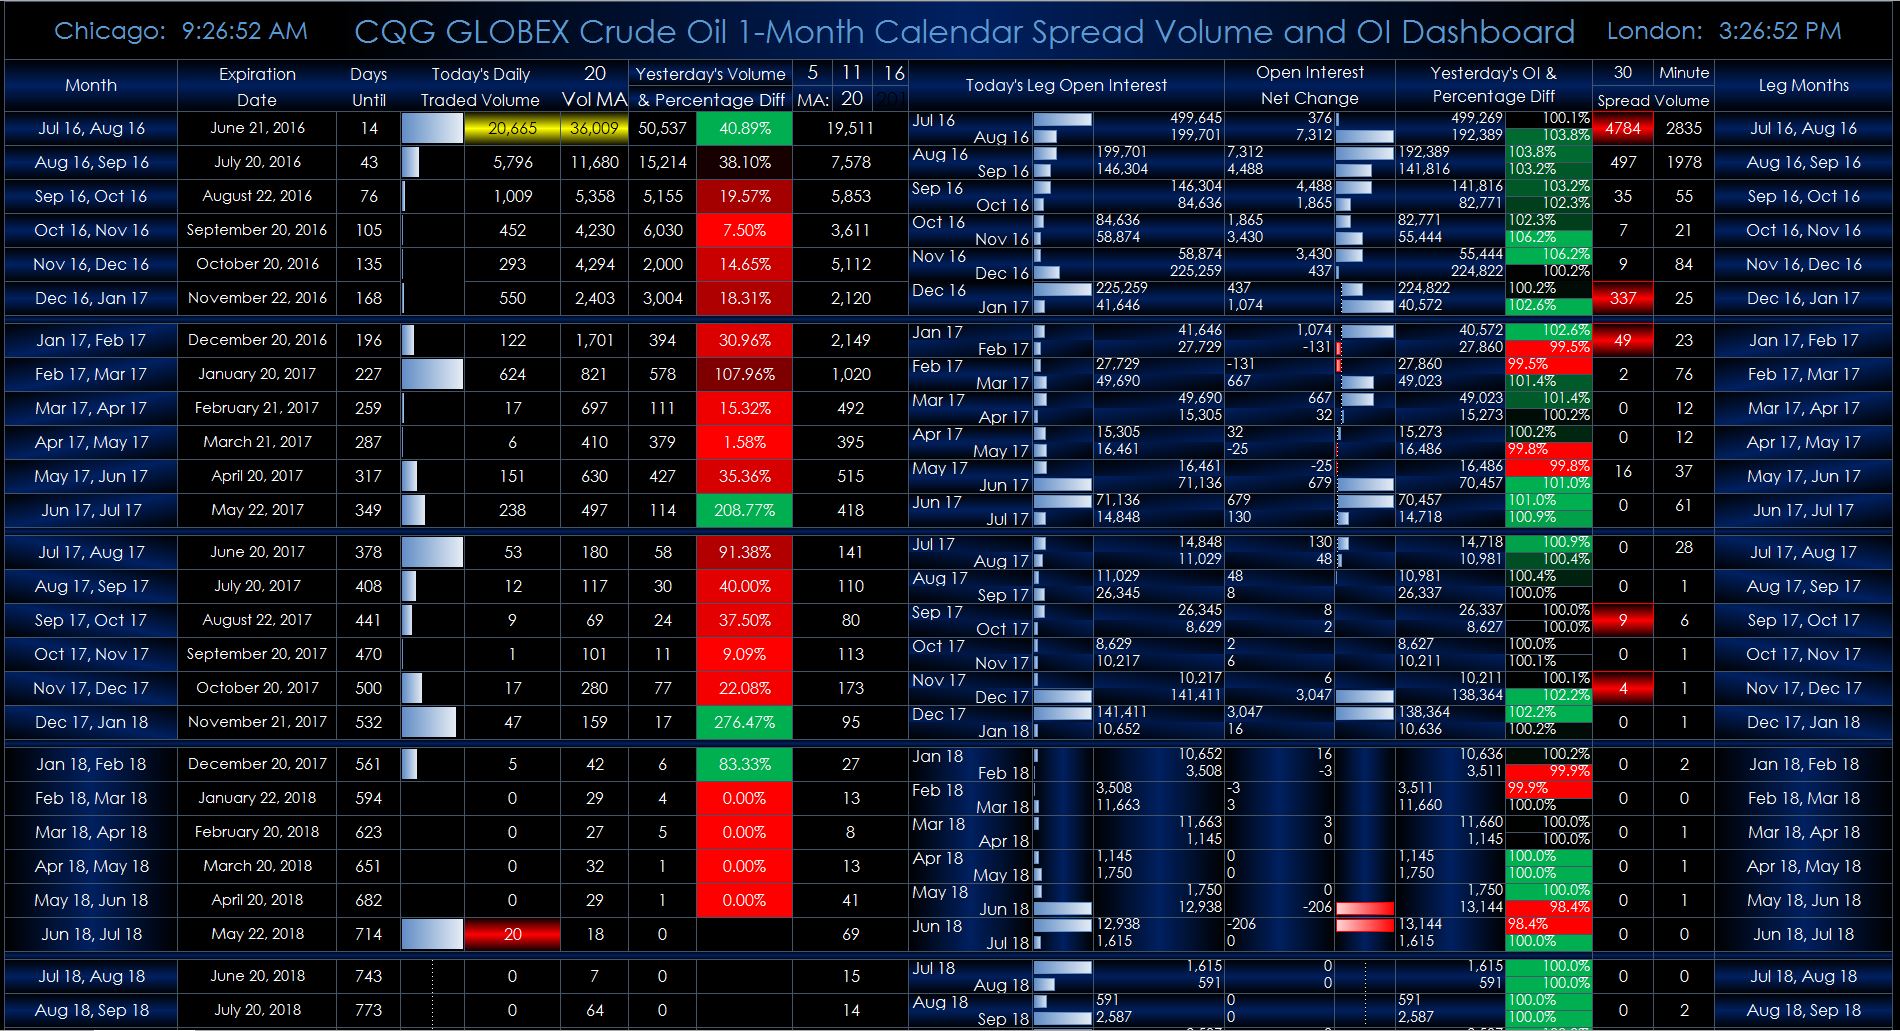
This Microsoft Excel® dashboard displays individual one-month crude oil calendar spreads traded on CME Globex and their individual legs for tracking the volume and open interest rolls. All of the active deliveries for each individual symbol are displayed in a single dashboard detailing market data. The volume column highlights, in gold, the contract that has the largest moving average of the volume. If today's contract volume exceeds the moving average of the volume, then the volume is highlighted red. You can change the lookback period for the moving average. You can also enter a calendar date and pull a moving average value of the volume from that date. If the thirty-minute volume exceeds yesterday's thirty-minute volume for the same time, then the volume is highlighted red.