Mark B. Fisher, founder and CEO of MBF Clearing Corp, discussed his chart and study during a joint webinar with CQG. This article further explains the study and chart type, available in CQG, as well as Mark Fisher’s trading bands that are displayed on the CQG charts he used in the webinar. A link to a PAC for installing the studies in CQG is available at the end of this article.
The MBF Indicator is a combination of bricks that have a user-set parameter of ticks or price that determine the size of the bricks and Fisher bars. Fisher bars show volume corresponding to the time at which the price was within the brick range. They are volume bars displayed below the price chart.
The study and chart are essentially the same except the study uses a default brick size of 5 ticks and the chart type uses a default brick size of 25 ticks.
Two futures markets were discussed in the webinar: the crude oil market and the E-mini S&P 500 contract. Mark Fisher used a 15-tick brick size for the crude oil contract and a 10-tick brick size for the E-mini S&P 500 market.
The concept of charting bricks is familiar to traders who use the Renko chart type. Invented in Japan, Renko charts ignore time using price changes that meet a user-set minimum. The MBF chart does not ignore time. Instead, when a brick is completed, it is overlaid on the time-based open, high, low, and close bar chart. The bricks are green for advancing bricks and red for declining bricks. This provides a clear indication of how much time the market spent forming the brick. At the end of each brick is a bar that includes a wick (the thin line) for the range of prices outside of the completed brick formation.
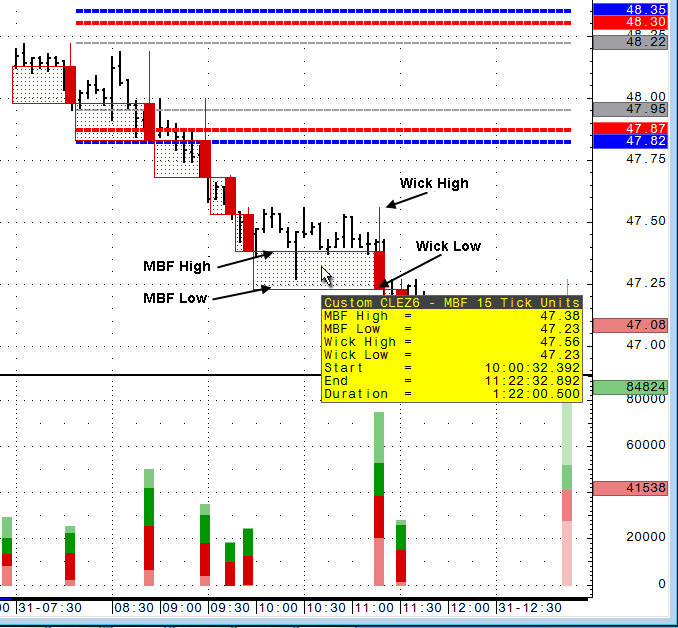
Hover your mouse over the brick to view a tooltip with the following details (Figure 1):
- MBF High: The high of the brick
- MBF Low: The low of the brick
- Wick High: The high of the wick
- Wick Low: The low of the wick
- Start: The start time of the brick
- End: The end time of the brick
- Duration: The amount of time used to complete the brick
Fisher bars are volume bars. The height of the Fisher bar is the total volume executed when the brick was completed. A lightly colored Fisher bar indicates that the brick is not complete.
Hover your mouse over the Fisher bar to view a tooltip with the following details (Figure 2):
- Volume: Total volume
- Ask Vol: Total volume traded at the ask
- @Wick: Total volume traded at the ask in the wick
- Bid Vol: Total volume traded at the bid
- @Wick: Total volume traded at the bid in the wick
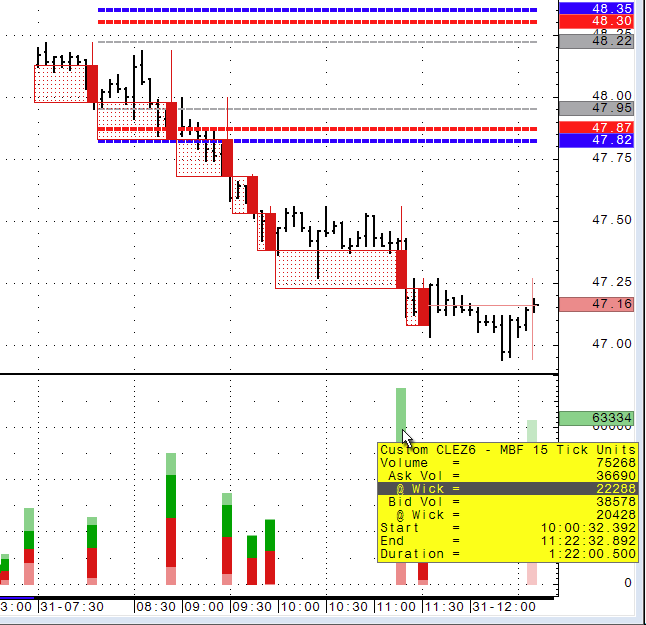
The wick is not part of the MBF brick. The wick represents the price range outside of the brick.
In this example (Figure 2), 75,268 contracts traded during the formation of the MBF brick, 42,716 contracts traded in the wick, and 32,552 contracts traded in the brick.
Also included are the start time, end time, and duration of the brick.
Trading Bands
The ACD lines and the three-day rolling pivot range lines are part of Mark Fisher’s Logical Trader system. It is an opening range breakout system.
The grey lines mark the opening range, which represent the high and low of a pre-determined time segment for the opening range. Each market has a user-set opening range. Then, a user-set multiple of the Average True Range is added and subtracted from the open range to determine the A lines (red) and the C lines (blue). These levels are used to enter, exit, and reverse trades in the Logical Trader system. The three rolling pivot ranges are also displayed on the chart (green lines), which add another technical indicator to identify the support and resistance area. Different markets have their own parameters.
Additional Resources
Logical Trader Support
- Phone: 212-845-5138 or 212-845-5038
- Email: information@mbfcc.com