CQG customers who create their own custom studies can easily use RTD to pull custom study values into Excel.
There are only two unique requirements in the RTD formula for a custom study: first, include the “^” sign in the custom study name and second, include the curve name.
For example, in the chart below the custom study is the Slow Stochastic applied to a 14-period RSI. The name of the study is SRSI^ and there are two curves: c1 and c2.
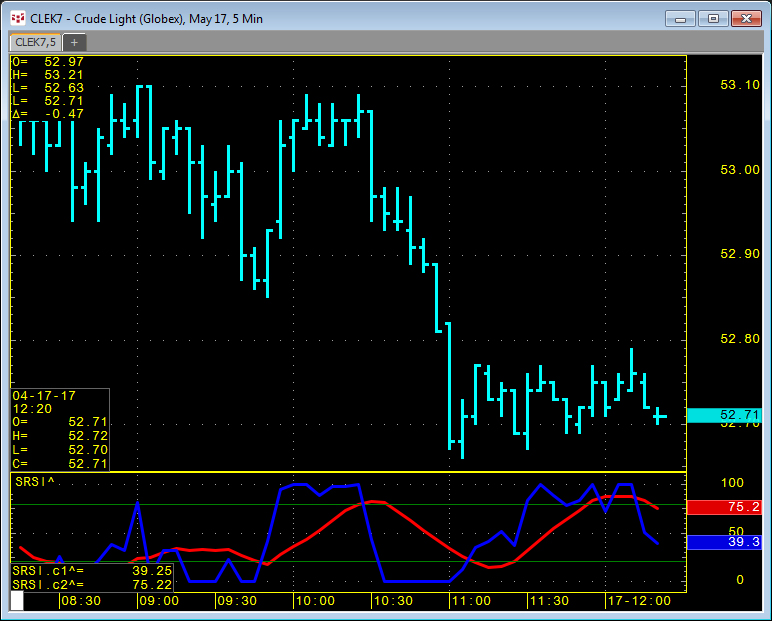
The RTD formulas for the two curves, using symbol CLE and a 5-minute bar time frame, are:
= RTD("cqg.rtd",,"StudyData","CLE", "SRSI^",, "c1","5","0","All",,,"True","T")
= RTD("cqg.rtd",,"StudyData","CLE", "SRSI^",, "c2","5","0","All",,,"True","T")
The downloadable CQG-powered Excel RTD spreadsheet pulls in historical open, high, low, and close values and the two curves: c1 and c2. You can enter in your symbol and time frame.
We also provide the CQG pac for adding this custom study to CQG and a page with the chart. You will need to install this custom study for the Excel file to work.
Requires CQG Integrated Client or CQG QTrader and Excel 2010 or more recent.