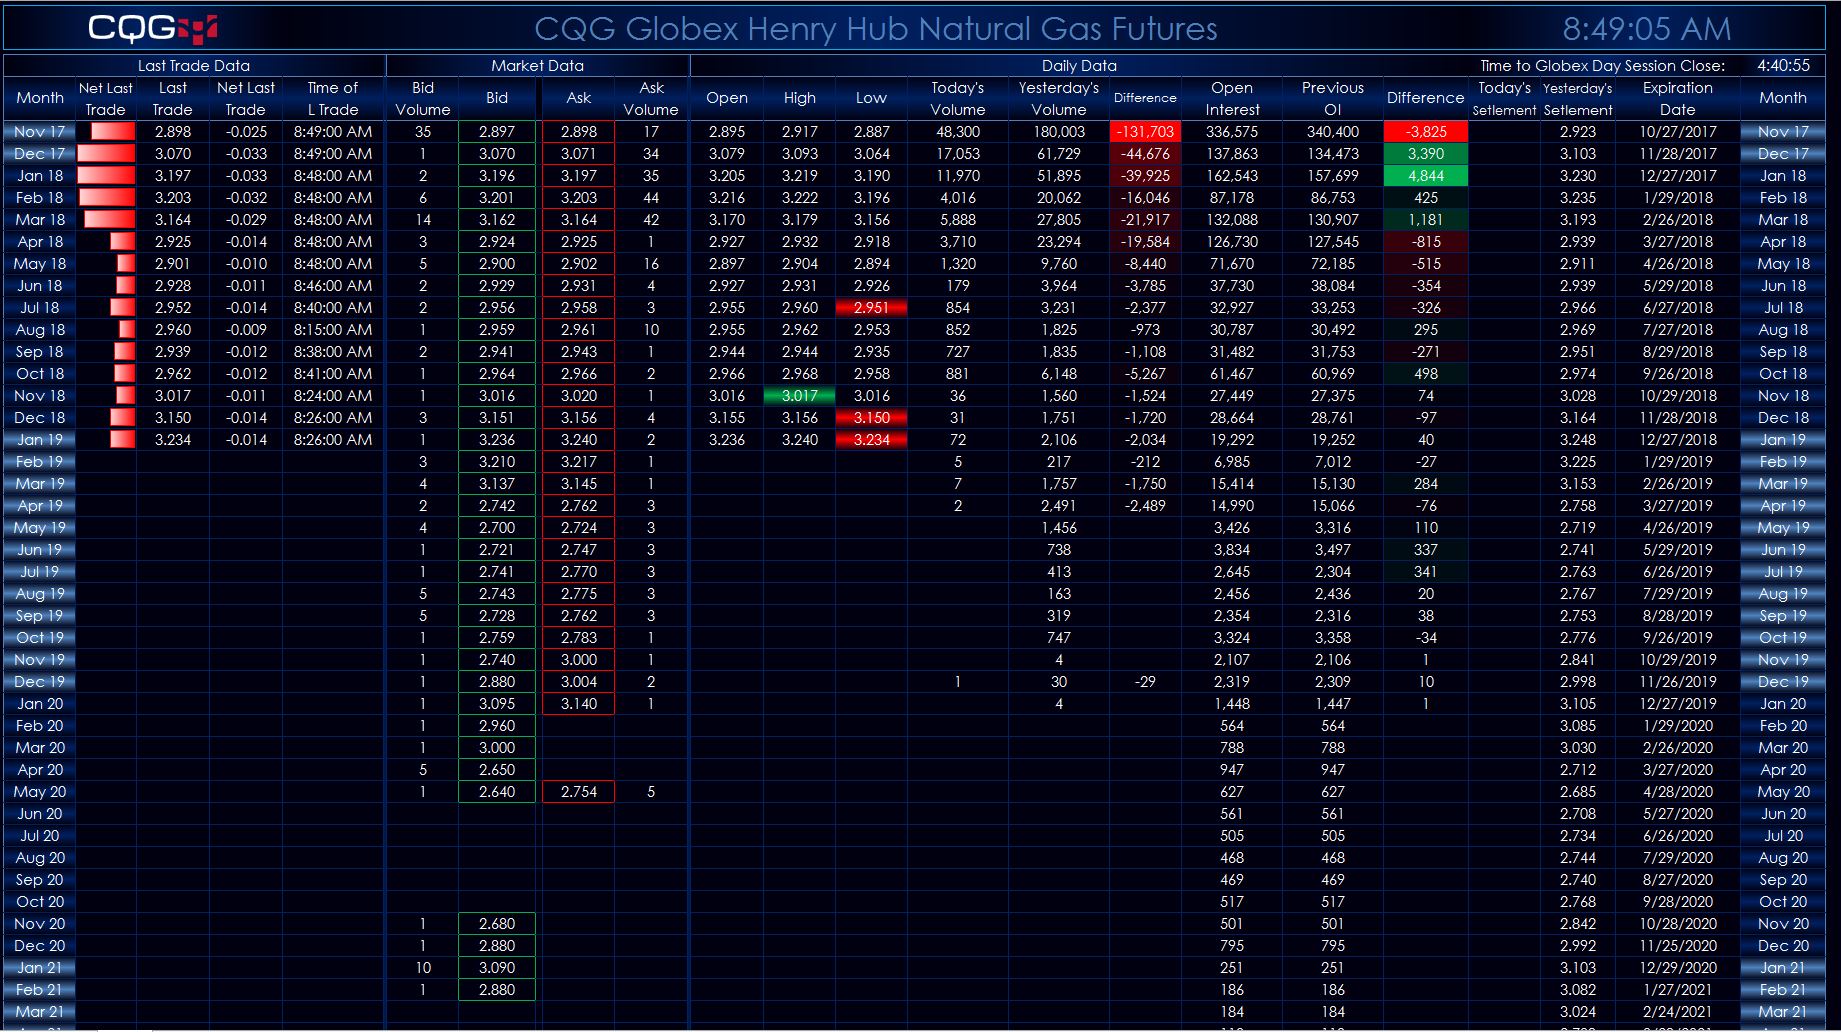
This Microsoft Excel® dashboard has three tabs. The first tab displays today’s market quotes, volume, and open interest data. If the last price is matching the open price, then the open price is highlighted blue. If the last price is within one tick or equal to the high, then the high is colored green. If the last price is within one tick or equal to the low, then the low is colored red.
The second tab displays 1- through 6-month calendar spreads. The dashboard offers the ability to enter a date to compare where the same calendar spreads were trading. You can enter in a date up to 300 days back.
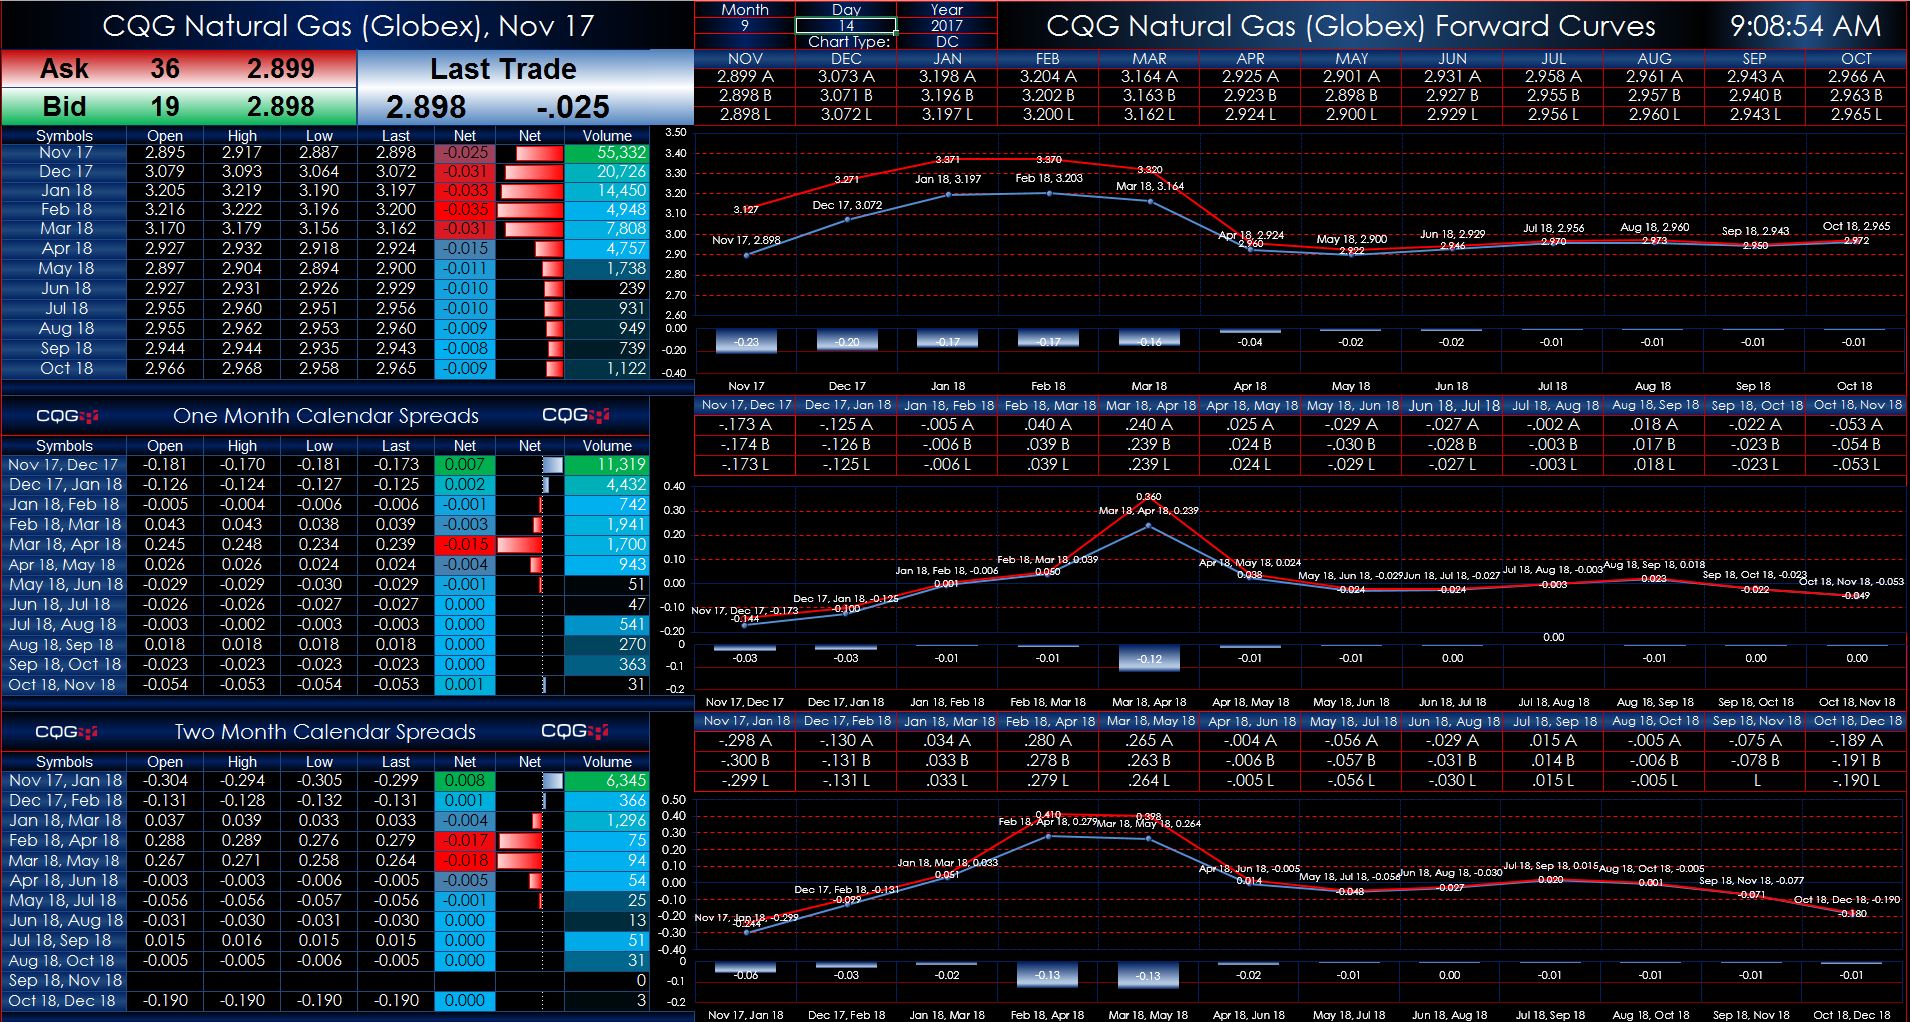
The final tab displays winter and summer strips for the next two years. You can also enter in a date and see where the same strip was trading up to 300 days ago. All contracts on all three tabs automatically roll.

The forward curve charts, both calendars and strips, use the mid-point between the best bid and ask if there is no posted trade.
Requires CQG Integrated Client or CQG QTrader, data enablements for all symbols displayed in this spreadsheet, and Excel 2010 or more recent.