CQG products such as CQG IC, QTrader and CQG One come with a collection of price-based studies which can be applied to charts to facilitate analysis. This post offers insight into the collection of moving average studies. Just what the studies actually do and what do they do not do.
To start, most studies can be classified as one of two groups: Smoothing data or detrending data. The most common study for smoothing data is the simple moving average. The moving average calculation sums a user selected number of (most common) previous closes and divides that sum by the number of observations.
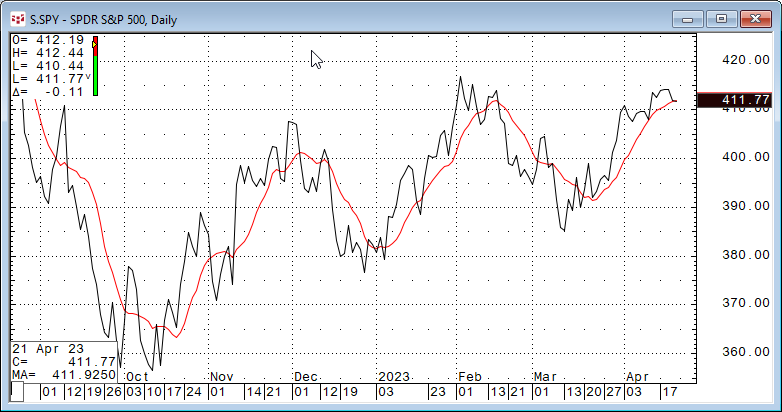
Checking this image the market prices are smoothed by a 10-period simple moving average. The moving average filters the noise about the trend of the data leaving a smoother line.
The remainder of this article is to explore the various moving average studies offered in CQG. A later post will examine the oscillator studies offered in CQG. This image below displays all eight of the studies from the moving average group.
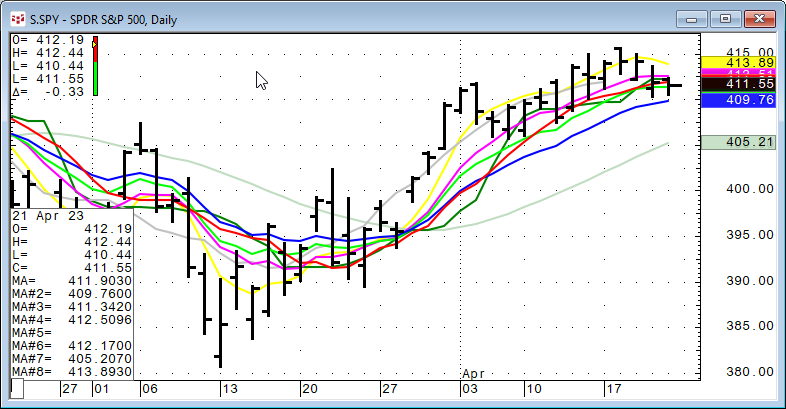
Moving Averages available in CQG:
- Simple: Prices are summed using the lookback parameter and divided by the lookback parameter.
- Smoothed: Similar to a simple moving average. However, in a smoothed moving average, rather than subtracting the oldest value the previous smoothed average value is used. Smooth(N) = Smooth(N-1) + (Price(N) - Smooth(N-1)) /Period
- Exponential: The Exponentially Smoothed Moving Average (ESMA) = pESMA - (Smoothing Constant * (pESMA - Price)) where p = previous.
- Weighted: Assigns weights linearly with greater weights to more recent data points and then summed and divided by the lookback period.
- Centered: Centered Average is a Simple moving average but plots the first point at the center bar of the specified period.
- Median: The median moving average is the center value in the price series.
- Trix: Triple smoothing of the data using exponential moving averages with the same smoothing constant (EMA period).
- Exponential Hull: Uses the difference between two exponential moving averages. Exp Hull = EMA(2*EMA(N/2) - EMA(N),Sqrt(N))
For more information, please read the CQG Help file: Moving Averages available.
To dig a little deeper a 10-period rolling correlation analysis was performed on 100 days of daily closing values for symbol SPY for each moving average (using a 10-day lookback parameter) compared to the 10-day simple moving average.
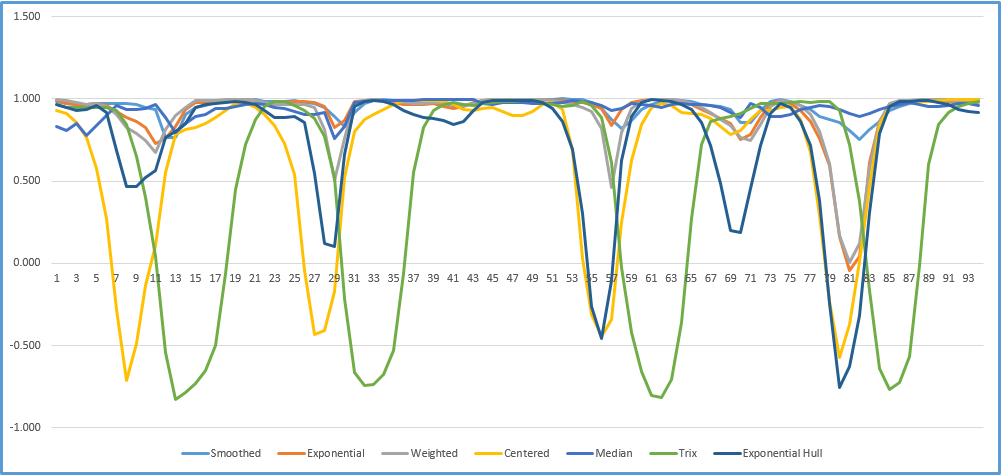
Looking at the chart we can see that there are periods when all of the moving averages are highly correlated with the 10-day simple moving average and periods where a few are actually negatively correlated.
Why is this important? When designing a trading system and having multiple studies you should avoid studies that are highly correlated because there is a replication of information not a confirmation.
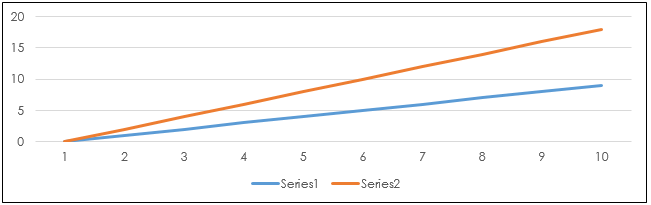
First, correlation is way to measure the relationship between two data sets. Correlation values near +1.00 indicate a strong positive relationship, values near 0.00 indicate no relationship and values near -1.00 indicate a negative relationship. A high correlation does not mean that the two data sets are very similar. For example, in the chart below the series 1 line is climbing 1 unit per step and the series two line is climbing 2 units per step. The correlation between the two is +1.00.
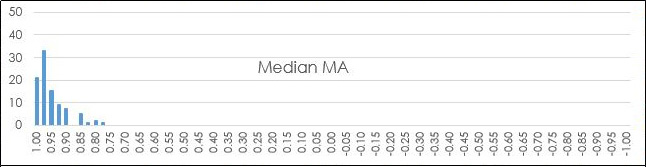
To better understand the correlation analysis of the relationship of the individual moving averages compared to the simple moving average we can use Excel's Frequency function. This function returns the number of times a score lands in a range of values. In the image below the frequency function counts the number of times the historical individual correlation value lands in a "bin." The bins range from 1.00 to -1.00 in 0.025 steps.
The Smoothed moving average has the highest set of correlation values to the 10-day Simple moving average with the lowest reading in bin +0.775. Why is that?
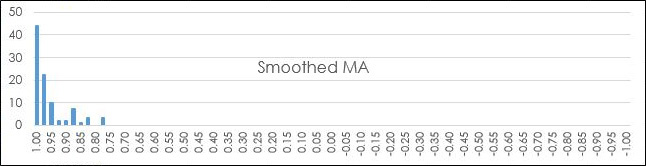
The Smoothed moving average calculation is similar to the simple moving average except instead of dropping off the oldest value in the lookback period the Smoothed moving average uses the previous Smoothed moving average value plus the difference between the new price and previous Smoothed moving average value divided by the lookback period.
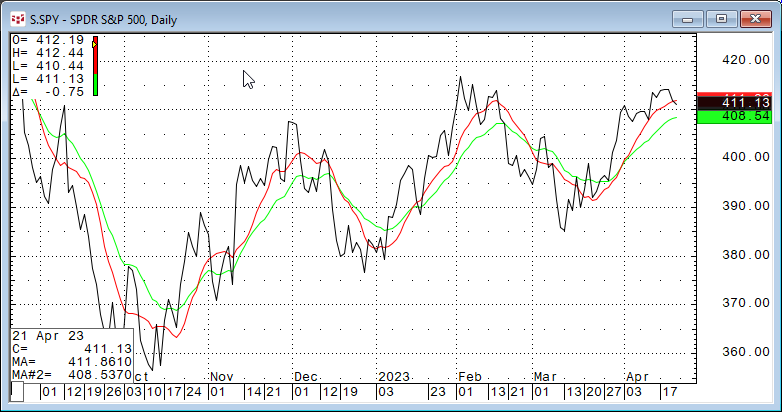
Looking at the CQG chart above with the two moving averages we can see the 10-day Simple moving average (the red line) and the 10-day Smoothed moving average (the green line) that the two studies tend to rise together and to decline together. In other words, the two are correlated.
The Exponential moving average also had a high set of correlation values with the lowest reading being in bin -0.025.
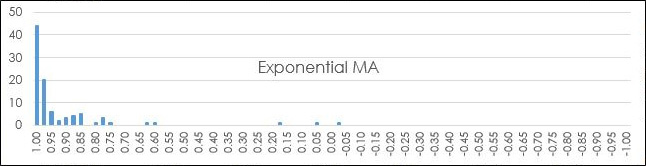
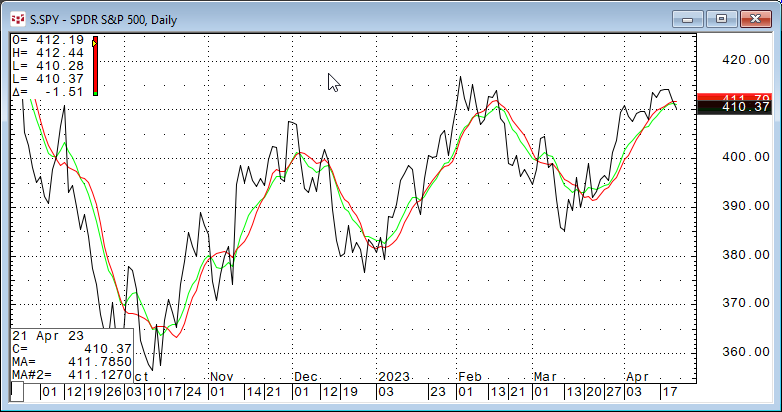
The calculation of the Exponential moving average uses a smoothing constant. The previous Exponential moving average minus the smoothing constant times the difference between the previous Exponential moving average and the price. Therefore, if the price closes above/below the Exponential moving average then the Exponential moving average will change direction. The Exponential moving average has less lag than the Simple moving average but may have more whipsaws.
The Weighted moving average has a similar correlation distribution to the Exponential moving average. Its lowest correlation value is +0.025.
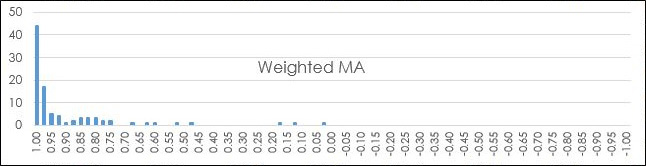
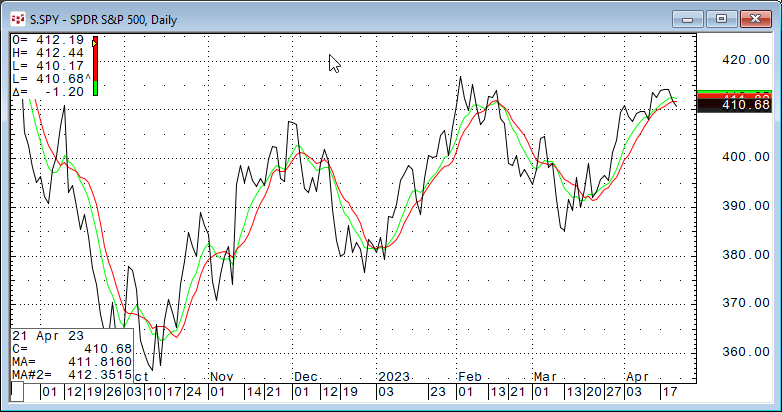
The Weighted moving average assigns weights linearly, assigning greater weights to more recent data points. For example: [10 * Close (0)] + [9* Close (-1)] + [8 * Close(-2)] +...[1 * Close (-10)]/ lookback period. The idea is the most recent market data is more important.
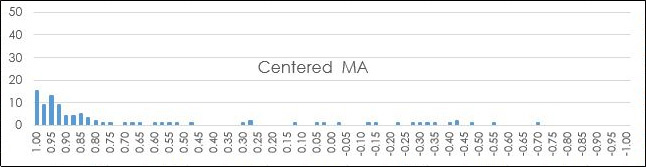
The Centered moving average is calculated the same as Simple Moving average. The difference is where the data point is plotted. A Centered moving average plots the data point at the center bar of the specified lookback period. This aspect lowers the correlation results.
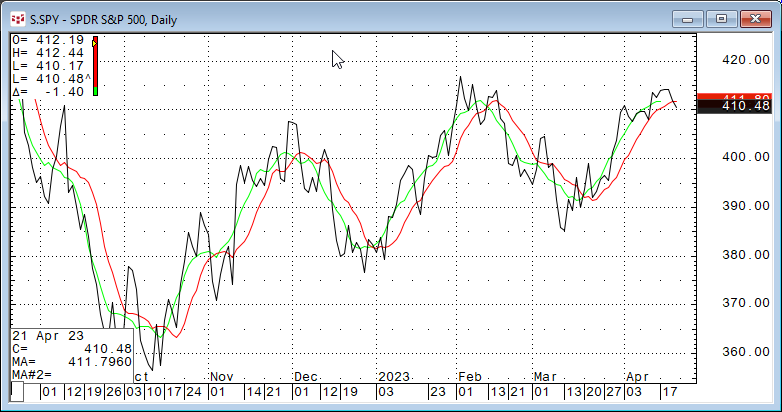
Looking at the CQG chart the Centered moving average (the green line) is shifted to the left by five bars.
The Median moving average uses the median of the data in the lookback period and not the average of the prices. The median is the mid-point in the price data. The correlation analysis indicates this moving average compared to the Simple moving average has less +0.975 to +1.00 counts then the Smoothed moving average but the same minimum (+0.775).
The Trix moving average has by far the widest ranges of correlation to the Simple moving average.
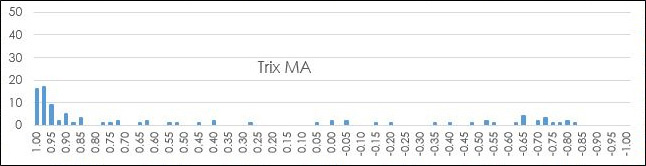
Viewing the chart and examining the calculation for the Trix moving average explains why. This is a triple smoothing of the data using exponential moving averages with the same smoothing constant (EMA period). In other words, it is an exponential moving average of an exponential moving average of an exponential moving average. This triple smoothing introduces a great deal of lag between the Trix moving average and the Simple moving average.
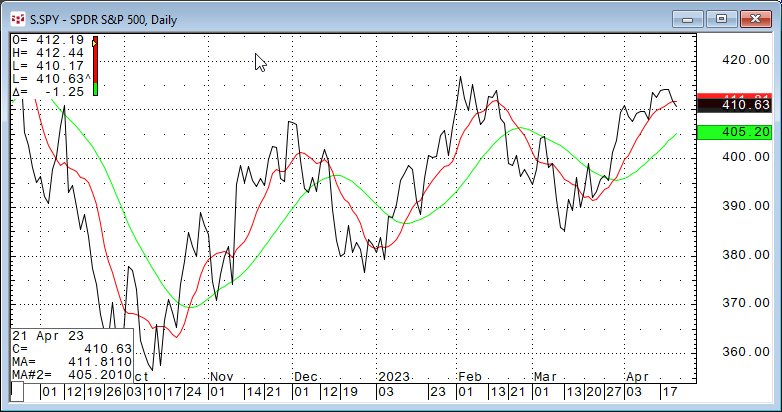
The Exponential Hull moving average uses the difference between two exponential moving averages for smoothing the data. The frequency distribution analysis of the correlation between the Exponential Hull moving average and the Simple moving average is similar to the correlation analysis of the Trix moving average.
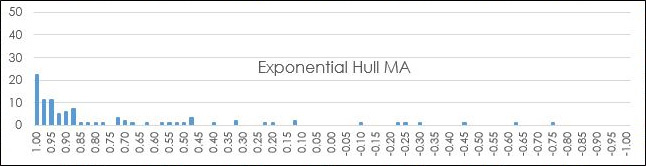
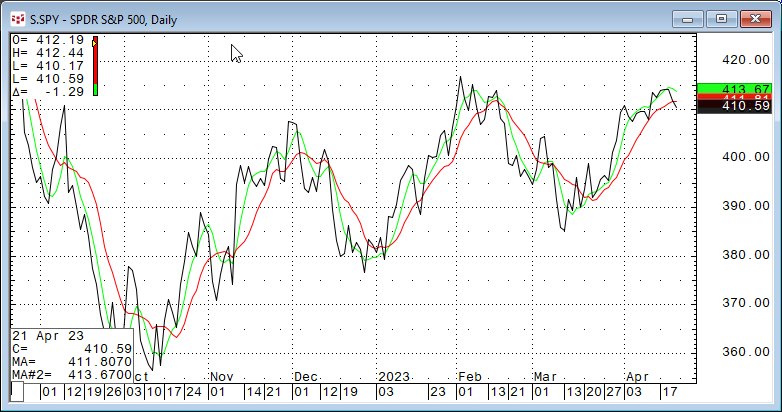
The formula is Exp Hull = EMA(2*EMA(N/2) - EMA(N),Sqrt(N)) where N = EMA period. Looking at the chart the Exponential Hull moving average plot is the opposite of the Trix moving average plot. The lag of Exponential Hull moving average is less than the Simple moving average compared to the market price action.
Summary
The point of this article were twofold: First, an overview of CQG's Moving average study and the features and functionality. Second, an example of using Excel's Frequency function for correlation analysis between the base study, the 10-period Simple moving average, and the other moving averages. Futures posts will look at other studies offered in CQG products.
Next, if you are interested in further analysis of the moving averages for a trading system then a close read of CQG's Product Specialist Helmut Mueller posts on backtesting and much more is an excellent place to start.