This Microsoft Excel® spreadsheet is an updated version of the CQG-Powered Excel Horizontal DOM Dashboard, which also includes a correlation display. Two histogram charts have been added to each of the three chart displays. These two histogram charts display current volume (highlighted by the light blue bar) relative to volume data over the last ten sessions. The volume analysis is using five-minute bar volume.
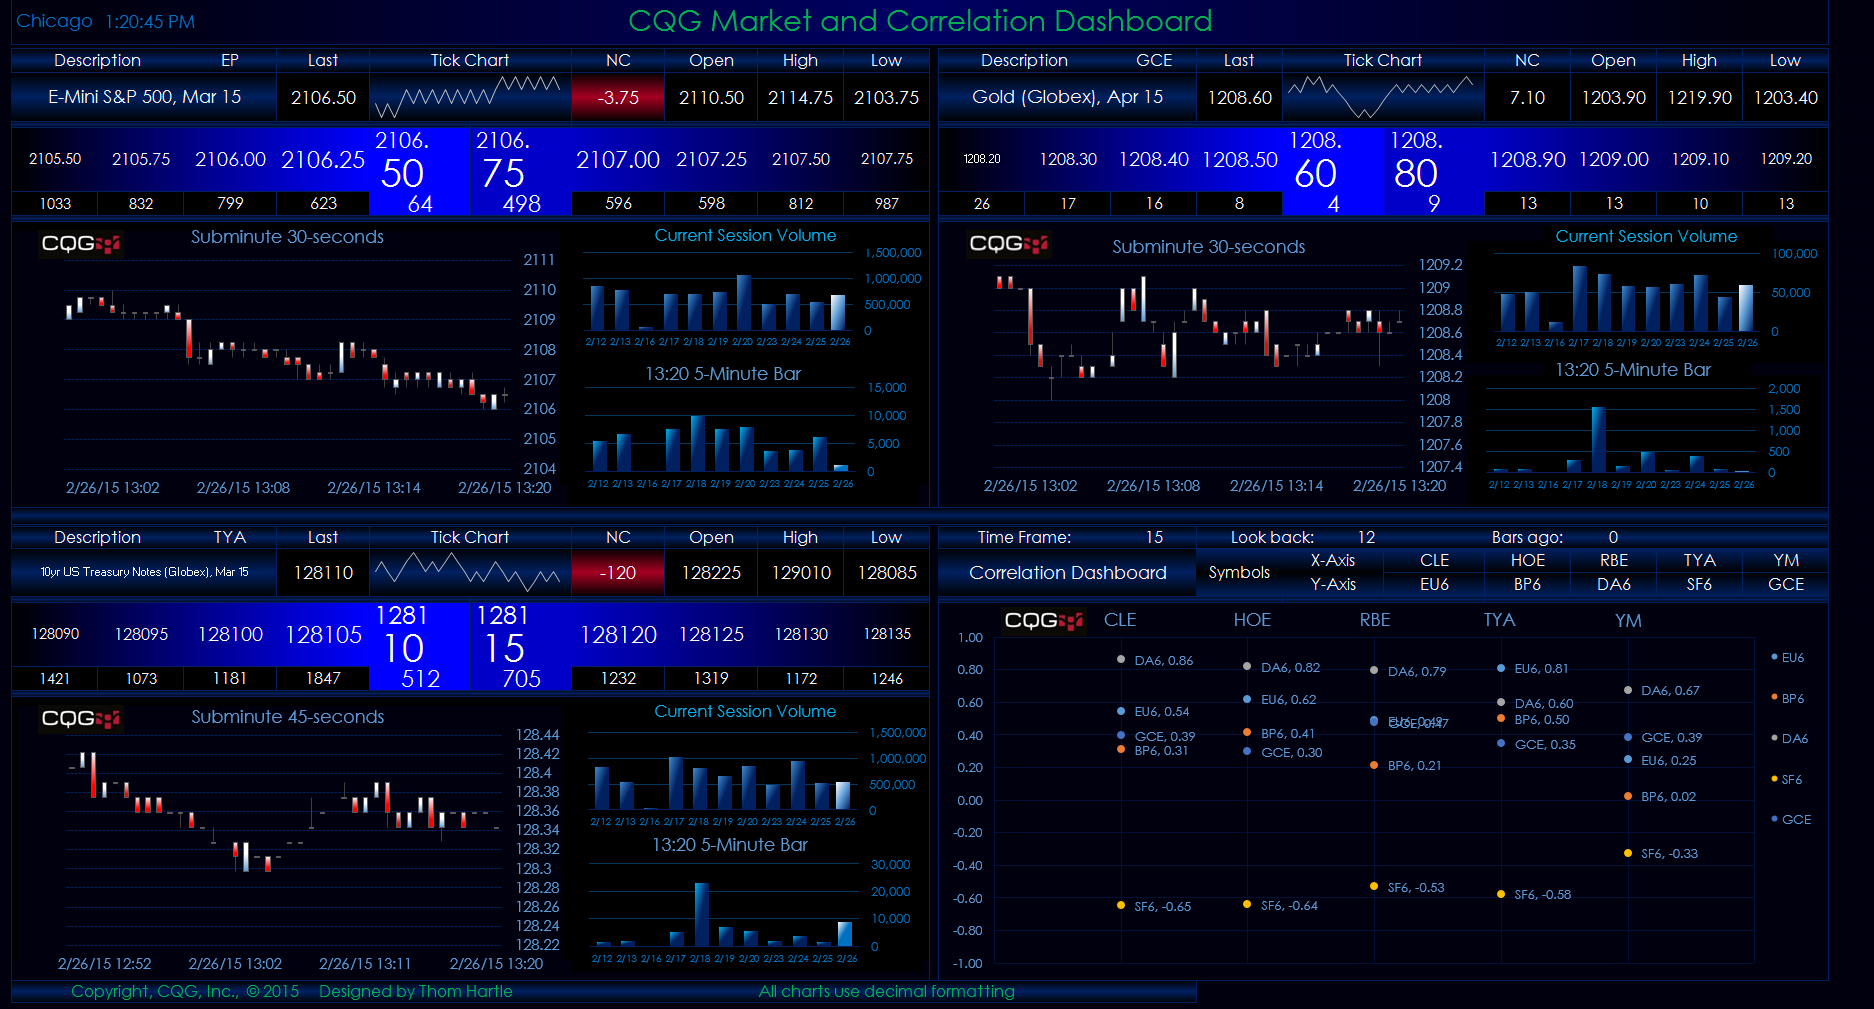
The top histogram chart shows the current total traded volume for the session compared to the last ten trading sessions at the same current time. The bottom histogram chart shows the volume for the current five-minute bar relative to the same five-minute bar's volume over the last ten sessions.
The opening and closing times are set by the user on the Format Main Display tab. The opening and closing times must be in the same session and start after midnight.
Requires CQG Integrated Client or CQG QTrader (QTrader standard package is limited to three years of historical data), data enablements for all symbols used in this spreadsheet, and Excel 2010 or more recent.