
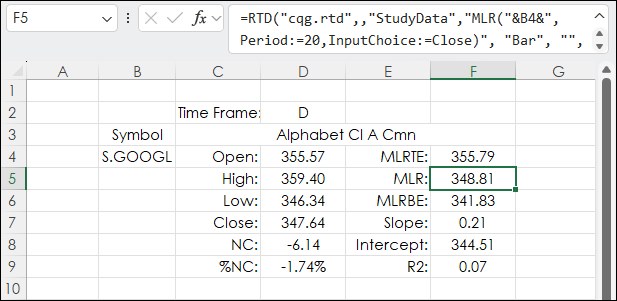
CQG offers the Moving Linear Regression Line study. When plotted on a chart the line (blue line below) is the endpoint of a best fit line using the least squares technique. This technique finds… more
Workspaces
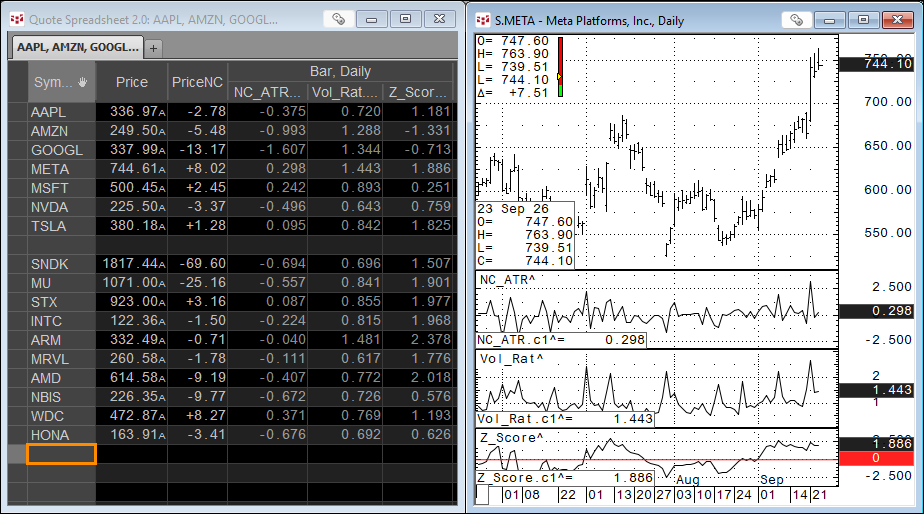
Technical studies are used to analyze markets and are often the basis for trading decisions. The studies all take market data and apply mathematical steps that result in a single value.
An… more
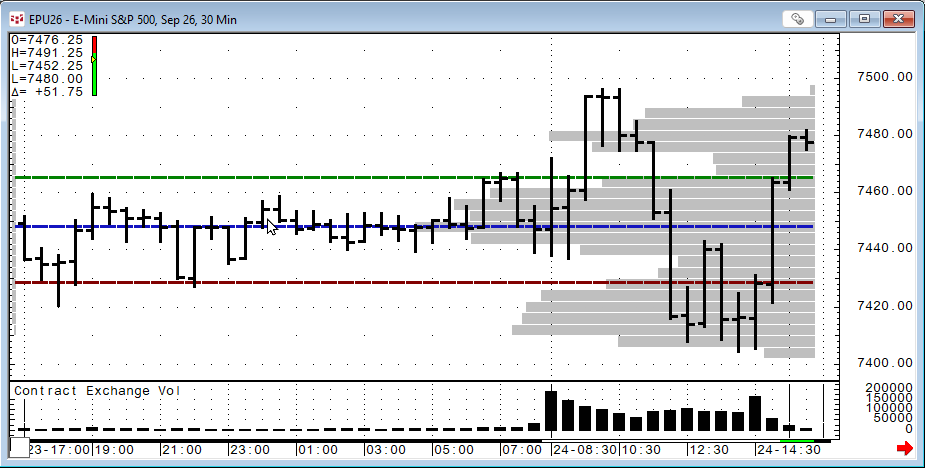
This post details the Market Profile Value Areas (MPVA) study, as well as providing a downloadable Excel sample for pulling MPVA study data into a spreadsheet.
When applied to a chart, the… more
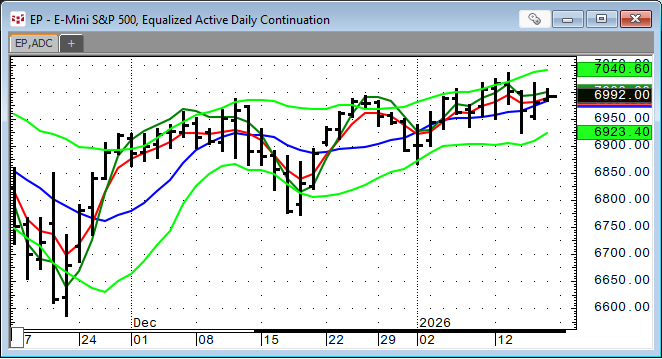
In Mr. Ehlers Book “Cybernetic Analysis for Stocks and Futures” the “Leading Indicator” was introduced. The goal of this study was to smooth the price action while not having the lag by the study… more
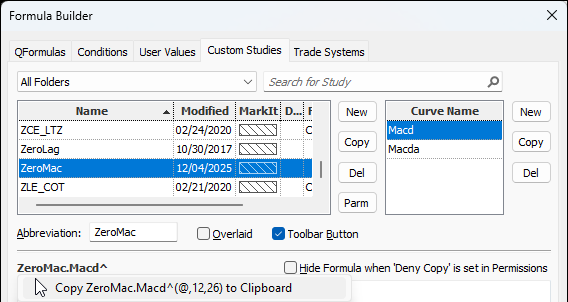
This post details the steps to pulling custom study values into Excel using RTD formulas. First, an overview of RTD formulas and parameters.
When CQG IC or QTrader are installed, a DLL… more
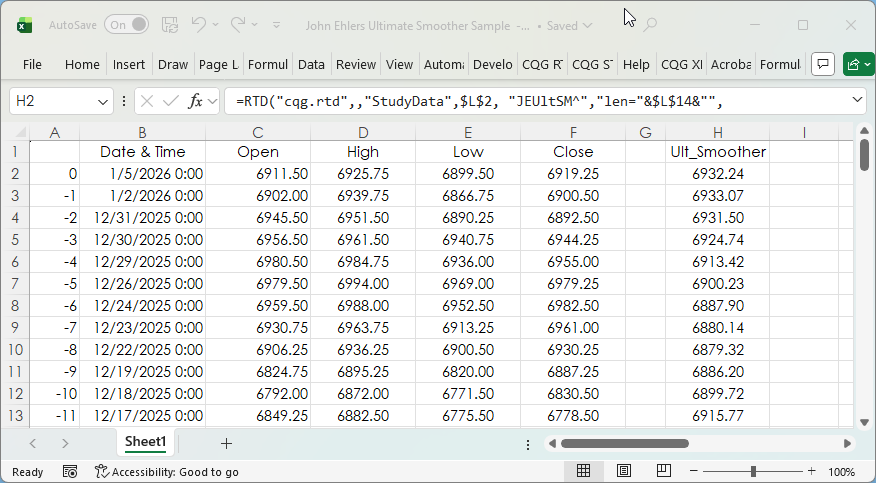
The post CQG Primer: The Ultimate Smoother detailed a study developed by John Ehlers. You can find a detailed description of the Ultimate Smoother on the MESA Software website.
This post… more
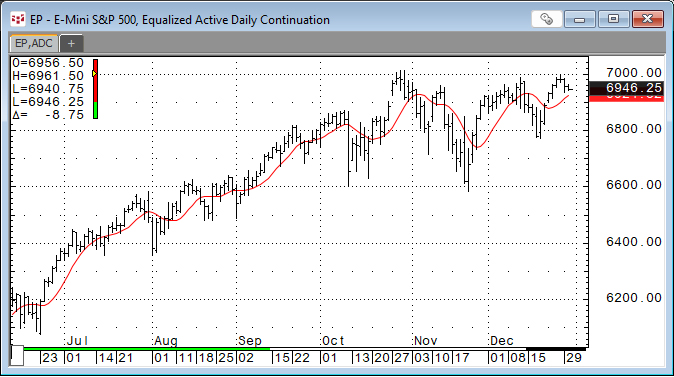
John Ehlers developed the Ultimate Smoother study. https://www.mesasoftware.com/TechnicalArticles.htm The study is a two-pole low-pass digital filter designed to smooth price data while… more
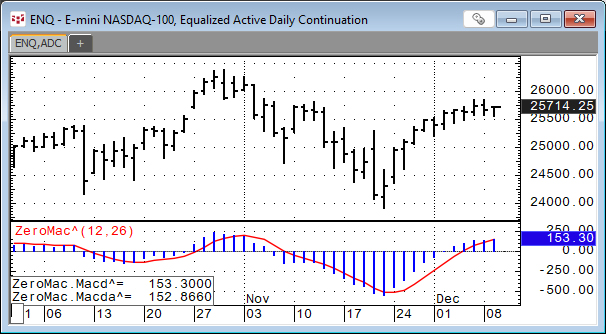
This post detailed the Double Exponential Moving Average Study or DEMA. DEMA is helpful for technical analysis because it reduces the lag of traditional moving averages, such as the simple moving… more
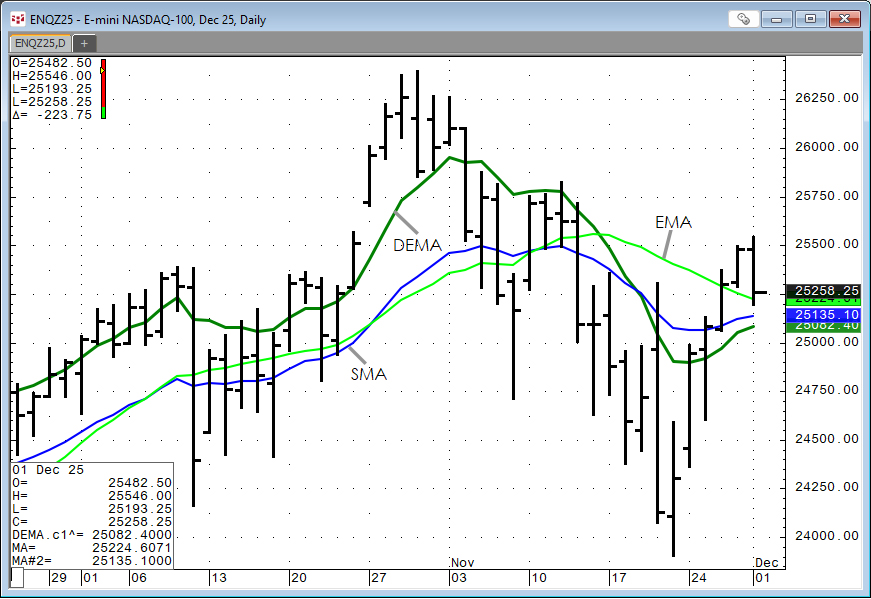
The Double Exponential Moving Average study is a moving average calculation that reduces the lag associated with other moving averages. The Double Exponential Moving average is calculated as the… more
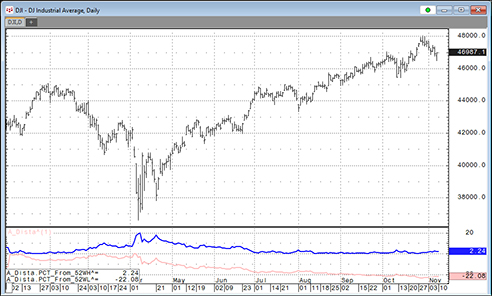
This post offers a downloadable CQG PAC for IC and QTrader and Excel dashboard that includes two custom studies that track a market's performance by measuring the price difference between the… more