
This post details a Macro-Enabled Excel Dashboard that tracks the holding of the S&P 500 Index and compares the percentage net change of each stock to the percentage net change of the cash S&P 500 index using Excel's Map function on the Data Tab.
On the Data tab in cell F1 is the percent net change for the S&P 500 cash index:
=IFERROR(RTD("cqg.rtd", ,"ContractData","X.SPC", "PerCentNetLastTrade",, "T")/100,"")In cell F2 is the MAP Function, which uses a LAMBDA function:
=IFERROR(MAP(E2:E504,LAMBDA(x,x-$F$1)),"")
Column E is the percentage net change for each stock, and the LAMBDA function is subtracting the difference from cell F1 and is mapped to cells F2:F504.
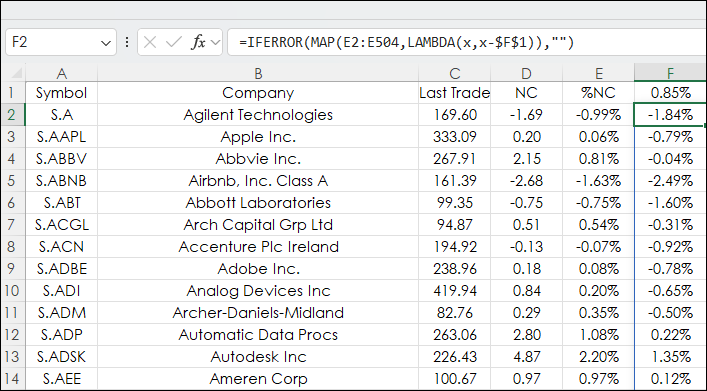
The value of the MAP function is it only needs to be entered into one cell.
Next, the individual stocks' percentage net change difference relative to the percentage net change of the S&P 500 are sorted ascending and descending.
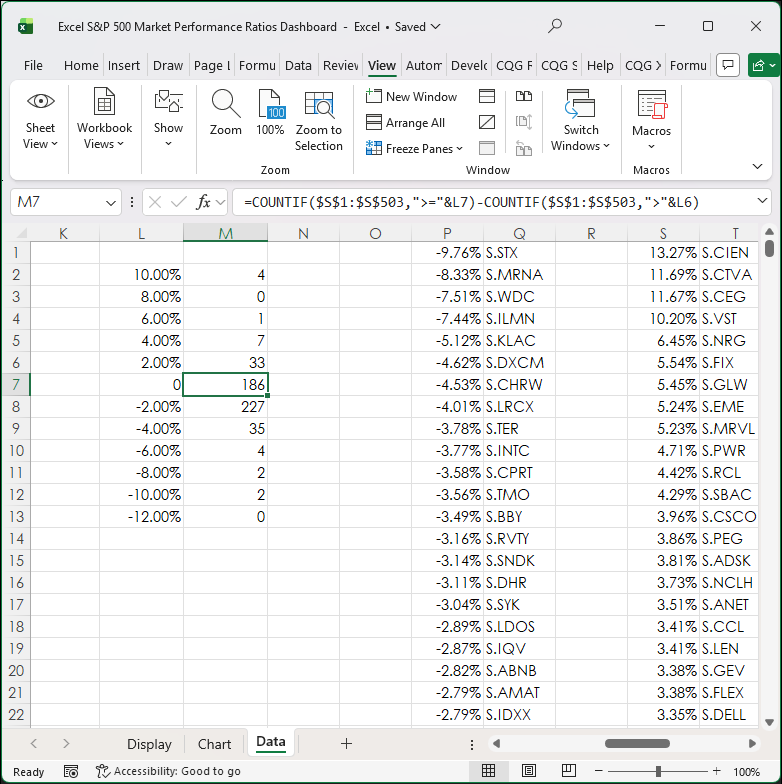
Cells L2:M2 are counting the number of times the difference between the stock's percent net change and the S&P 500 percent net change falls into a particular bin (Cells L2:L13).
The image below shows the Bins. For example, the center Bin is from 0% up to but not including 2.00% and so on. The Excel function in Cell M7:
=COUNTIF($S$1:$S$504,">="&L7)-COUNTIF($S$1:$S$504,">"&L6)
For example, if the stocks' percent net change was +2.5% and the S&P 500 percent net change was +1.50% then the value would be +1.00%. And would be counted in Bin 0.
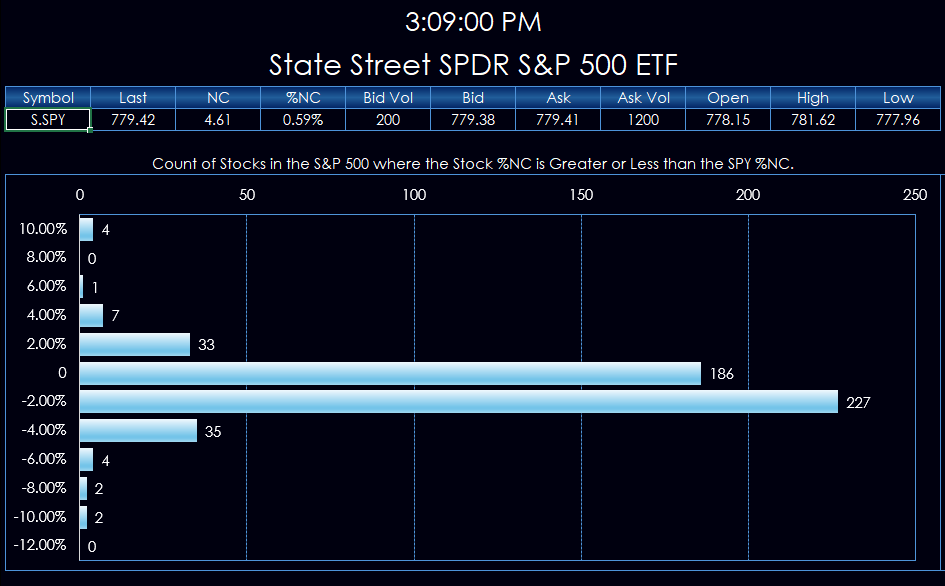
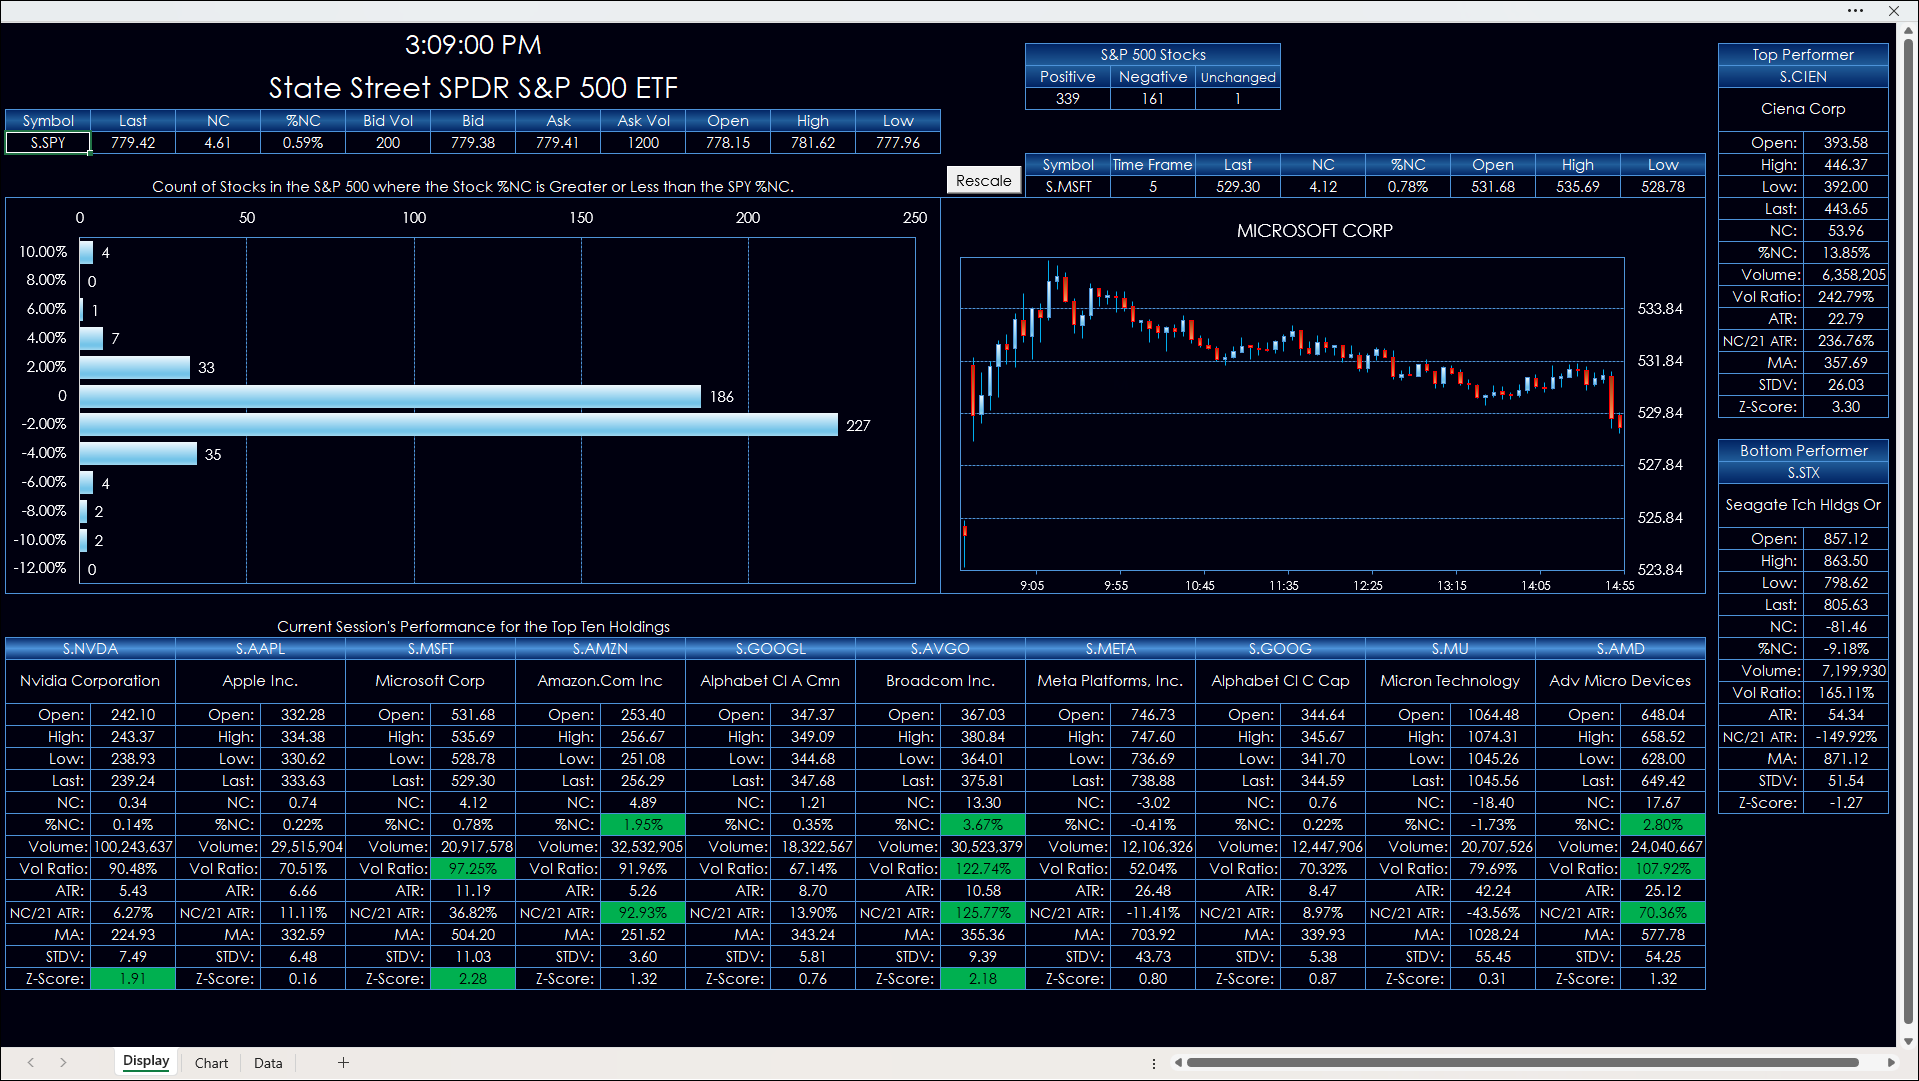
The Bins and the Counts are displayed as a histogram chart on the Display tab. This histogram chart provides a look at how the holdings are performing relative to the S&P 500 Index.
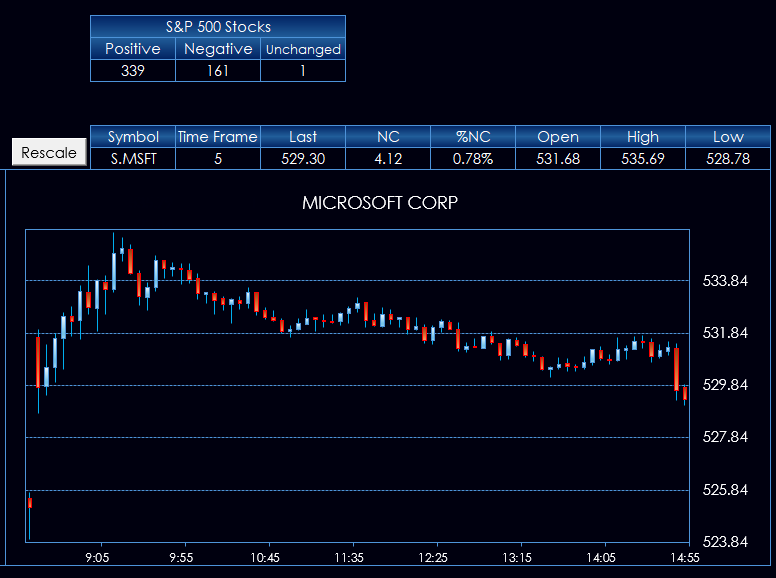
To the right of the Count Histogram chart is an Open, High, Low, Close chart. Enter the Symbol using all capital letters and the Time Frame is a dropdown list: 1, 5, 15, 30, 60 minutes and Daily, Weekly, Monthly choices.
The Rescale button runs a macro that scales the price axis to fit the data. Excel tends to set the lower price on the axis to zero. This macro fixes that issue.
Along the bottom of the dashboard are the current top ten holdings (as of 10/05/2026) with blocks for each symbol. The blocks have the standard market data: Open, High, Low, Last, Net change, percentage Net Change, and Volume.
Next is the Vol Ratio (Volume Ratio), which is today's current volume divided by the previous sessions 21-day moving average of the volume. The previous session is used because it is a fixed value. This ratio can indicate whether the current volume is actually high or low.
Next is the 21-day Average True Range. Then, the NC/21 ATR ratio, which is the Net Change divided by the 21-ATR. This ratio can indicate an unusually large Net Change.
At the bottom is the Z-Score Statistic. The is the ratio of the current price minus the 21-moving average in the numerator and the denominator is the 21 day Standard Deviation. This is an indication of both volatility and market direction.
The dashboard uses data visualization to highlight the top three stocks in each of the studies by coloring the background of the cell green.
For more information the studies are covered in this post: CQG Primer: NC_ATR Vol_Ratio and Z_Score Studies.
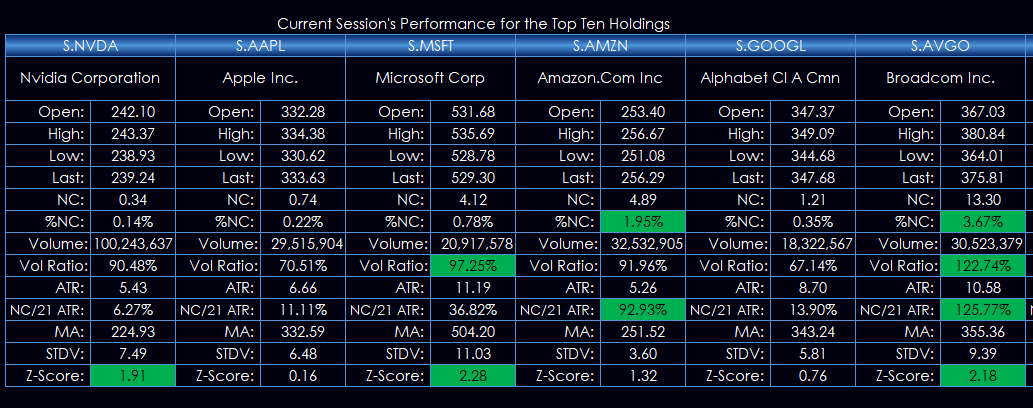
In addition, the far right side of the dashboard displays the top and bottom performing stocks with the same studies.
Below is an image of the full dashboard.
The dashboard is locked to prevent accidental editing but to unlock it does not require a password. Customers can explore how the dashboard is built.
Wikipedia provides a list of the symbols in the S&P 500.
Make sure to lower your Excel Realtime Data (RTD) throttle to 100 milliseconds. Learn how to do that here.
Requires CQG Integrated Client or CQG QTrader, data enablements for the NYSE and Nasdaq stocks, and Excel 2016 or more recent locally installed, not in the Cloud.