
This post details a Microsoft Excel dashboard that tracks the day's performance of the holdings of the Invesco PHLX Semiconductor ETF (Symbol: SOXQ).
From the Invesco website regarding the objective of the ETF: "The Invesco PHLX Semiconductor ETF (Fund) is based on the PHLX Semiconductor Sector Index (Index). The Index measures the performance of the 30 largest U.S.-listed securities of companies engaged in the semiconductor business. Semiconductors include products such as memory chips, microprocessors, integrated circuits and related equipment that serve a wide variety of purposes in various types of electronics, including in personal household products, automobiles and computers, among others. The Index includes companies engaged in the design, distribution, manufacture and sale of semiconductors. The Fund and the Index are reconstituted annually in September and rebalanced quarterly in March, June, September and December."
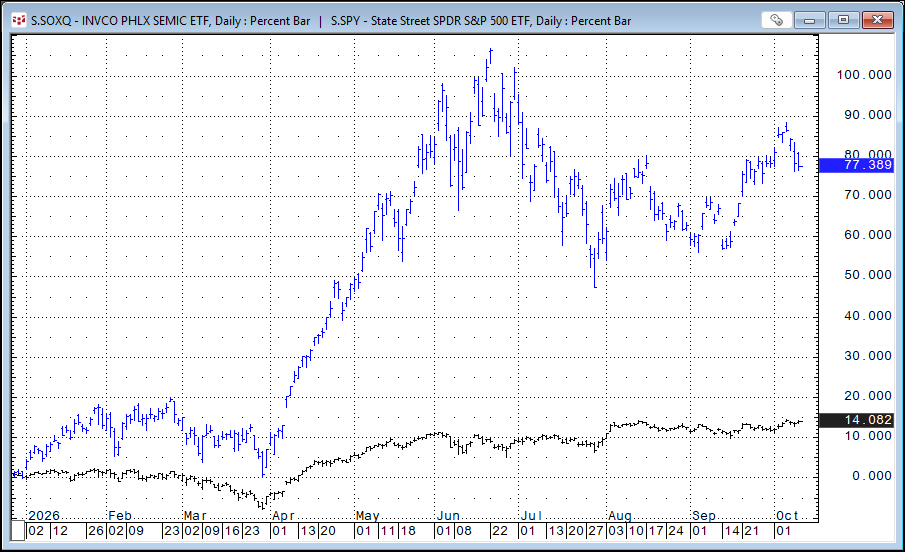
The image below displays the SOXQ (Blue) ETF's performance compared to the S&P 500 ETF (Black) from the end of 2025.
Here is a list of the current top ten holdings:
| Ticker | Company | Weight (%) |
|---|---|---|
| S.US.NVDA | Nvidia Corporation | 11.44% |
| S.US.AVGO | Broadcom Inc. | 8.96% |
| S.US.MU | Micron Technology | 7.88% |
| S.US.MRVL | Marvell Tech Inc Cmn | 4.78% |
| S.US.AMD | Adv Micro Devices | 4.75% |
| S.US.INTC | Intel Corp | 4.30% |
| S.US.ADI | Analog Devices Inc | 4.12% |
| S.US.KLAC | Kla Cp Cmn Stk | 4.09% |
| S.US.AMAT | Applied Materials | 4.06% |
| S.US.TSM | Taiwan Semiconductor Manufacturing Co | 4.01% |
All of the stocks in the ETF have positive annual net percentage change as of October 9, 2026:
| Symbol | Company | % NC |
|---|---|---|
| S.US.MU | Micron Technology | 260.53% |
| S.US.MRVL | Marvell Tech Inc Cmn | 223.94% |
| S.US.AMD | Adv Micro Devices | 183.95% |
| S.US.INTC | Intel Corp | 183.74% |
| S.US.ARM | Arm Holdings Plc Ads | 143.60% |
| S.US.TER | Teradyne Inc Cmn | 108.04% |
| S.US.ALAB | Astera Labs, Inc. | 105.70% |
| S.US.AMAT | Applied Materials | 97.30% |
| S.US.ENTG | Entegris Inc ## | 96.78% |
| S.US.TSEM | Tower Semiconductor | 94.78% |
| S.US.MTSI | Macom Technology S | 92.70% |
| S.US.LRCX | Lam Research Corp | 86.26% |
| S.US.SITM | Sitime Corp Cmn Stk | 73.38% |
| S.US.LSCC | Lattice Semicond ## | 71.31% |
| S.US.COHR | Coherent Inc. | 69.38% |
| S.US.ASML | Asml Hldg Ny Reg | 66.41% |
| S.US.TXN | Texas Instruments | 63.55% |
| S.US.KLAC | Kla Cp Cmn Stk | 60.96% |
| S.US.Q | Qnity Electronics Inc. | 55.05% |
| S.US.MPWR | Monolithic Power Sys | 52.95% |
| S.US.CRDO | Credo Tch Gp Hld Ord | 50.50% |
| S.US.ADI | Analog Devices Inc | 49.78% |
| S.US.TSM | Taiwan Semiconductor Manufacturing Co | 49.17% |
| S.US.ON | On Semiconductor | 43.18% |
| S.US.GFS | Globalfoundries Ord | 38.14% |
| S.US.NVDA | Nvidia Corporation | 22.94% |
| S.US.MCHP | Microchip Technology | 18.57% |
| S.US.NXPI | Nxp Semiconductors | 4.82% |
| S.US.AVGO | Broadcom Inc. | 4.46% |
| S.US.QCOM | Qualcomm Inc | 2.60% |
Below is an image of the downloadable Excel Dashboard. During the trading session, the Excel dashboard dynamically ranks the individual stocks held by SOXQ.
The Excel dashboard displayed below shows the top fifteen positive and bottom fifteen negative performers as histogram bar charts, along with their respective net percent change for today's trading session.
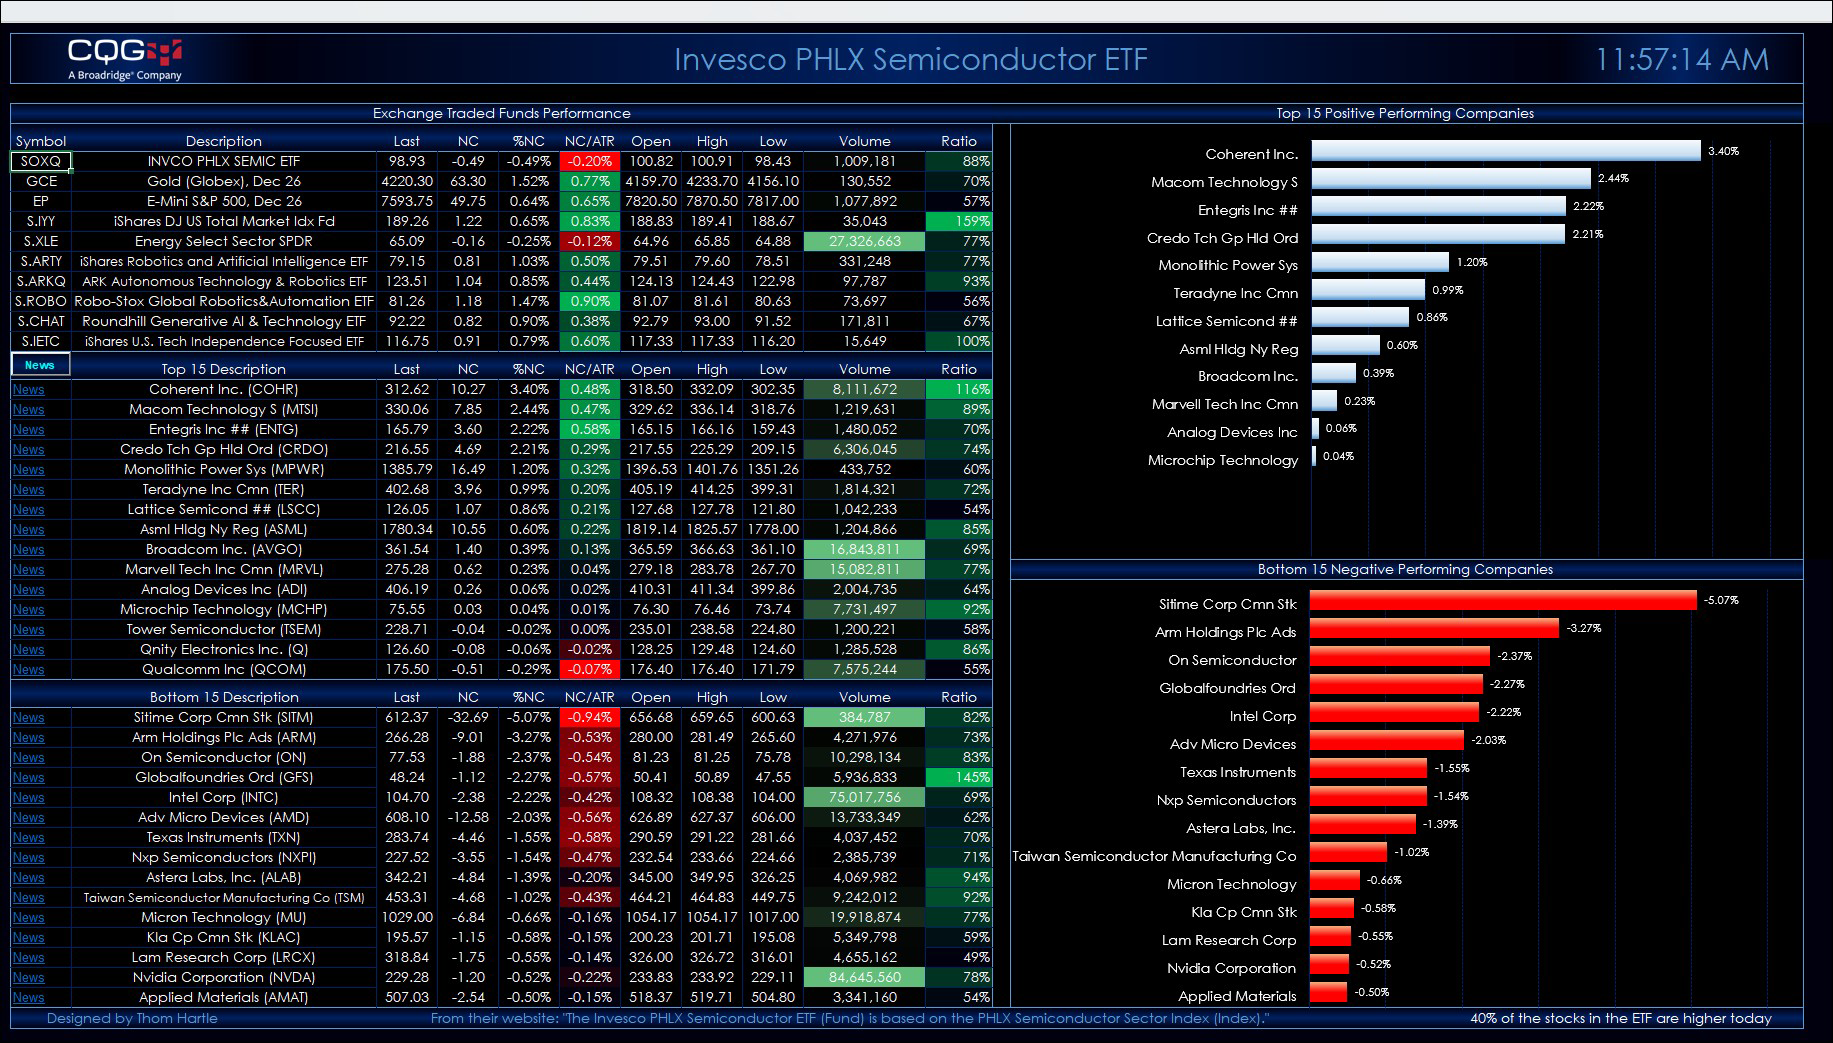
The top section of the quote display allows you to enter your own symbols.
The second section displays the top fifteen performers. The third section displays the bottom fifteen performers.
Quote data includes today's net change as a ratio to the 21-day Average True Range study. Next to today's traded volume is a column that calculates the ratio of today's volume versus the 21-day average of the volume. This ratio column gives you a sense of how active today's trading is relative to recent history. Readings of 100% and higher indicate active trading.
A key feature next to each company name is a link to Yahoo Finance. Clicking the News link will take you to the Yahoo page for that symbol. Note that this could take approximately 30 seconds to open in a browser. Turning off Extensions in your browser will make this happen faster.
If you open another Excel spreadsheet, then this dashboard will no longer be the active spreadsheet. The macro that updates the links and ranks the stocks by performance will stop. To start the macro, simply click the News toolbar button in the first column.
The current holdings are as of 10/09/2026. There is a Symbols tab with instructions detailing where to download the latest posted spreadsheet with the current holdings and steps to update the dashboard.
Make sure to lower your Excel Realtime Data (RTD) throttle to 100 milliseconds or lower. Learn how to do that here.
Requires CQG Integrated Client or CQG QTrader, data enablements for the NYSE and Nasdaq.